
- 1. What is Ichimoku Cloud?
- 2. How is the Ichimoku Cloud calculated? Ichimoku Cloud Settings
- 3. How to read Ichimoku Cloud?
- 4. How to Use Ichimoku Cloud?
- 5. Ichimoku Cloud Chart, a complete trading system
- 5.1. Example #1: Ichimoku Cloud trading strategy
- 5.2. Example #2: Ichimoku analysis
- 5.3. Example #3: Ichimoku Cloud trading system
- 6. Good Crypto, the best multi-exchange trading terminal
The Ichimoku Cloud is often considered one of the most complex indicators, simply because its name is uncommon, it shows a lot of data, and it takes a bit of knowledge to understand how it works. However, In technical analysis, having knowledge means you can convert indications into profits. Therefore, trading with Ichimoku Cloud on crypto markets is also extremely popular. This guide is meant to get you started with the Ichimoku Cloud and understand when the indicator gives you sell or buy Ichimoku Cloud signals.
The Ichimoku Cloud is only one of the many professional indicators that Good Crypto provides for you. On top of that, you can connect and trade with over 30 exchanges, place advanced orders, use trading algorithms, receive push alerts, track your portfolio, and much more.
- The Ichimoku Cloud is one of the most complete systems in technical analysis. It shows you the past, present, and projects possible future price movements.
- There are some indications that the Ichimoku Cloud gives you, and everyone adds up to each other. The more positive Ichimoku signals are given, the more likely the price will move up. The more negative Ichimoku signals, the more likely the price will move down.
- The Ichimoku Cloud Indicator is calculated based on periods, which means candles. There are 5 elements of the Ichimoku Cloud: Tenkan Sen, Kijun Sen, Senkou Span A, Senkou Span B,Chikou Span. You will find a calculation formals and much more in this article
What is Ichimoku Cloud?
The Ichimoku Cloud is of Japanese origin, and was developed by Goichi Hosoda. Goichi spent about 40 years developing the indicator, and when it was published in the 1960s the Ichimoku Cloud indicator received a lot of positive comments.
“Ichimoku” is Japanese for “glimpse”
Goichi explained Ichimoku as “what a man sees in the mountains”
The Ichimoku Cloud indicator is one of the most complete systems that you can find in technical analysis. It shows you the past, present, and projects a possible future.
There are 5 lines that create this system. The Japanese names might be confusing at first, but once you have learned them and know how to read them you can make very profitable trades.
Find the visual examples of the elements that create this indicator below.
- Tenkan Sen, shown as the blue line
- Kijun Sen, shown as the red line
- Senkou Span A, the green line of the cloud
- Senkou Span B, the red line of the cloud
- Chikou Span, the green line that moves behind the price
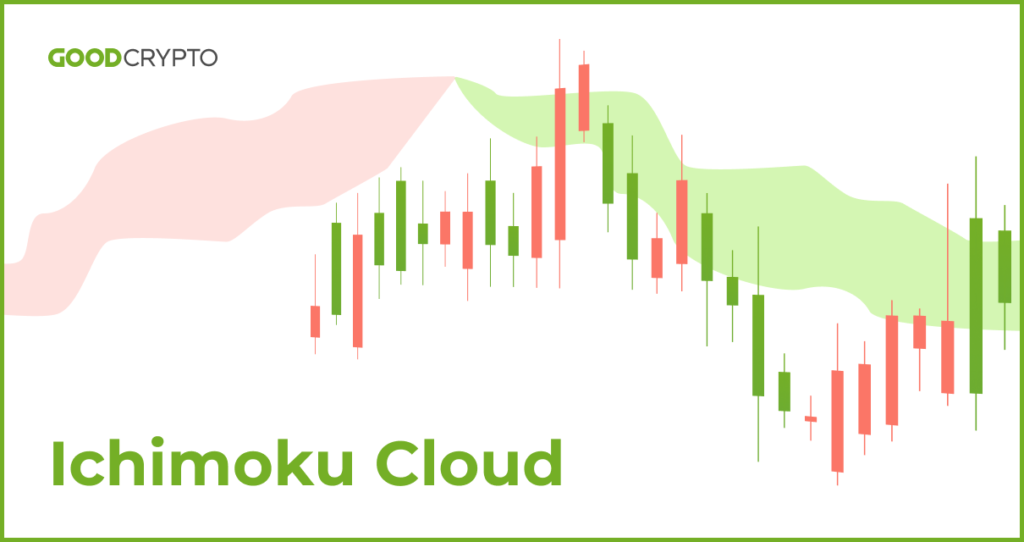
The space between the Senkou Span A and B is the cloud, or Kumo. This space is filled green when the Senkou Span A is above B and will be filled red when the Senkou span B is above A.
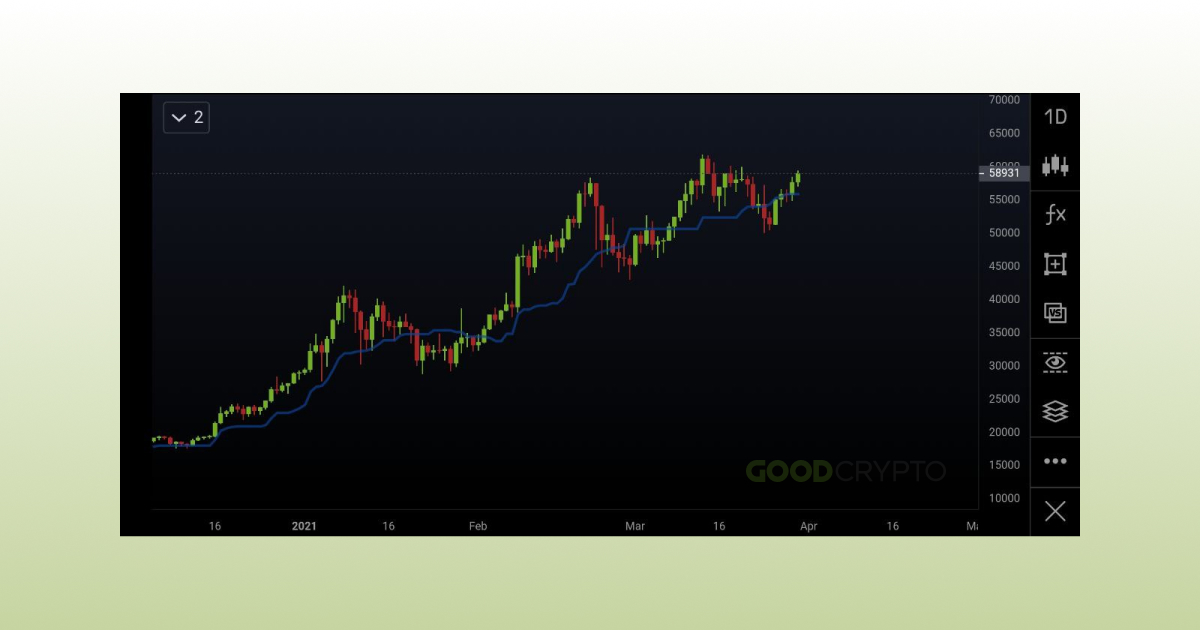

The Tenkan Sen.
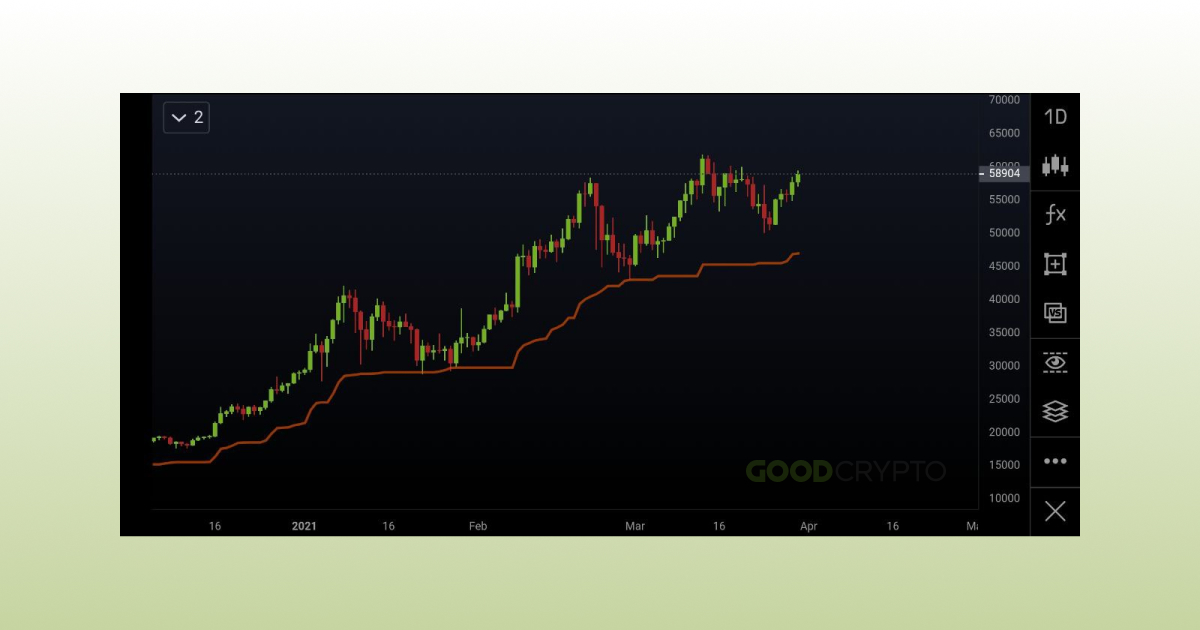
The Kijun Sen.
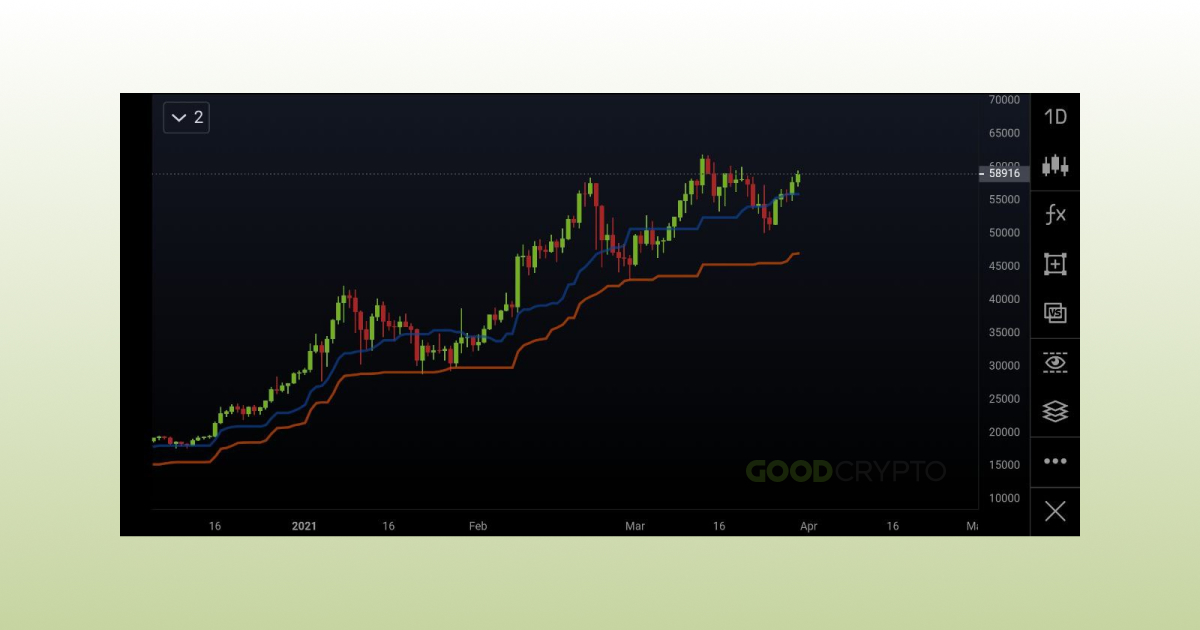
The Tenkan Sen (blue) and Kijun Sen (orange) together.

The top and bottom of the cloud.
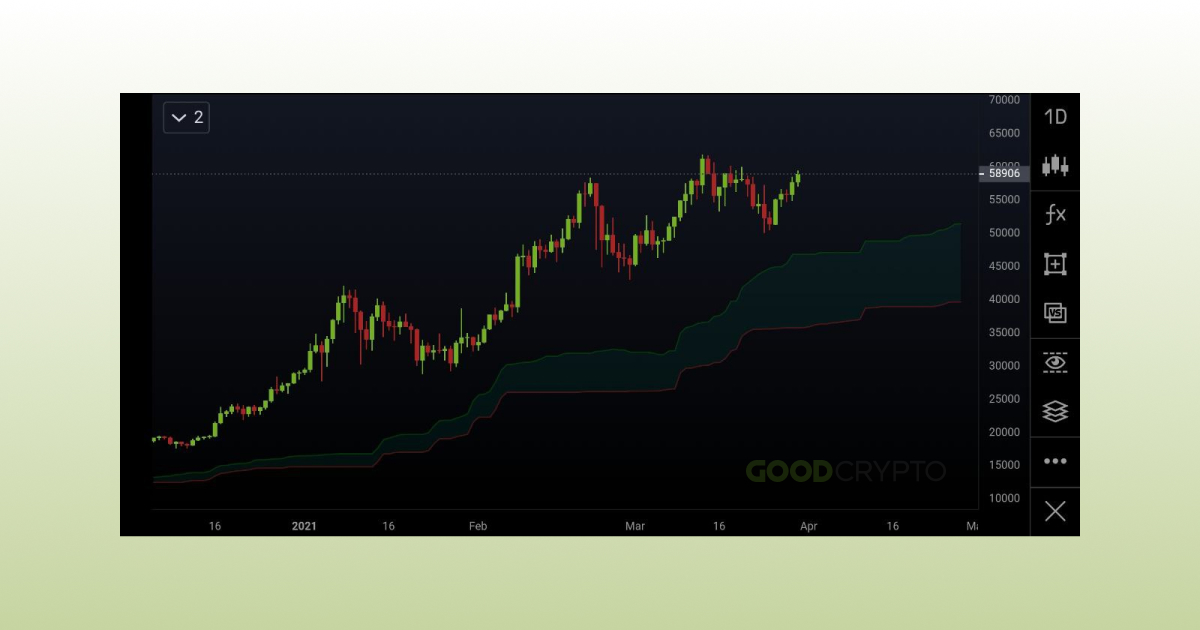
The top and bottom filled in creating the cloud, also known as the Kumo.
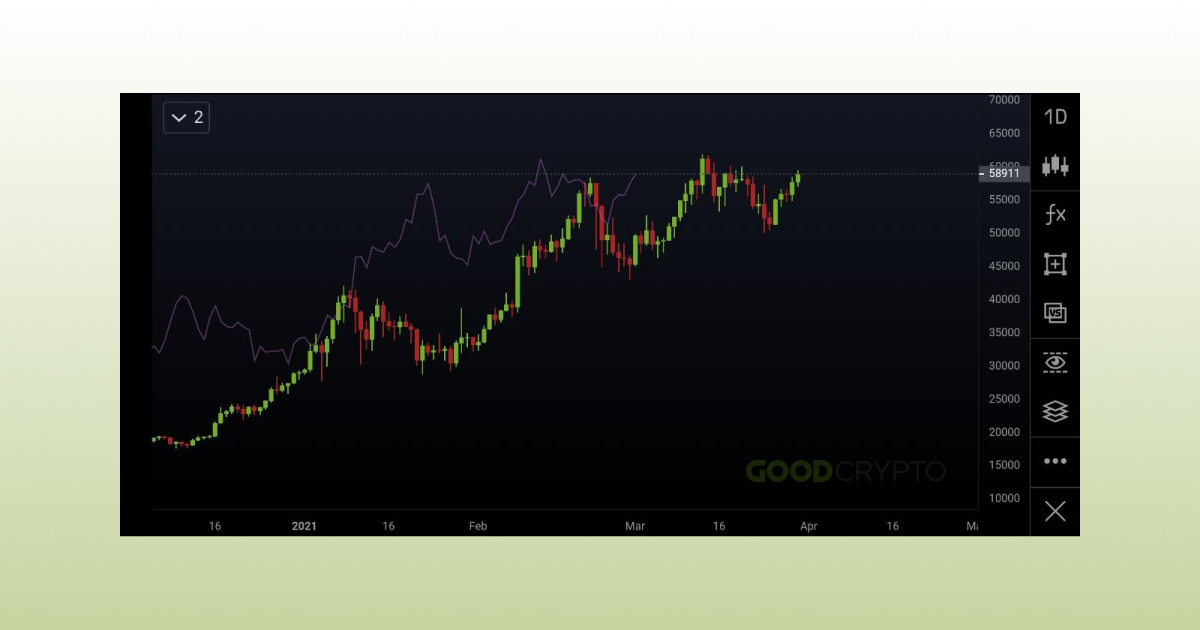
The Lagging Span.
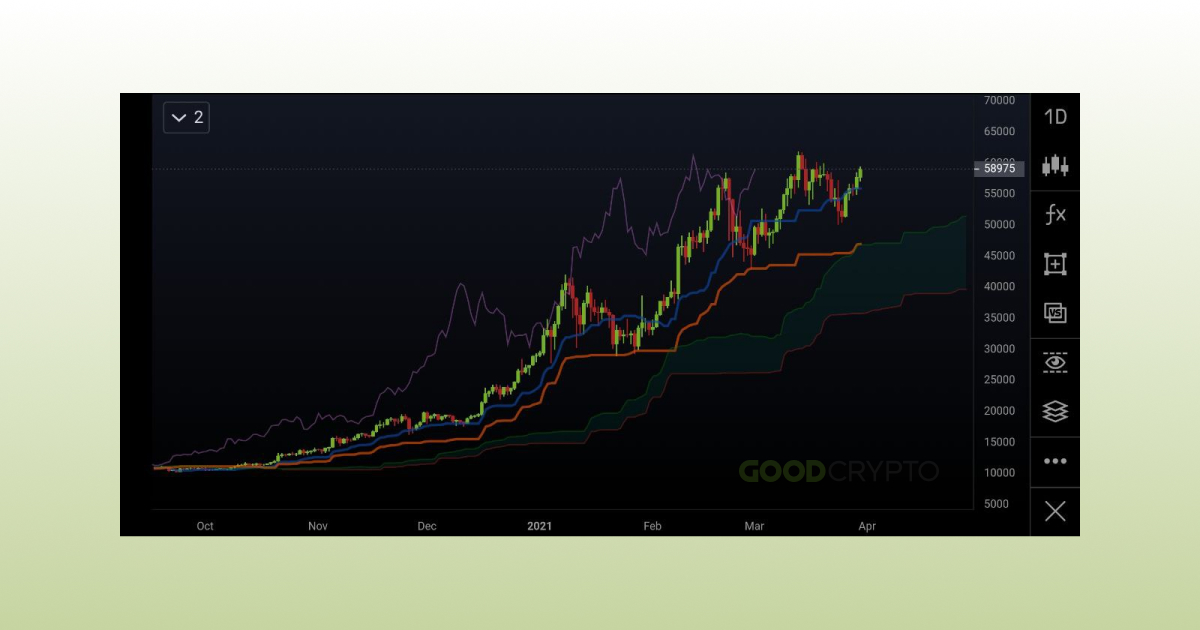
Bringing all the elements together, showing BTCUSD on the daily chart.
How is the Ichimoku Cloud calculated? Ichimoku Cloud Settings
The Ichimoku Cloud Indicator is calculated based on periods, which means candles. When you are observing a Daily chart, it means that one period or candle equals one day. The original Ichimoku Indicator was based on the traditional markets which close during weekends. Therefore, the Ichimoku Cloud crypto settings must be different, as it must include the weekend.
The Ichimoku Cloud crypto indicator settings are:
- Tenkan Sen: 20
- Kijun Sen: 60
- Senkou Span A and B: 120
- Displacement: 30
The displacement set at 30 represents 1 month on a daily chart. The displacement defines how far ahead the projection of the cloud is, and how far back the Chikou Span is lagging behind. This creates both the future and the past elements in the indicator.
The calculations are:
- Tenkan Sen = (20-Period Highest High + 20-Period Lowest Low) / 2
-
Kijun Sen = (60-Period High + 60-Period Low) / 2
-
Senkou Span A = (Tenkan-Sen + Kijun Sen) / 2
-
Senkou Span B = (120-Period High + 120-Period Low) / 2
-
Chikou Span = 30 placed to the left / in the past
As you can see, the Tenkan Sen and Kijun Sen are not Moving Averages, which is a common misinterpretation. Are you curious what a Moving Average is, or how to trade it? Find our guide here!
The Senkou Span A and B perfectly represent 120 periods. On a daily chart, that means it’s exactly 4 months of information.
How to read Ichimoku Cloud?
The Ichimoku Cloud crypto indicator is especially strong on the daily chart. You can also use it on lower time frames, perhaps the 12H and the 4H, but it will be incredibly strong for the daily time frame especially. The reason for this is because it’s based on time, and provides an overview of the market that includes weeks of information.
A high timeframe means it has a lot of time, a low timeframe means it shows very little time. A daily or weekly timeframe is therefore high, and a 5-minute or 15-minute timeframe is called a low timeframe.
The Ichimoku Cloud indicator consists of 3 parts. The cloud itself, the Tenkan Sen and Kijun Sen, and the Chikou Span. The cloud projects the future based on the past, the Tenkan Sen and Kijun Sen follow current movements, and the Chikou Span represents the past.
The indications that the Ichimoku Cloud gives are numerous. Every one of these indications adds up to each other. This means, the more positive Ichimoku signals are given, the more likely the price will move up. And, the more negative Ichimoku signals are given, the more likely the price will move down.
- The easiest and quickest way to read the Ichimoku Cloud is by looking at where the price is moving in comparison to the cloud itself.
+ If the price is moving above the cloud, the market is in an uptrend.
– If the price is moving below the cloud, the market is in a downtrend. - Another indication of the trend is the color of the cloud itself. The last part of the cloud will give an idea of where potentially the price will go.
+ If the cloud is green, the price is likely to move up in the near future.
– If the cloud is red, the price is likely to move down in the near future. - A third indication is based on the Tenkan Sen and Kijun Sen.
+ If the Tenkan and Kijun Sen are above the cloud, it’s positive.
– If the Tenkan and Kijun Sen are below the cloud, it’s negative. - The fourth indication is based on the Chikou Span.
+ If the Tenkan Sen is above the Kijun Sen, it’s positive.
– If the Tenkan Sen is below the Kijun Sen, it’s negative.
- The fifth and final indication is also based on the Chikou Span.
+ If the Chikou Span is above the cloud, it’s positive.
– If the Chikou Span is below the cloud, it’s negative.
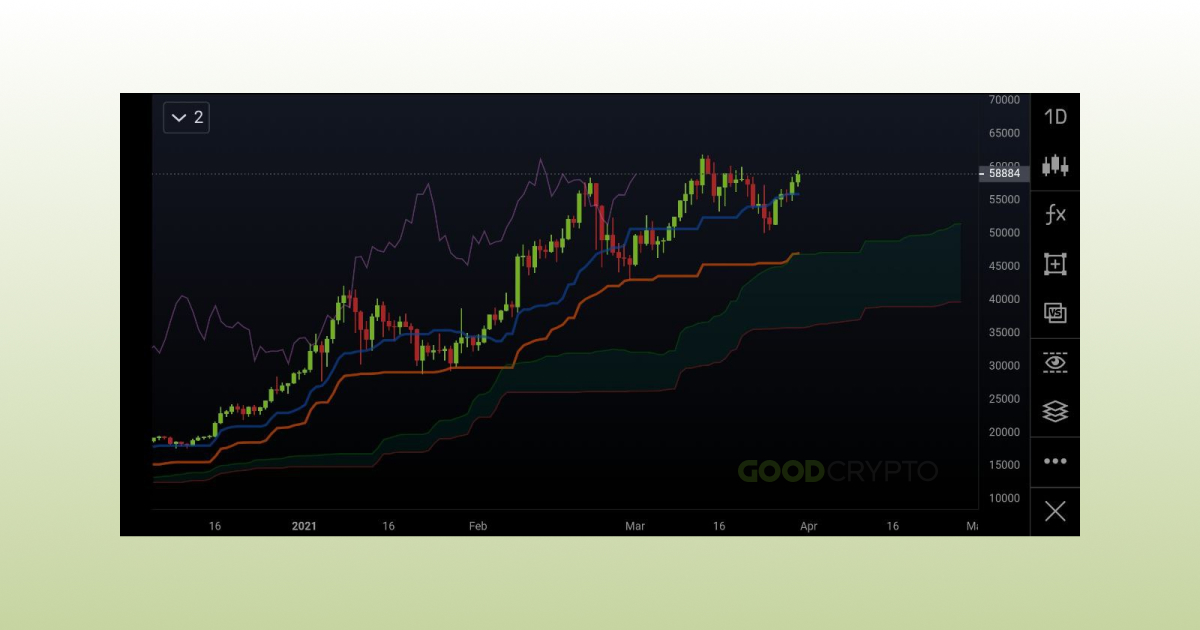
Analyzing this Ichimoku Cloud Bitcoin chart after we have seen all the bullish and bearish indications, we can say that this chart looks positive.
- The price is above the cloud
- The future color of the cloud is green
- The Tenkan (Blue) and Kijun Sen (Red) are above the cloud
- The Tenkan Sen (Blue) is above the Kijun Sen (Red)
- The Chikou Span (Purple) is above the cloud
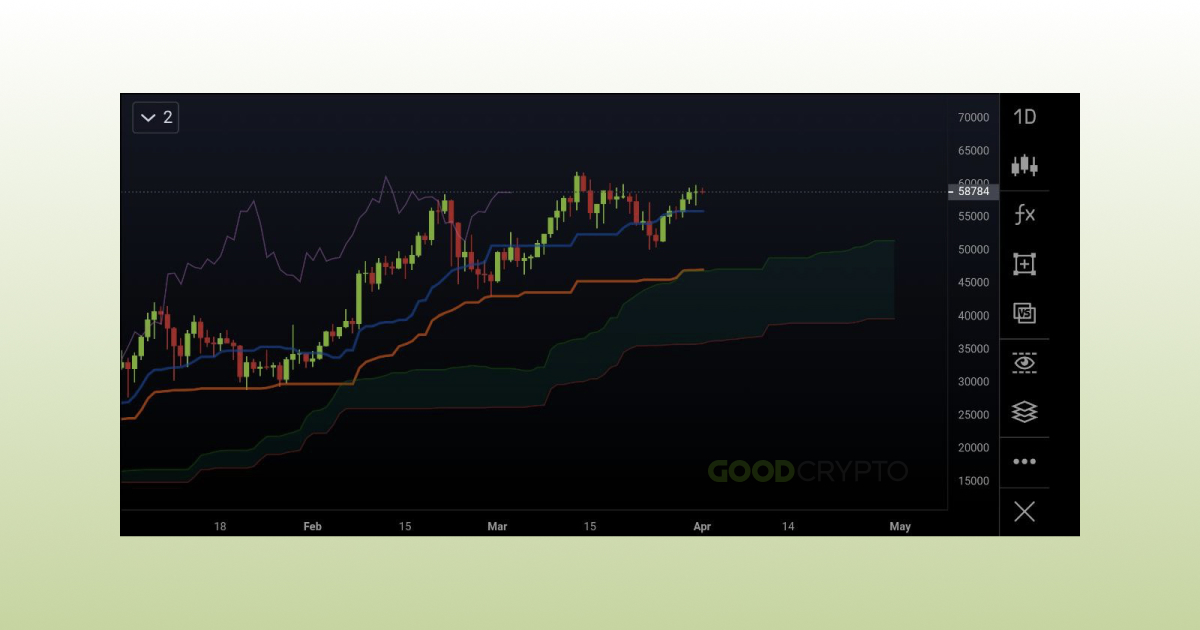
Analyzing this chart after we have seen all the bullish and bearish indications, we can say that this chart looks negative.
- The price is below the cloud
- The future color of the cloud is red
- The Tenkan (Blue) and Kijun Sen (Red) are below the cloud
- The Tenkan Sen (Blue) is below the Kijun Sen (Red)
- The Chikou Span (Purple) is below the cloud
The more positive indications you add up, the more chance you have for a positive price movement. When adding up negative indications, the price is more likely going to move down. It’s important to add up these indications, and not simply think the price is going up or down based on only one indication.
Important! When the price is moving inside the cloud, there is no trade to be made, according to the Ichimoku trading system. It’s a no-trade zone. Only when there are clear signals, you are able to place a trade.
How to Use Ichimoku Cloud?
How are trades exactly created and how to use the indicator?
The indicator is the strongest on a daily chart, which means it can make you enter positions that last for a long time. The Ichimoku Cloud day trading or Ichimoku intraday trading is less ideal, however, it’s more ideal for trades that last several days or even weeks. Let’s take a look at some examples with charts attached.
The Ichimoku Cloud Bitcoin chart.
Ichimoku Cloud Chart, a complete trading system
The importance of respecting the signals given by the Ichimoku Cloud cannot be avoided by any trader. However, it’s important to respect the rules of the system. Do not trade when the price is inside the cloud, and only open a trade when you have received all 5 Ichimoku signals in your favor. Patience is an important element of trading, especially crypto trading, and nothing should be rushed. When the signals are given, you can trade in the most secure way possible.
Very few traders can keep a cool head when trading. That’s why using a system that is as complete and profitable as the Ichimoku Cloud strategy is so effective in crypto.
Example #1: Ichimoku Cloud trading strategy
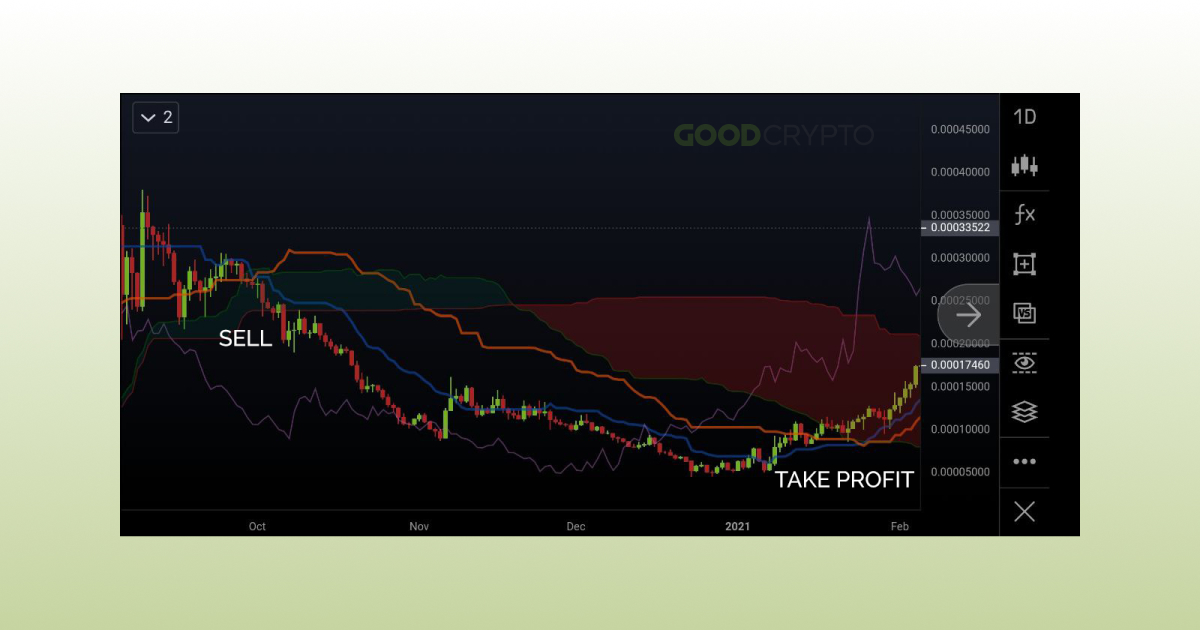
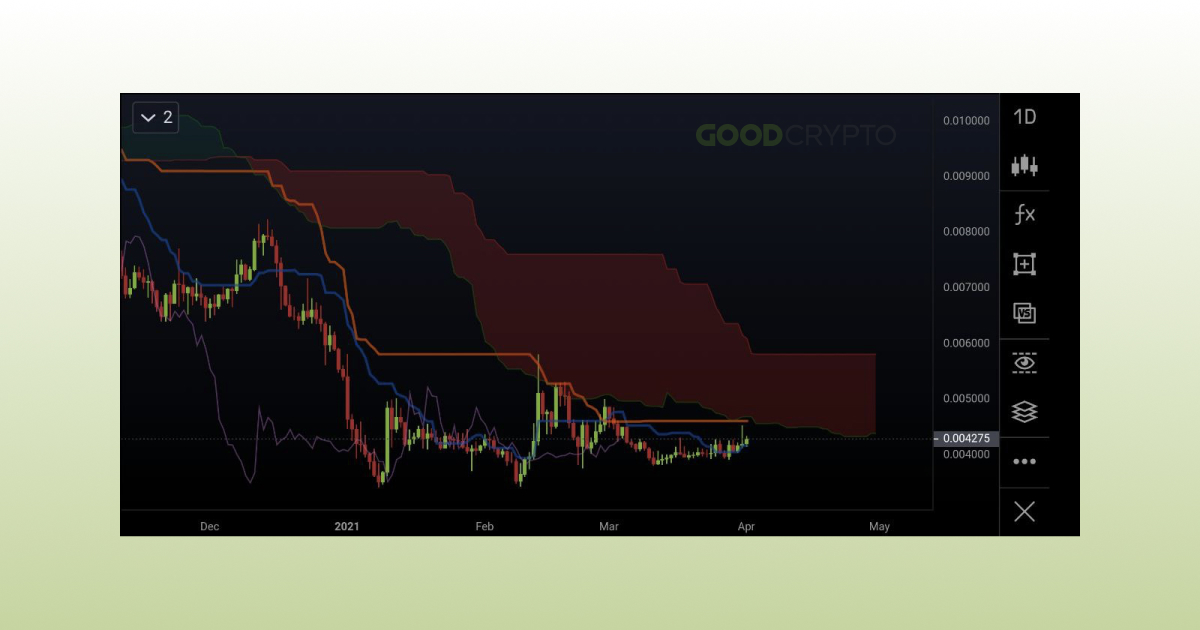
In this example of XMR/BTC there is a short position made. You can see how around the Sell zone, all the Ichimoku signals turned bearish. The Tenkan Sen and Kijun Sen went below the Cloud, the Lagging Span below the price, the Cloud twisted red, and the price went below the Cloud.
Once you have confirmed every single one of the signals being bearish, you can open your short. This would ideally be around 0.000020000.
Once the trade is open, you can look for the first reversal signals to appear, which might indicate the end of the downtrend. There’s different options: when the Chikou Span (Purple) touches the price, when the Kijun Sen (Red) crosses the Tenkan Sen (Blue), or when the price has crossed the Kijun and Tenkan Sen. These would be the opposite signs of the Ichimoku trading strategy you have opened the trade to start with.
Reminder: Ichimoku trading strategies always come down to seeing all the 5 elements becoming either bullish or bearish. Once you have all the confirmations, a trade can be opened.
Example #2: Ichimoku analysis
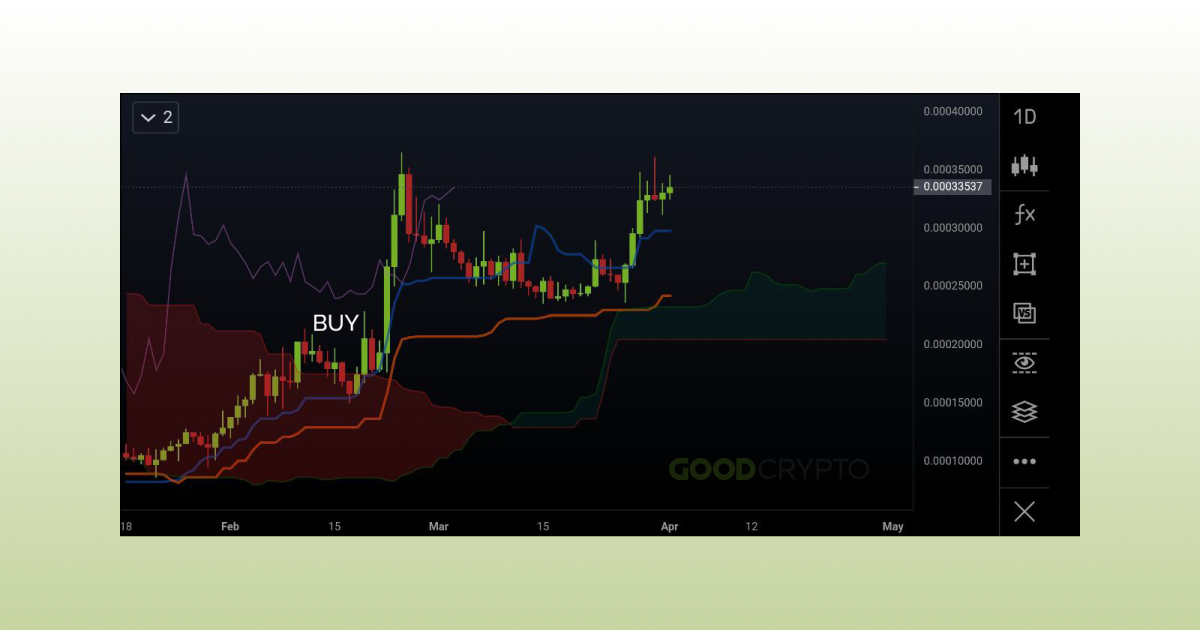
This example of the SOL/BTC chart shows a newly made collection of bullish signals, and a Buy was confirmed. The price is above the cloud, the cloud is green, the Tenkan Sen (Blue) and Kijun Sen (Red) are bullish, Chikou Span (Purple) is above the price and the cloud, and we clearly made support of the Kijun Sen because we see the price has bounced right above the line. A Stop Loss order can be placed under the cloud at 0.00020000, or under the Kujun Sen which acted as support level before.
All 5 signals are bullish, and so a long position can be opened.
Take Profit will depend on the price action and the signals given in the future. Closing options are the same as described in the previous example. What you want to look out for is your bullish indications to end, according to the 5 elements of the Ichimoku chart trading system and Ichimoku trading signals we have described above.
To conclude:
You open the trade when all 5 signals are bullish.
The Stop Loss is placed below the support levels, for example the Kijun Sen or the cloud itself.
The trade will be closed when you no longer see all 5 signals being bullish. The moment you see 1, or 2 signals become bearish, the trade can be closed.
Example #3: Ichimoku Cloud trading system
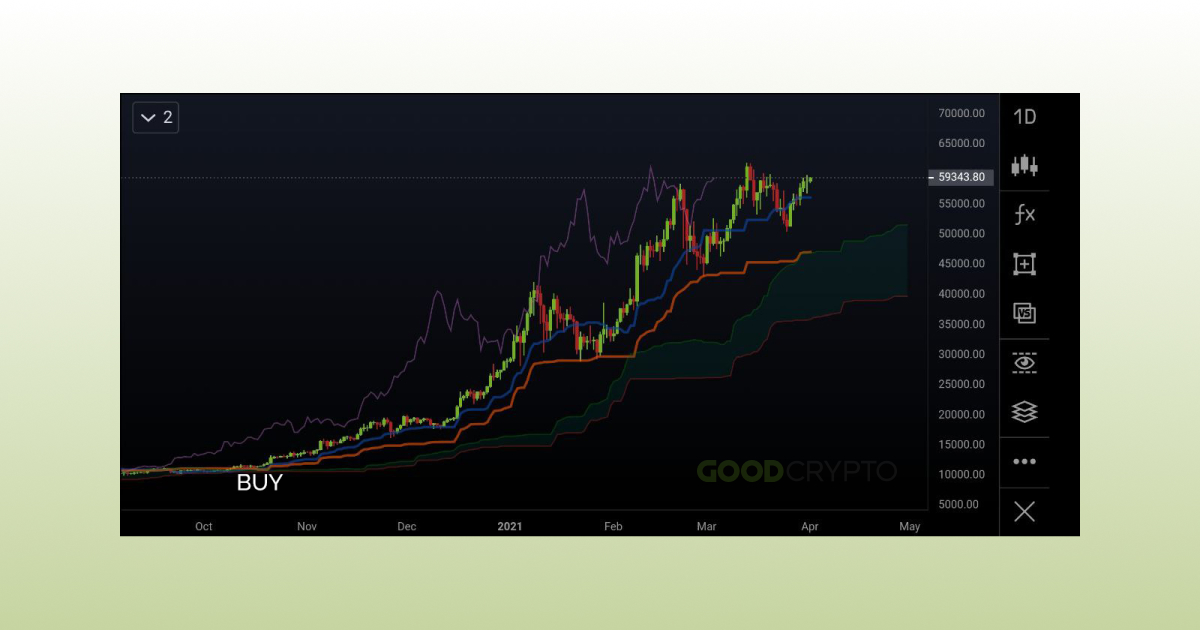
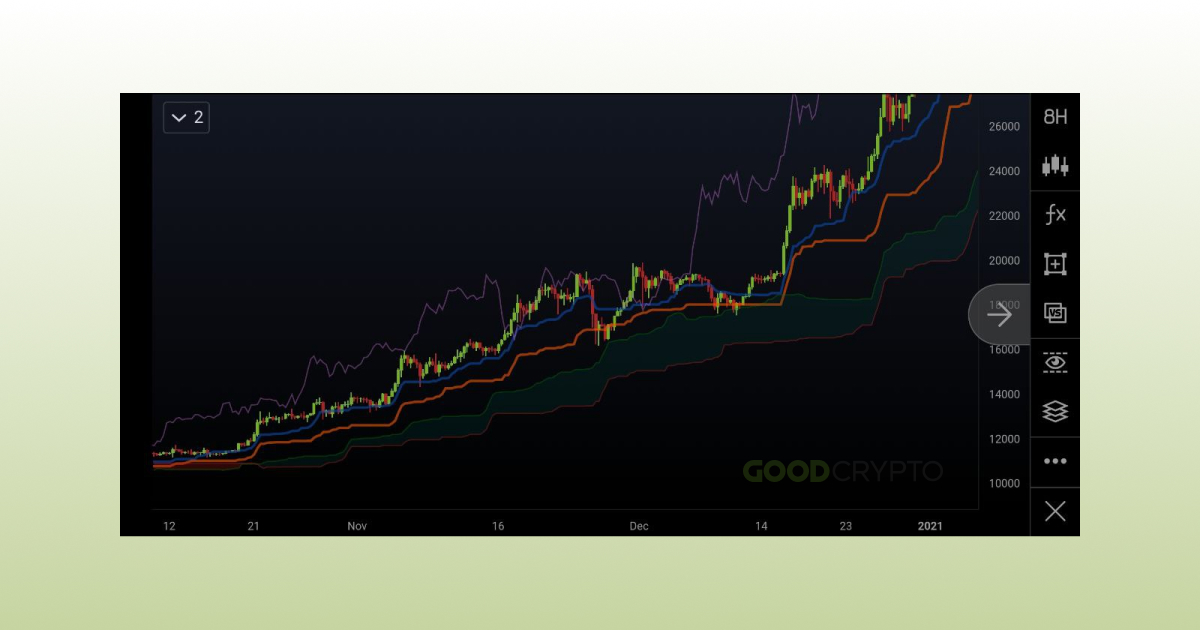
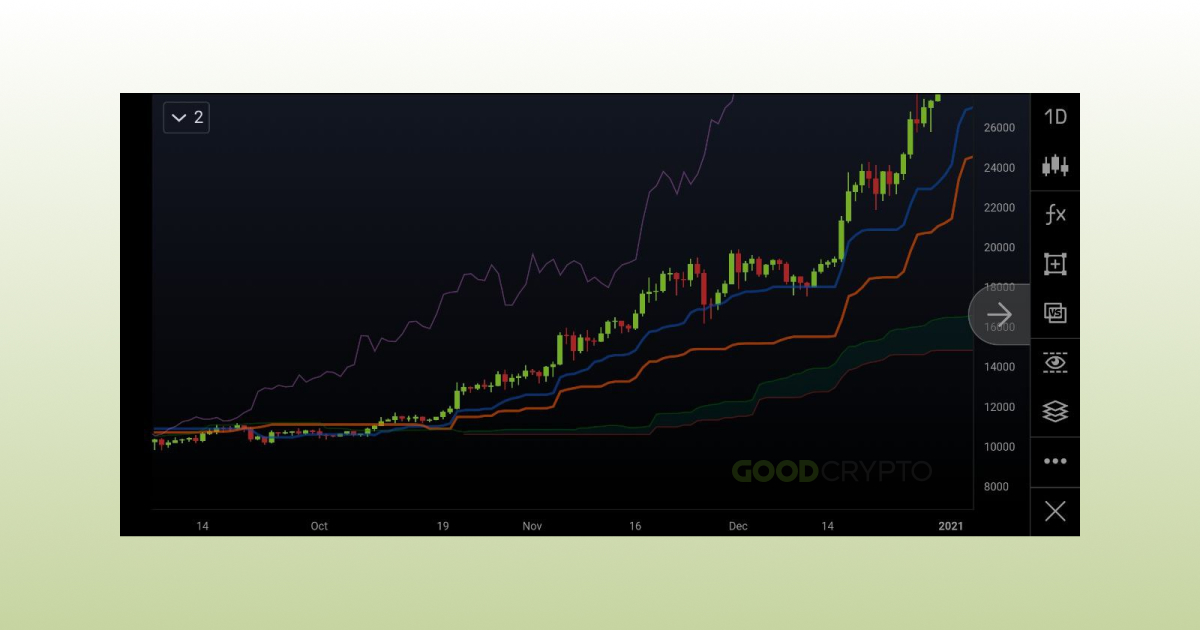
This beautiful example shows Bitcoin on the daily Ichimoku chart. Every indication in the Ichimoku strategy that should be bullish, became bullish around October 2020. In the meantime, the Kijun Sen (Red) has acted perfectly as support. As long as this support remains the price is in a bullish trend. The Ichimoku trading system is very profitable here.
The entry point was around $10,000. The Stop Loss would have been placed below the cloud at that point, around $9,000. Taking Profit will ideally only happen when one of the bullish signals turns bearish, which is not yet the case at the point of writing this article.
Good Crypto, the best multi-exchange trading terminal
When it comes to trading with professional indicators like the Ichimoku Cloud, you need not only the advanced charts that support that indicator, but also professional trading tools like advanced orders or trading algorithms.
Good Crypto is the perfect trading application for both amateur and professional traders. Every tool you need to trade cryptocurrencies and become profitable is combined into one application.
- Connect over spot and derivatives 30 exchanges and trade anywhere at any time on iOS, Android, or Web
- Track all your trades and follow the performance of your portfolio in an aggregated portfolio overview
- Take your trading to the next level with advanced order types like Trailing Stop, Trailing Take Profit, Stop Loss and Take Profit combos and more all without freezing your balance
- Automate your trading with trading algorithms from Grid and DCA to Infinity Trailing and more
- Smart and auto alerts will notify you of market movements, new exchange listings, or when your manual price notification has been reached
Not convinced yet?
Find Good Crypto on both the iOS App Store and the Android Play Store and discover the most advanced cryptocurrency application on the market for free!
Do you have questions?
Connect with the public chat room in Telegram and ask anything, 24/7.