
Many traders know the expression “the trend is your friend”.
It is said that when a market is moving up, it’s more likely to keep going up. Also, when a market is moving down, it’s more likely to keep going down. There is even a special term for it – Momentum, and the Momentum strategies are very popular in traditional financial markets and are successfully employed by many leading hedge funds. But how exactly do you spot a trend?
Moving averages are vital for any kind of trader, and work well on any timeframe. Many other indicators are based on Moving Averages, such as the MACD oscillator or the Bollinger Bands indicator, from which you can find the guide here. The Moving Average indicator might be the most important and most used indicator in any field of trading. Furthermore, these indicators can signal whether to buy or sell a certain asset. In the goodcryptoX app, these signals are generated automatically based on 15 Moving Averages and 10 Oscillators, with the primary goal of helping traders find the perfect moments to enter or exit positions.
In this article, we’ll make sure that you understand the difference between various kinds of moving averages, such as Simple Moving Average (SMA), Exponential Moving Average (EMA), Weighted Moving Average (WMA), and Hull Moving Average (HMA), know how they are calculated, and how you can trade crypto using them. Combined with the goodcryptoX app, moving averages can help you become and remain a profitable trader. Let’s get started!
what is a Moving Average?
Moving averages simplify and smoothen price fluctuations, reducing the noise and giving you a better idea of which direction the market is going, and where it might potentially go. Reducing noise from a chart will give you a much clearer picture of what is happening.
While Moving Averages are incredibly useful in providing you insight, you need to be aware that they don’t predict future performance. Rather, they confirm established trends.
From now on, we will call the Moving Average simply MA.
When we talk about timeframes, we consider the daily or weekly timeframe a “high timeframe,” and 5 minutes or 15 minutes is considered a “low timeframe.”
How are Moving Average Calculated?
MA’s are calculated by summing up the previous data points, or candles, which are then divided by the number of points.
What does this mean?
A 20 MA is derived from summing up the previous 20 periods, divided by 20.
A 100 MA is derived from summing up the previous 100 periods, divided by 100.
Easy!
Crypto Moving Average is calculated in the same way.
types of Moving Averages
There are different ways of interacting with markets. Long-term investing, intermediate trades, or short-term “swing” trading are the three most common ways of trading. Because of the slow-moving nature of the traditional Simple Moving Average, analysts started to look for a solution that provides faster signals. This is how the variety in MA’s was born.
Let’s take a look at the most common types of Moving Averages and their differences. We will start with the Simple Moving Average definition.
Simple Moving Average (SMA)
So what is simple moving average? The Simple Moving Average, or SMA indicator, is calculated based on the closing price of a period. A ‘period’ means a candle. For example, the closing price of 3 periods or candles is summed up and then divided by 3. Every period in the calculation has the same weight. We will look into what that means once we go over the next types of MA’s.
An example: we have 3 periods, $50, $45, and $60.
The Simple Moving Average formula is: 50 + 45 + 60 = 155 / 3 (the number of periods) = 51.66 as a 3 SMA.
The SMA in trading is very smooth and is at its strongest as a long-term indicator, on any timeframe.
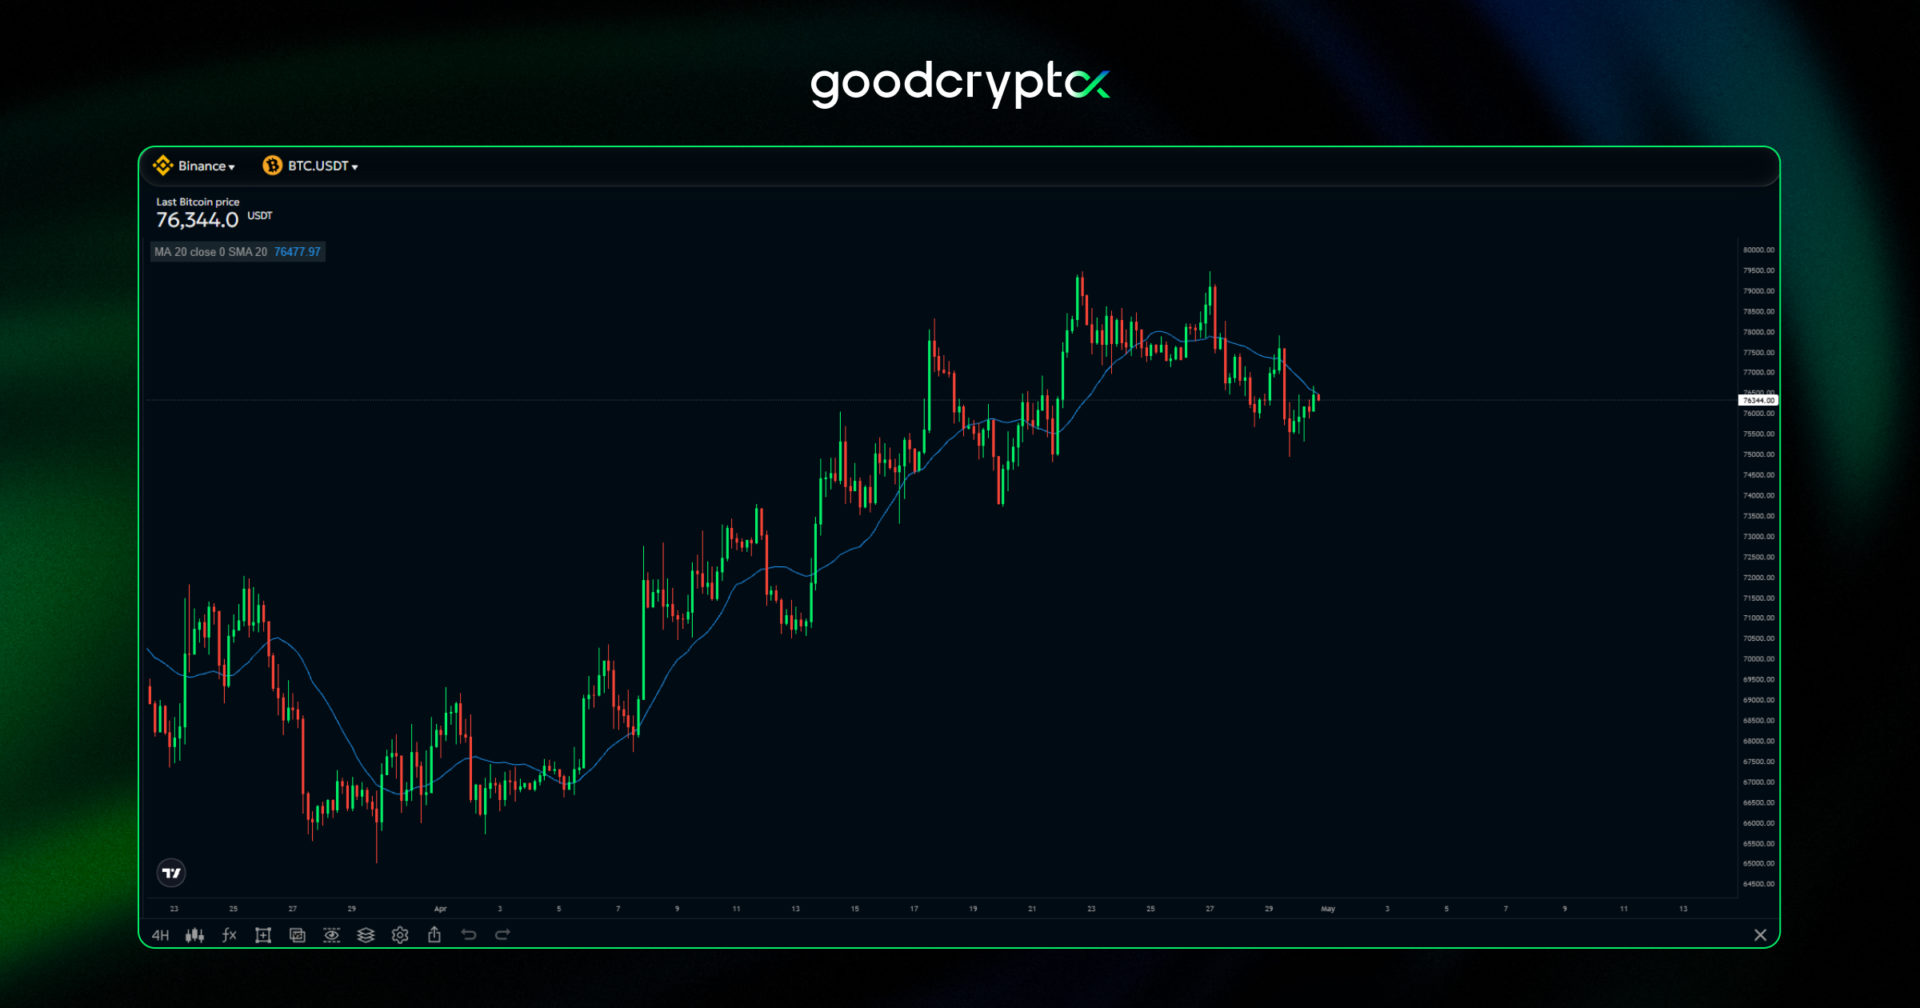
A 20 SMA on the 4H chart of BTC/USDT
Weighted Moving Average (WMA)
The Weighted Moving Average, or WMA, gives more weight to the last periods but not exponentially. This makes the indicator a little less fast than the EMA line, but faster than the SMA line. The first period in the calculation has the least weight, the middle point has an average weight, and finally, the last period in the calculation has double the weight of the middle point. The more recent a period is, the more weight it carries in the calculation. Let’s take a look at the Weighted Moving Average formula.
In the calculation of the WMA, each period has a weight. If we have 3 periods, the first will weigh 1, the second 2, and the last 3. For example, [(1 x $60) + (2 x $45) + (3 x $50)] = 300.
The sum of the periods is 1+2+3 = 6.
So we have (60 + 90 + 150) / 6 = 50 as a 3 WMA.
This results in a faster-moving WMA, responding faster to the latest price action than a traditional SMA line does.
In traditional trading and crypto, Weighted Moving Average is stronger as a short-term indicator than the SMA, it gives a more dynamic result that works better for intermediate or short-term trades.

The 20 WMA on the 4H chart of BTC/USD.
Exponential Moving Average (EMA)
So what is EMA? The Exponential Moving Average, or EMA indicator, gives exponentially more weight to the recent periods. This makes the indicator move much faster, therefore making it better suited for short-term trading and explaining why many traders debate EMA vs SMA when building their setups. In terms of the EMA formula, the calculation uses a multiplier applied for smoothing and to give more weight to the latest periods, this is also why it is sometimes called an exponentially weighted moving average.
Calculating the multiplier, or smoothing factor, goes as such: [2 ÷ (number of periods + 1)].
For a 3-day moving average, the multiplier would be [2/(3+1)]= 0.5.
Then, we get the following Exponential Moving Average formula: Closing price x 0.5 + EMA (previous day) x (1 – 0.5).
For example: 1 EMA = 60(1) = 60
2 EMA = 0.5 * 45 + (1 – 0.5) * 60 = 52.5
3 EMA = 0.5 * 50 + (1 – 0.5) * 52.5 = 51.25, is our 3 EMA
In EMA trading, the indicator is strong as a short-term indicator, it gives a more dynamic result that works best for short-term trades and swing trading. You can use the EMA on any timeframe, but it will be stronger on higher timeframes (4H+). More data, which means more time, will give more reliable signals.

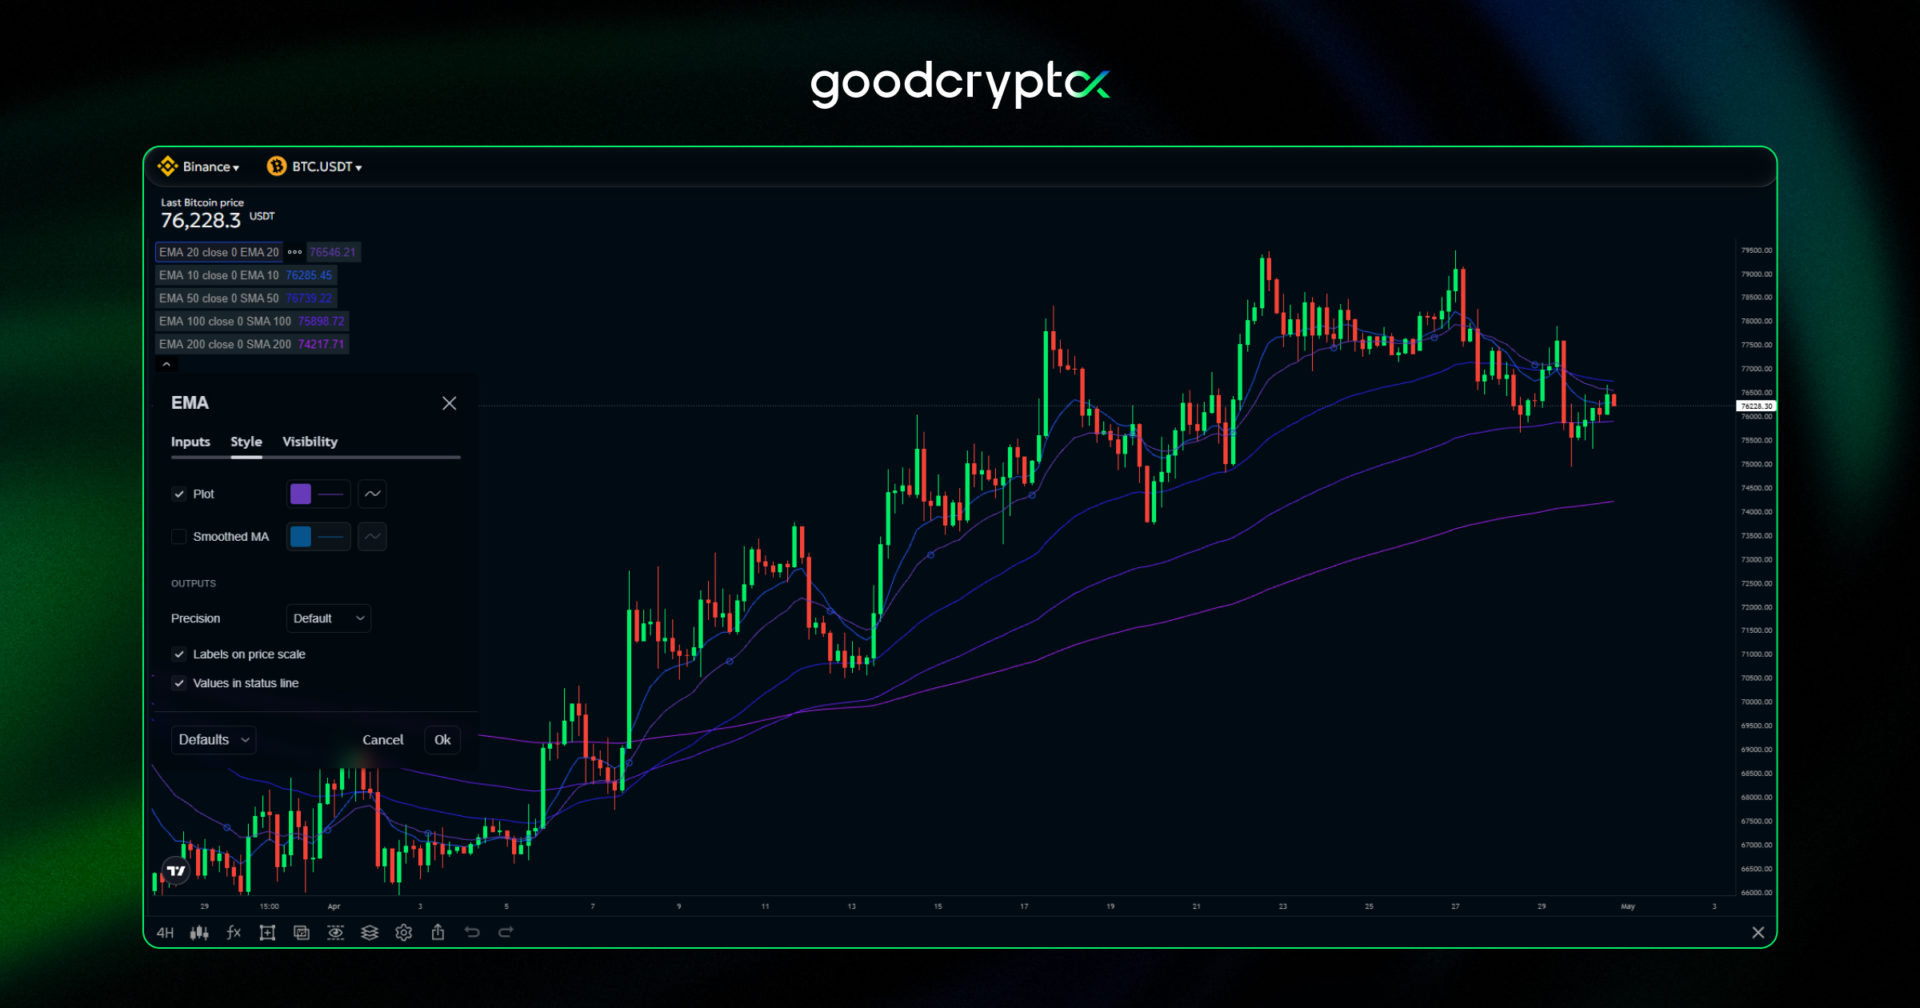
A 20 EMA on the 4H chart of BTC/USDT
Hull Moving Average (HMA)
So what is Hull Moving Average? The HMA was developed by Alan Hull with one goal: to eliminate lag while keeping the line smooth. Traditional moving averages force a trade-off between speed and smoothness. The HMA solves this by combining multiple Weighted Moving Averages in a way that lets the indicator react quickly to recent price changes without becoming erratic.
The HMA is calculated in three steps. First, calculate a WMA with half the chosen period (n/2). Second, calculate a WMA with the full period (n). Third, apply a final WMA with a period equal to the square root of n, using the raw values from the first two steps.
The Hull Moving Average formula is: HMA = WMA(2 × WMA(n/2) − WMA(n)), √n)
We have 3 periods, $50, $45, and $60.
For a 3-period HMA, n/2 rounds to 2 and √n rounds to 2.
Step 1 − WMA(2) using the last 2 periods (45, 60):
(1 × 45 + 2 × 60) / (1+2) = (45 + 120) / 3 = 55
Step 2 − WMA(3) using all 3 periods (50, 45, 60):
(1 × 50 + 2 × 45 + 3 × 60) / (1+2+3) = (50 + 90 + 180) / 6 = 53.33
Step 3 − Raw value: 2 × $55 − 53.33 = 56.67
A final WMA(2) is applied to smooth the output, giving us a 3 HMA of 56.67.
Notice how the HMA lands higher than the SMA (51.66), WMA (53.33), and EMA (51.25). The subtraction step actively pushes the line toward the most recent price, which is what eliminates lag. The result is not just faster, it is directionally ahead of where the other averages sit.
Hull Moving Average strategy in traditional trading and crypto centers on its ability to identify trend direction earlier than other MAs. When the HMA turns upward, it signals a potential long entry. When it turns downward, it signals a potential short or exit. Because the Hull Moving Average indicator reacts so quickly, many traders use it as a primary trend filter rather than a standalone entry signal, pairing it with volume or momentum tools to confirm moves.
The HMA works well on 1H to 4H timeframes and performs best in trending conditions.

Overview
As you have noticed, using the same data, we have received different yet similar results.
The 3 periods in the example we looked at have a price of $50, $45, and $60, respectively. This is the result.
The 3 SMA is 51.66
The 3 WMA is 53.33
The 3 EMA is 51.25
The 3 HMA is 56.67
A little recap:
- SMA vs EMA, the EMA will react faster to more recent price movements, and the SMA line reacts slower.
- WMA vs. EMA, the WMA reacts faster than the SMA. And the EMA is even faster than the WMA because it gives weight to the latest periods in an exponential way. To simplify: the most recent periods or candles are given more importance. That means the most recent price action will be more important, and that is why it moves “faster”.
- HMA vs. EMA: The HMA is the fastest and smoothest of the four. Where the EMA can overshoot during volatile moves, the HMA corrects for lag at the formula level, giving cleaner signals without the noise.
- A “faster” Moving Average like the WMA, EMA, or HMA, will give a benefit in short-term trading. For long-term trading, an SMA will be smoother and more ideal.
The differences between the SMA, WMA, EMA, and HMA are not dramatic at first glance, but they produce different signals on the chart, particularly at turning points in price action. Let’s look at what the charts tell us now that we have covered the different types of Moving Averages.
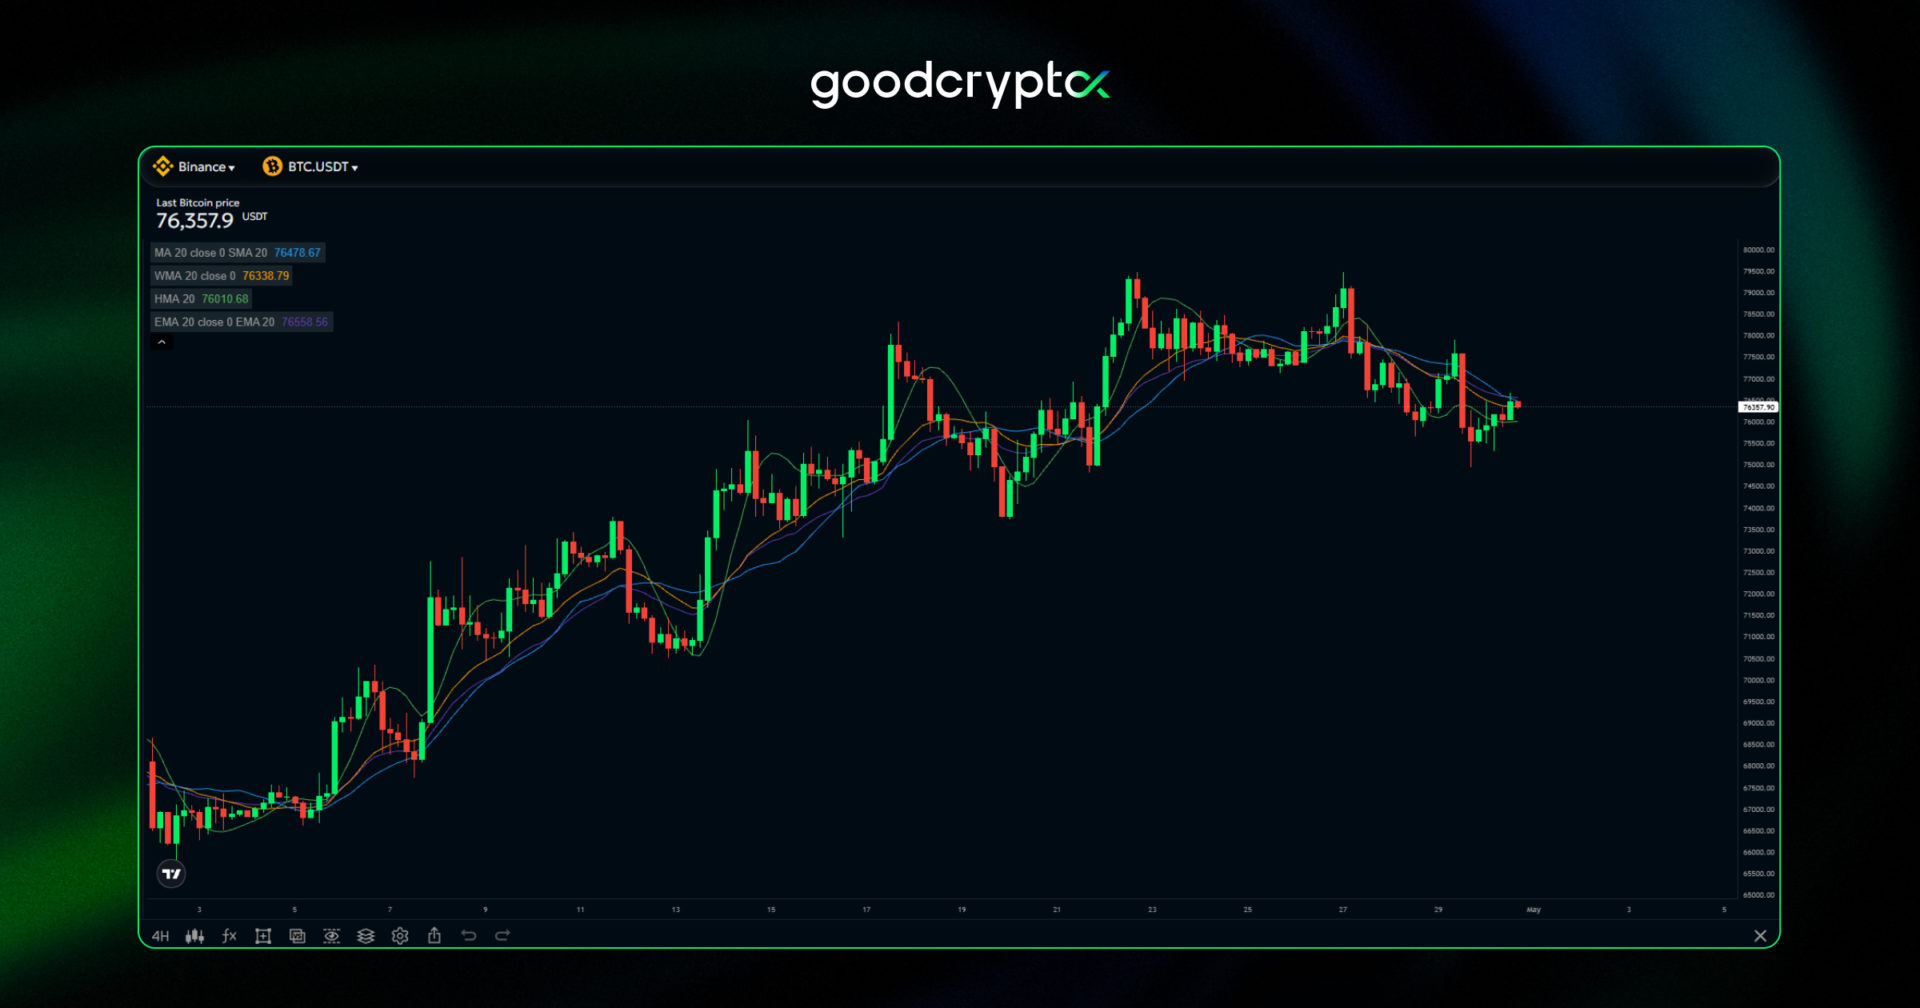
The SMA is blue, the WMA is orange, the EMA is purple, and the HMA is green. The SMA is the flattest and slowest. The WMA stays closer to price. The EMA sits between both. The HMA hugs price action most tightly while remaining smooth, with the least visible lag of the four.
how to use Moving Averages?
best Moving Average settings for crypto trading
Before you start trading based on MA’s, it’s essential to understand that more data will always give a stronger signal. What does this mean?
It means that a Daily chart will give stronger signals than a 15-minute chart.
1 minute < 5 minutes < 15 minutes < 1 hour < 4 hours < 12 hours < 1 day < 1 week
It also means that a MA will give stronger signals when holding more time.
3 MA < 10 MA < 20 MA < 50 MA < 100 MA < 200 MA < 500 MA
As a result, the lower MA’s will indicate the short-term trend, the higher MA’s will indicate the long-term trend.
what Moving Average types are right for me?
The fast Moving Averages like EMA and WMA are more often used for short-term trades, for example, trades that take less than one day or even only a few hours.
However, it’s hard to tell which one is the best, because technical analysis has no right or wrong. There are many tools, and trading is possible with every tool available. The only way to know which one is best for you is by testing and making paper trades. This means… create a system and trade it without money! If your system works and consistently makes good results, your system is valid. One person will find the SMA the best moving average for crypto, but someone else might find the EMA better.
Remember, risk management is the most crucial aspect of trading.
Make sure that you don’t invest what you aren’t willing to lose, and always use a Stop Loss order. When using the goodcryptoX app, you can place Stop Loss orders immediately when placing a trade. A Stop Loss order will be your safety exit in case your technical analysis has proven to be invalid. When a Stop Loss order hits, we recommend that it doesn’t cost you more than 1% or 2% of your total portfolio.
Now, let’s look at how we can trade this very simple but essential indicator!
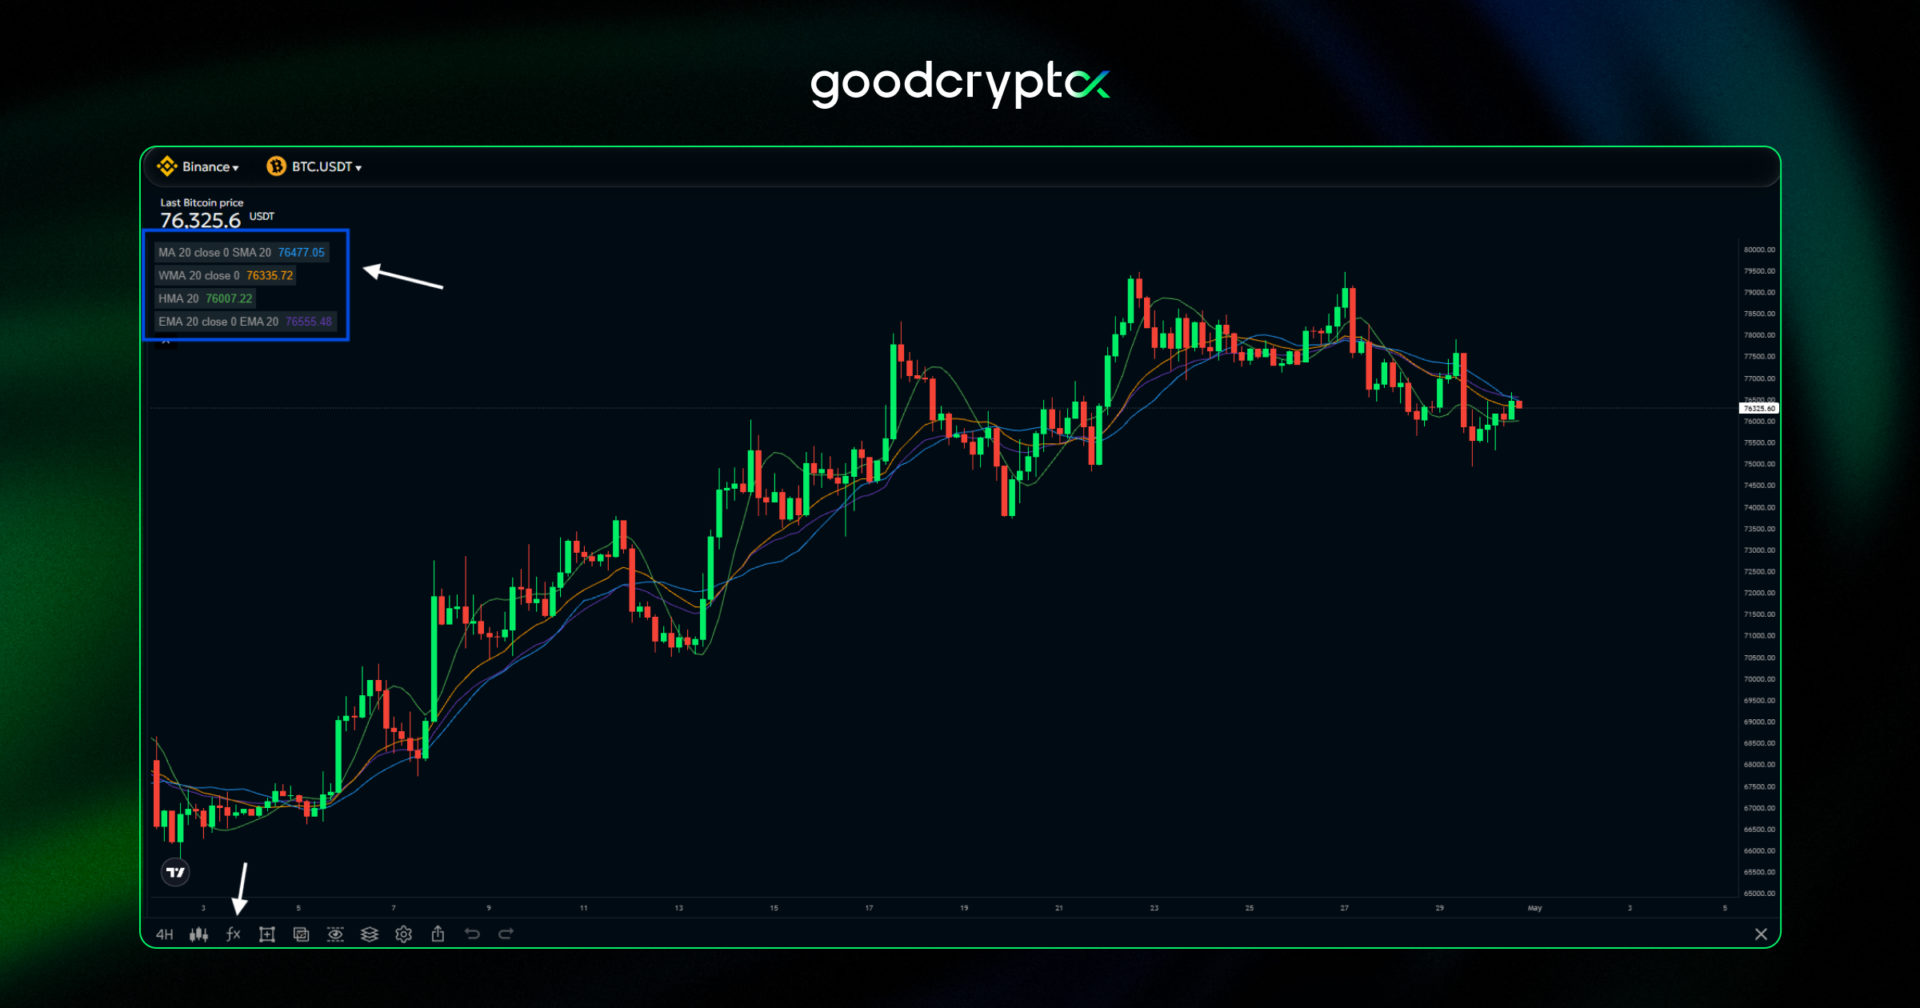
Step 1. Open the chart in goodcryptoX and tap the fx symbol in the menu to access indicators
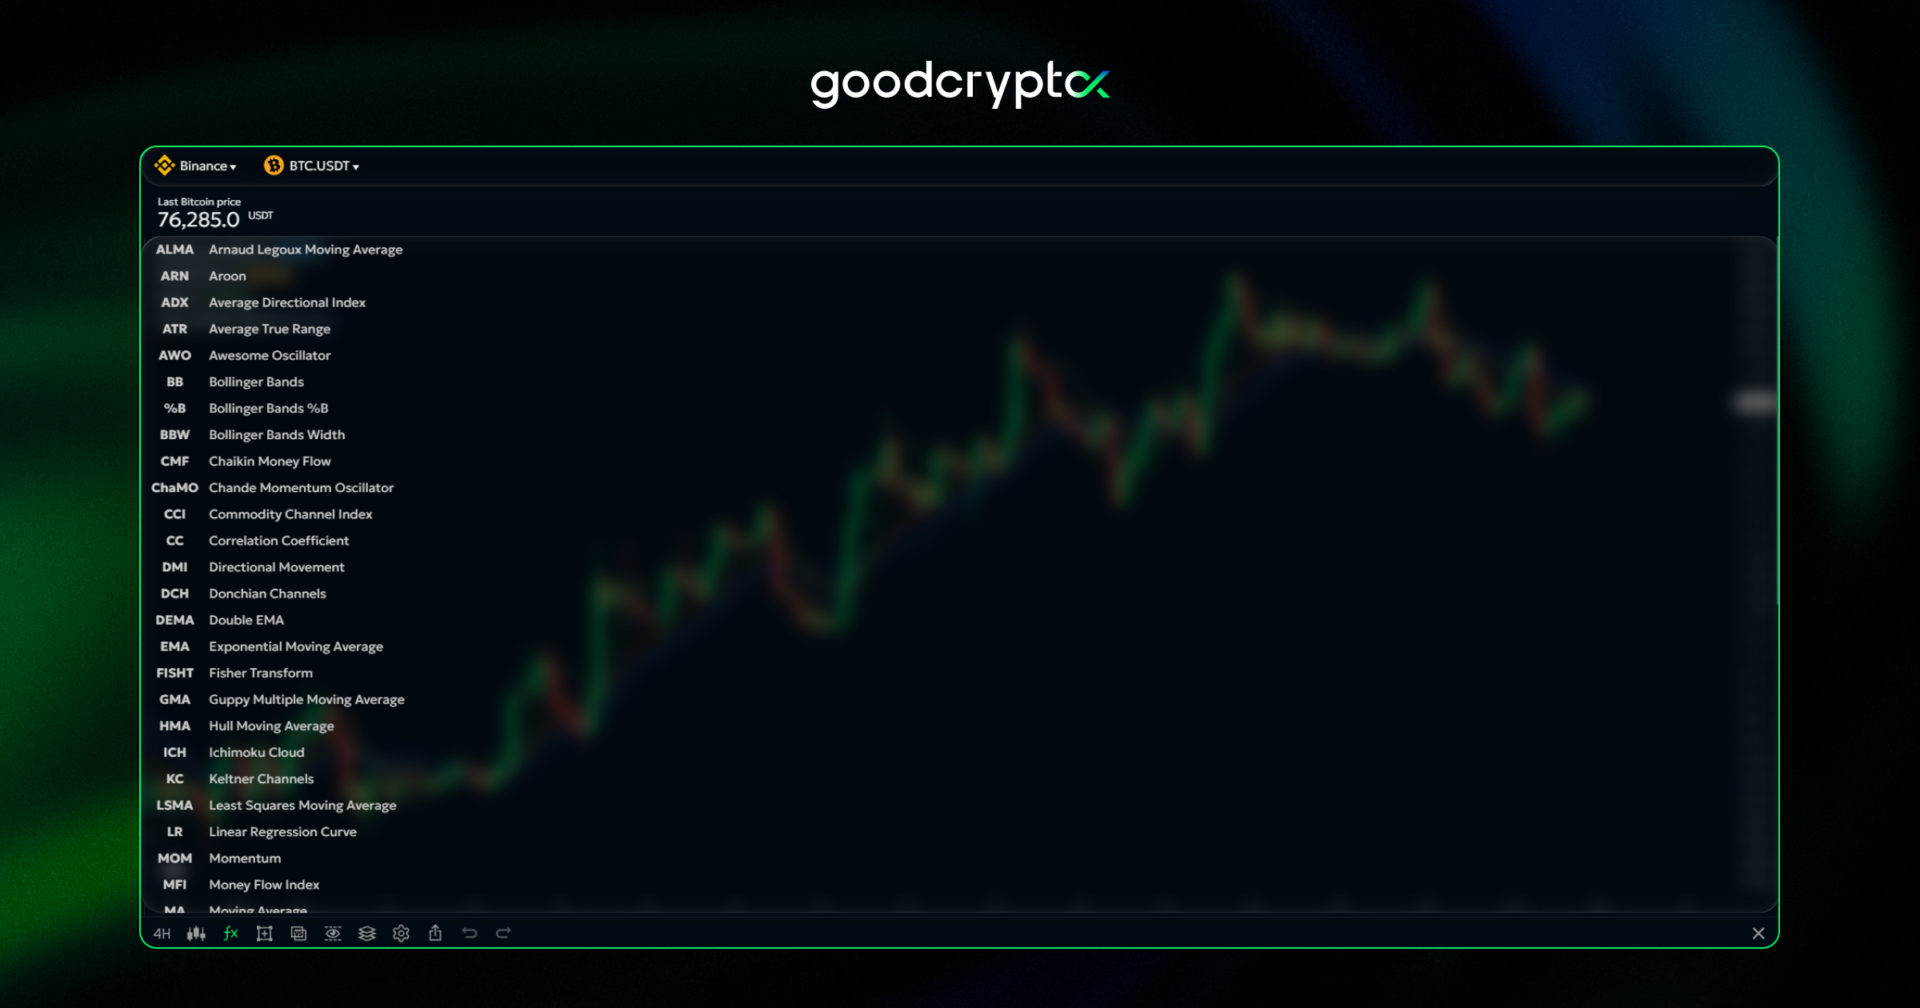
Step 2. Select the indicator you want to add.
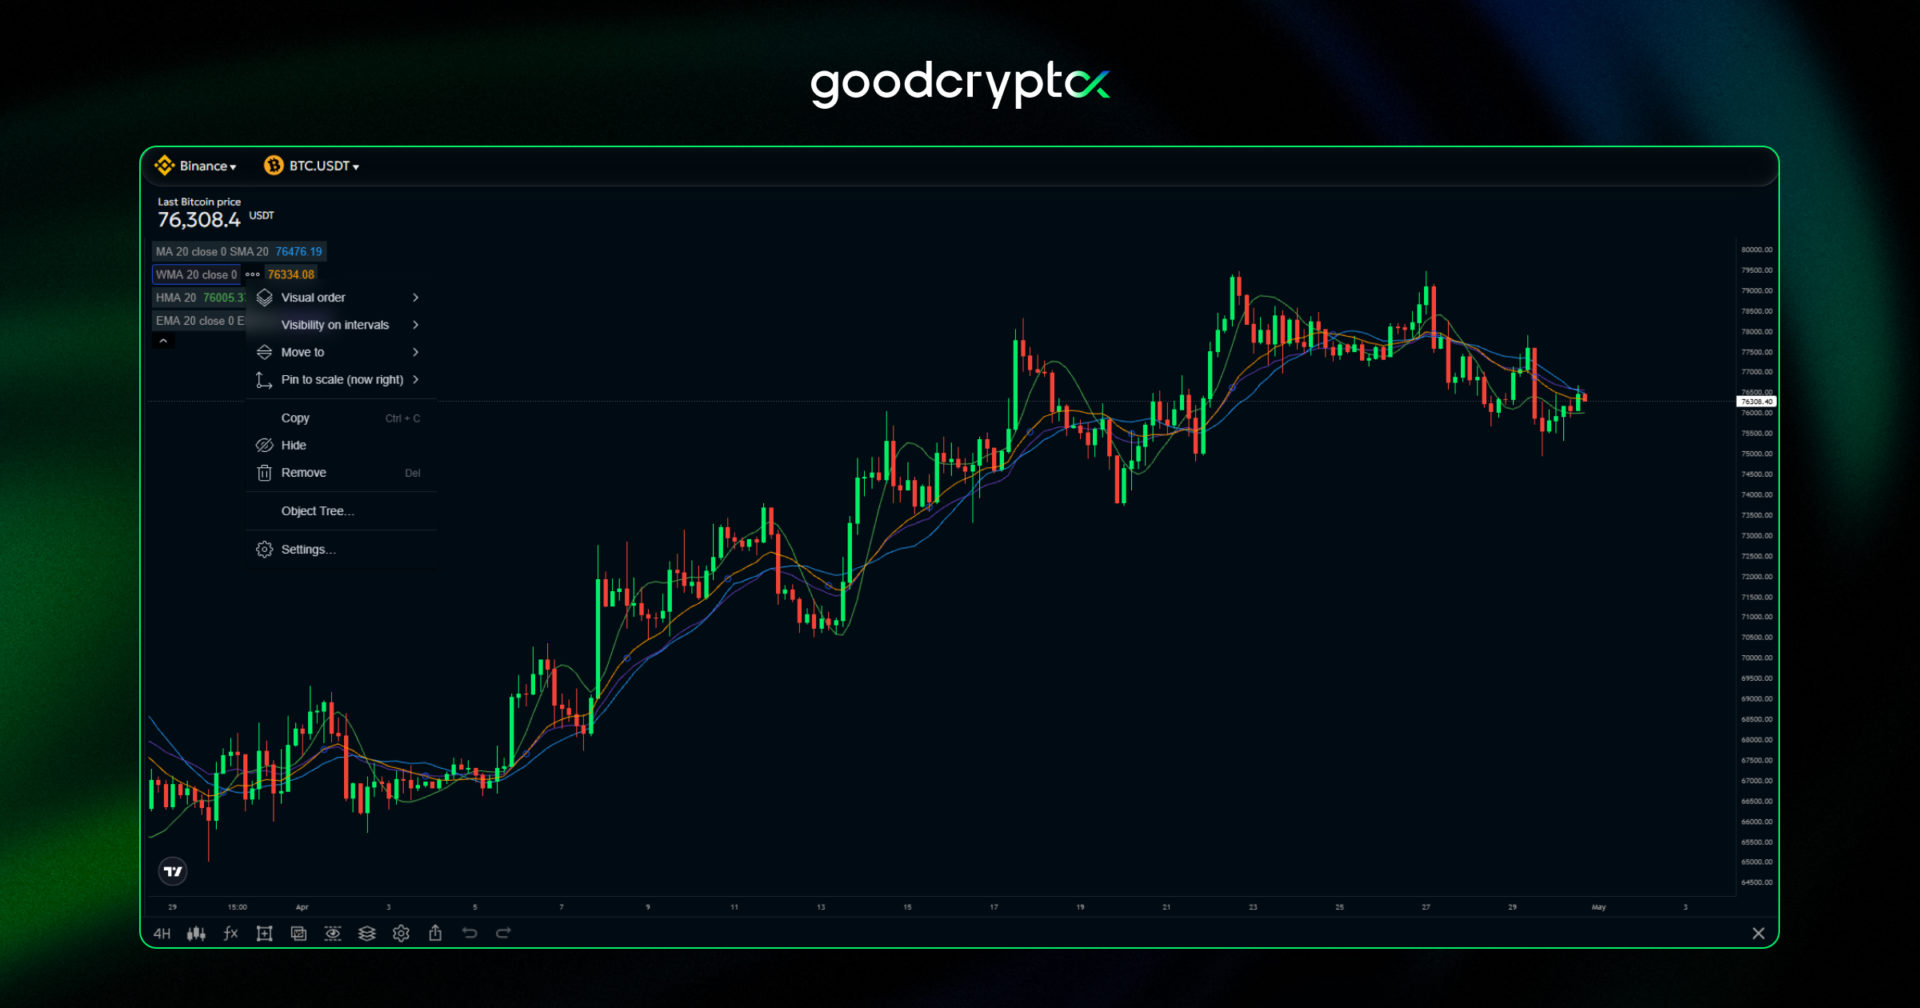
Step 3. To edit its settings, tap the three dots or double-tap the indicator itself.
Step 1. Add multiple Moving Averages with different colors

Step 2. Configure their settings as needed
Step 3. Combining several Moving Averages will give powerful results.
how to trade based on Moving Averages? MA, SMA, EMA, WMA crypto trading strategies
crypto Moving Average trading strategy #1: trend
The MA gives an immediate idea of the trend. By analyzing the direction of the Moving Average indicator we can easily see if the price is making new highs. The tip of the indicator, the outer end, also will show the possible future direction. Trend traders generally accumulate when the price hits significant moving averages. Significant means the ones with the most data, for example, 100 MA or 200 MA, which are rarely touched.
crypto Moving Average trading strategy #2: combining MA’s
Many traders enjoy seeing multiple MA’s on the same chart. This gives the benefit of seeing the long-term trend and the short-term trend at the same time. Anything is possible, from 2 MA’s to a triple MA or even a whole band, or Moving Average Ribbon. As long as you are understand the information, you can read its signals and decide how to trade the market.
One of the most meaningful signals you can trade is a triple moving average Crossover.
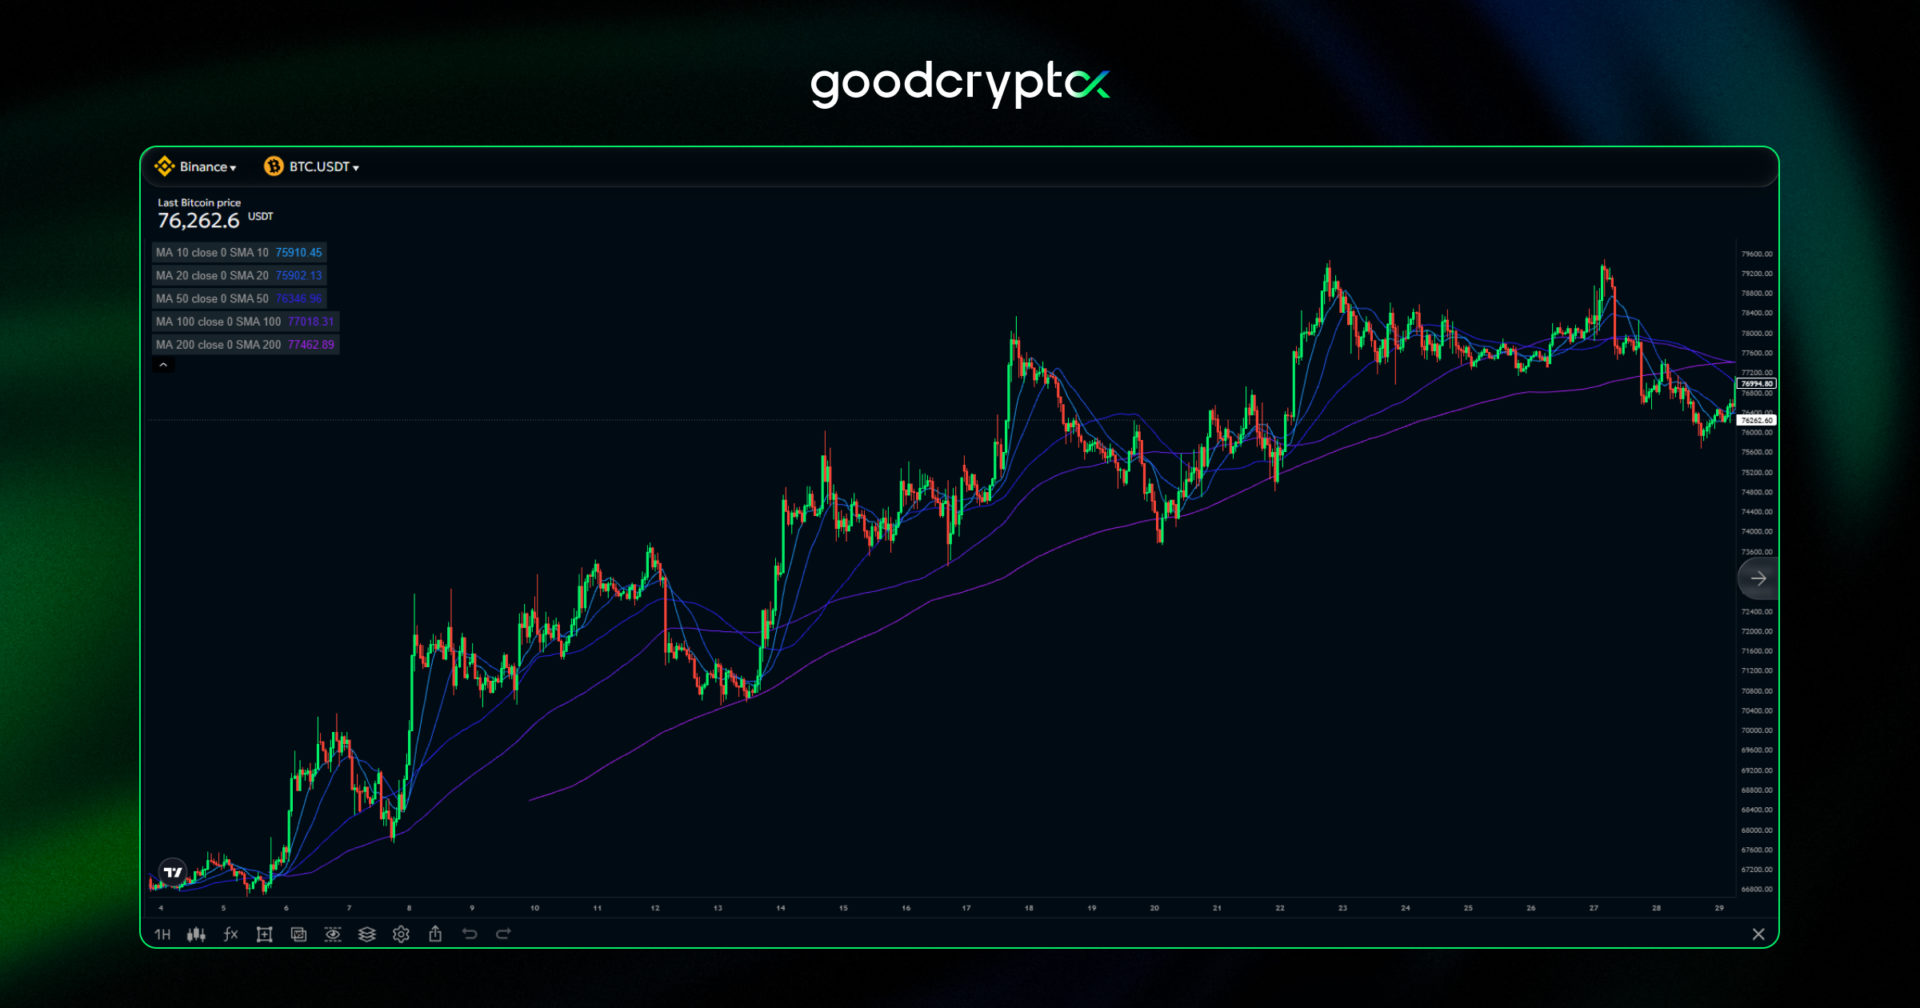
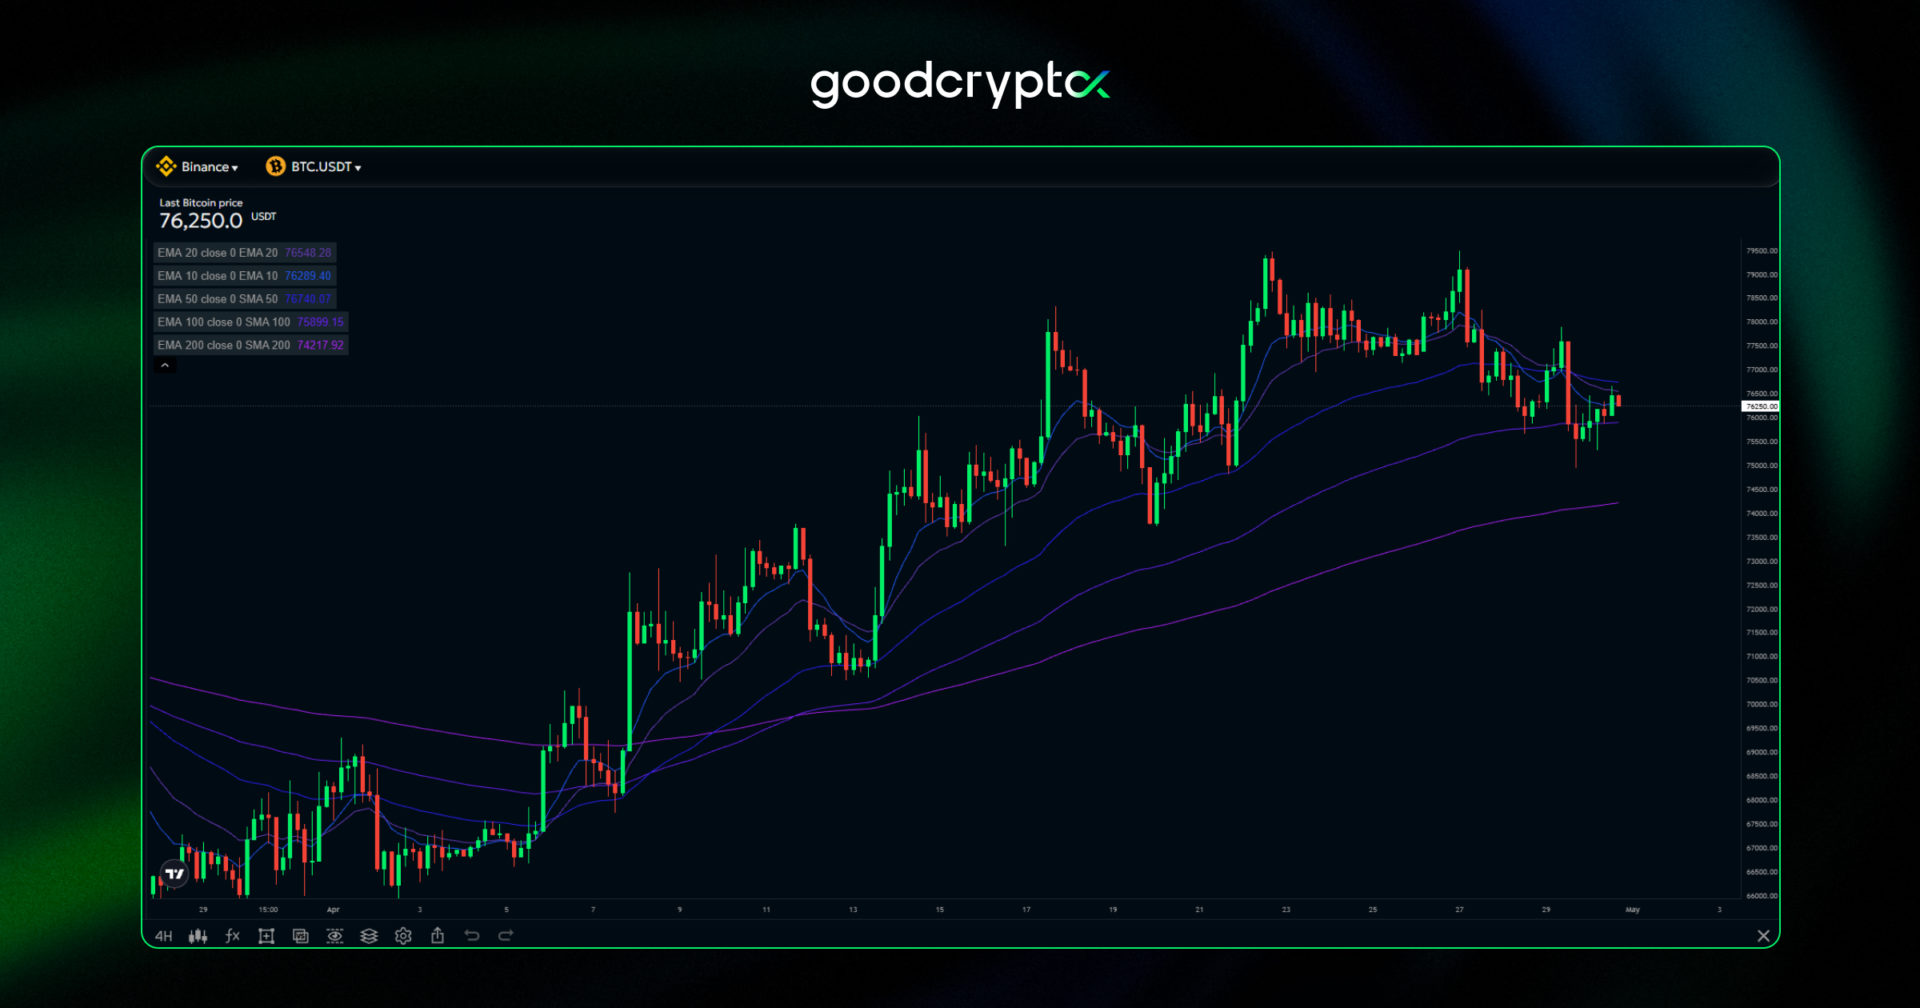
This 1H BTC/USD chart combines the 10 MA, 20 MA, 50 MA, 100 MA, and 200 MA.
crypto Moving Average trading strategy #3: crossovers
Crossovers are when one MA crosses the other. A lower period MA crossing a higher period MA is considered positive. And the opposite, a higher period MA crossing a lower period MA, is regarded as negative. The most significant cross that traders look at is those of the 50 MA, 100 MA, and 200 MA. Usually, traders build their 3 moving average crossover strategy on this combination of MAs.
- A positive crossover of the previously mentioned MA’s is called a Golden Cross.
- A negative crossover of the previously mentioned MA’s is called a Death Cross.
Usually, a cross happens when either selling or buying is exhausted, and the market turns around. It’s a great indication to see a potential reversal in trend.
Crossovers are important when the market has a strong trend. For example, the market has been in an uptrend for weeks or months, and then suddenly a death cross appears, which could mean the uptrend is finished and the market will turn into the other direction.
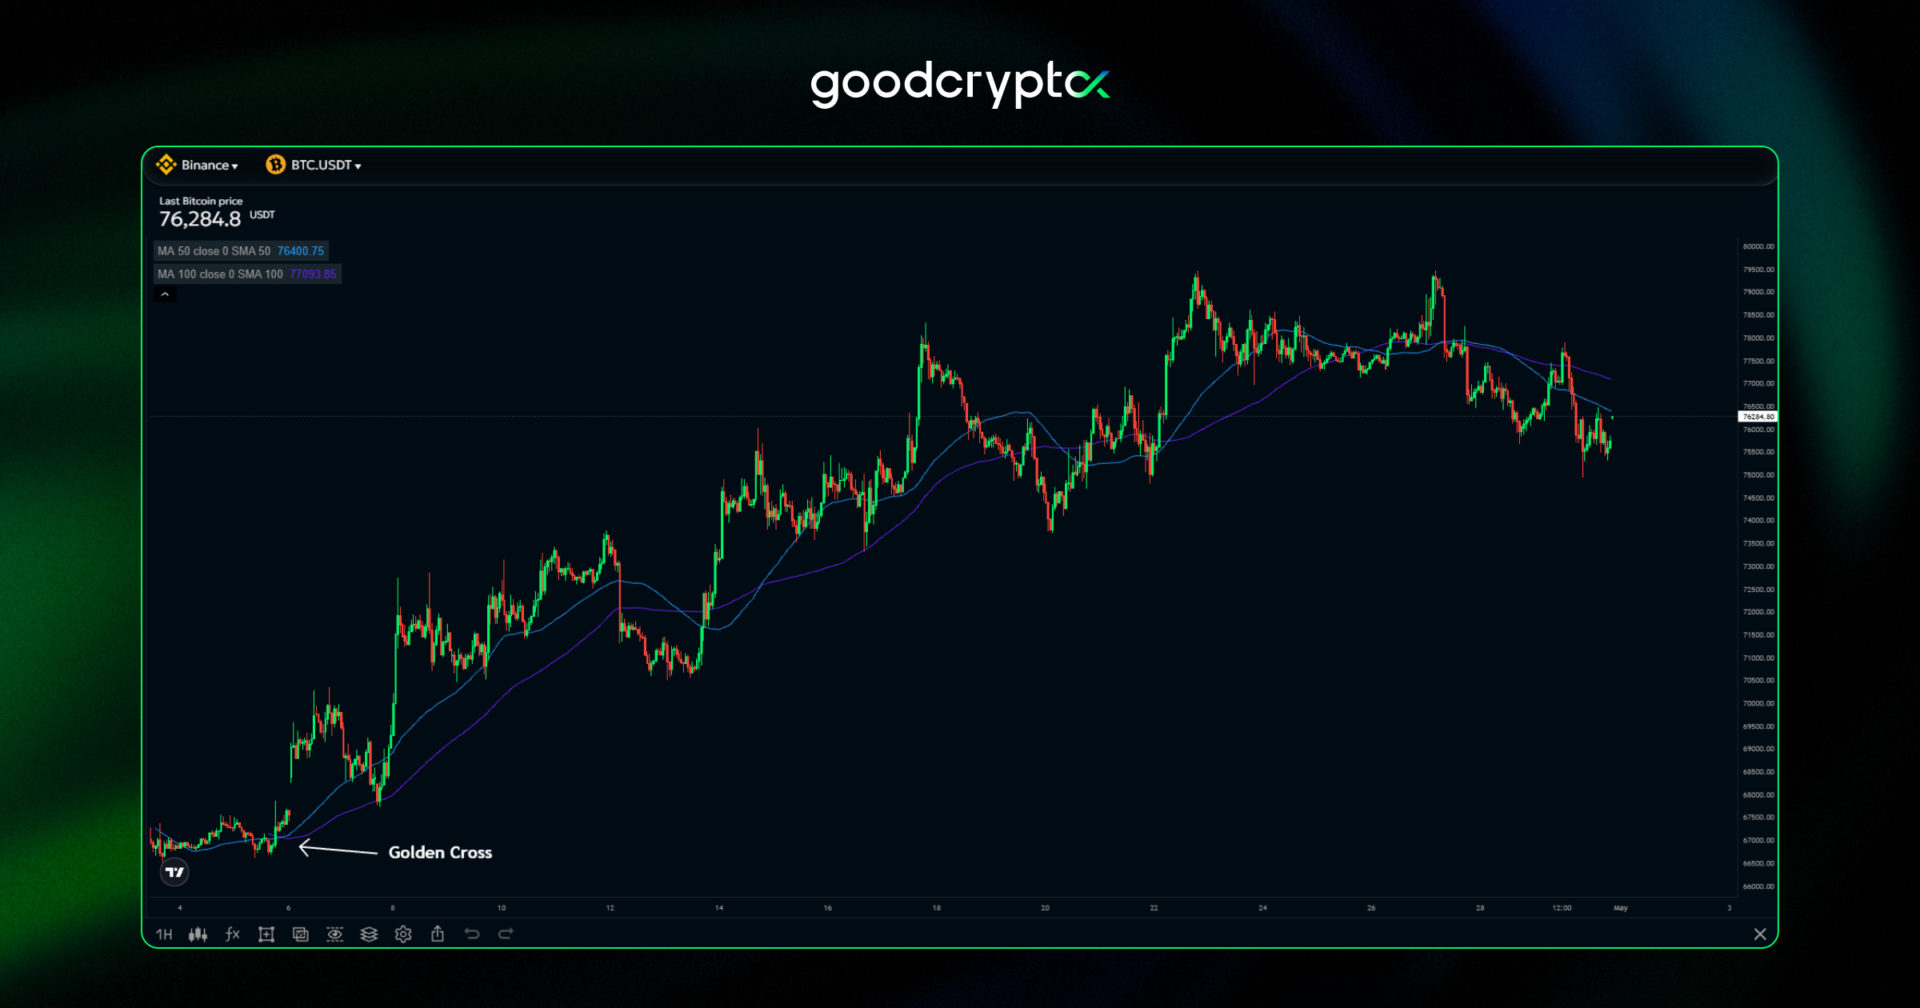
An example of the Golden cross in the 1H BTC/USD chart, based on the 50 MA and 100 MA.
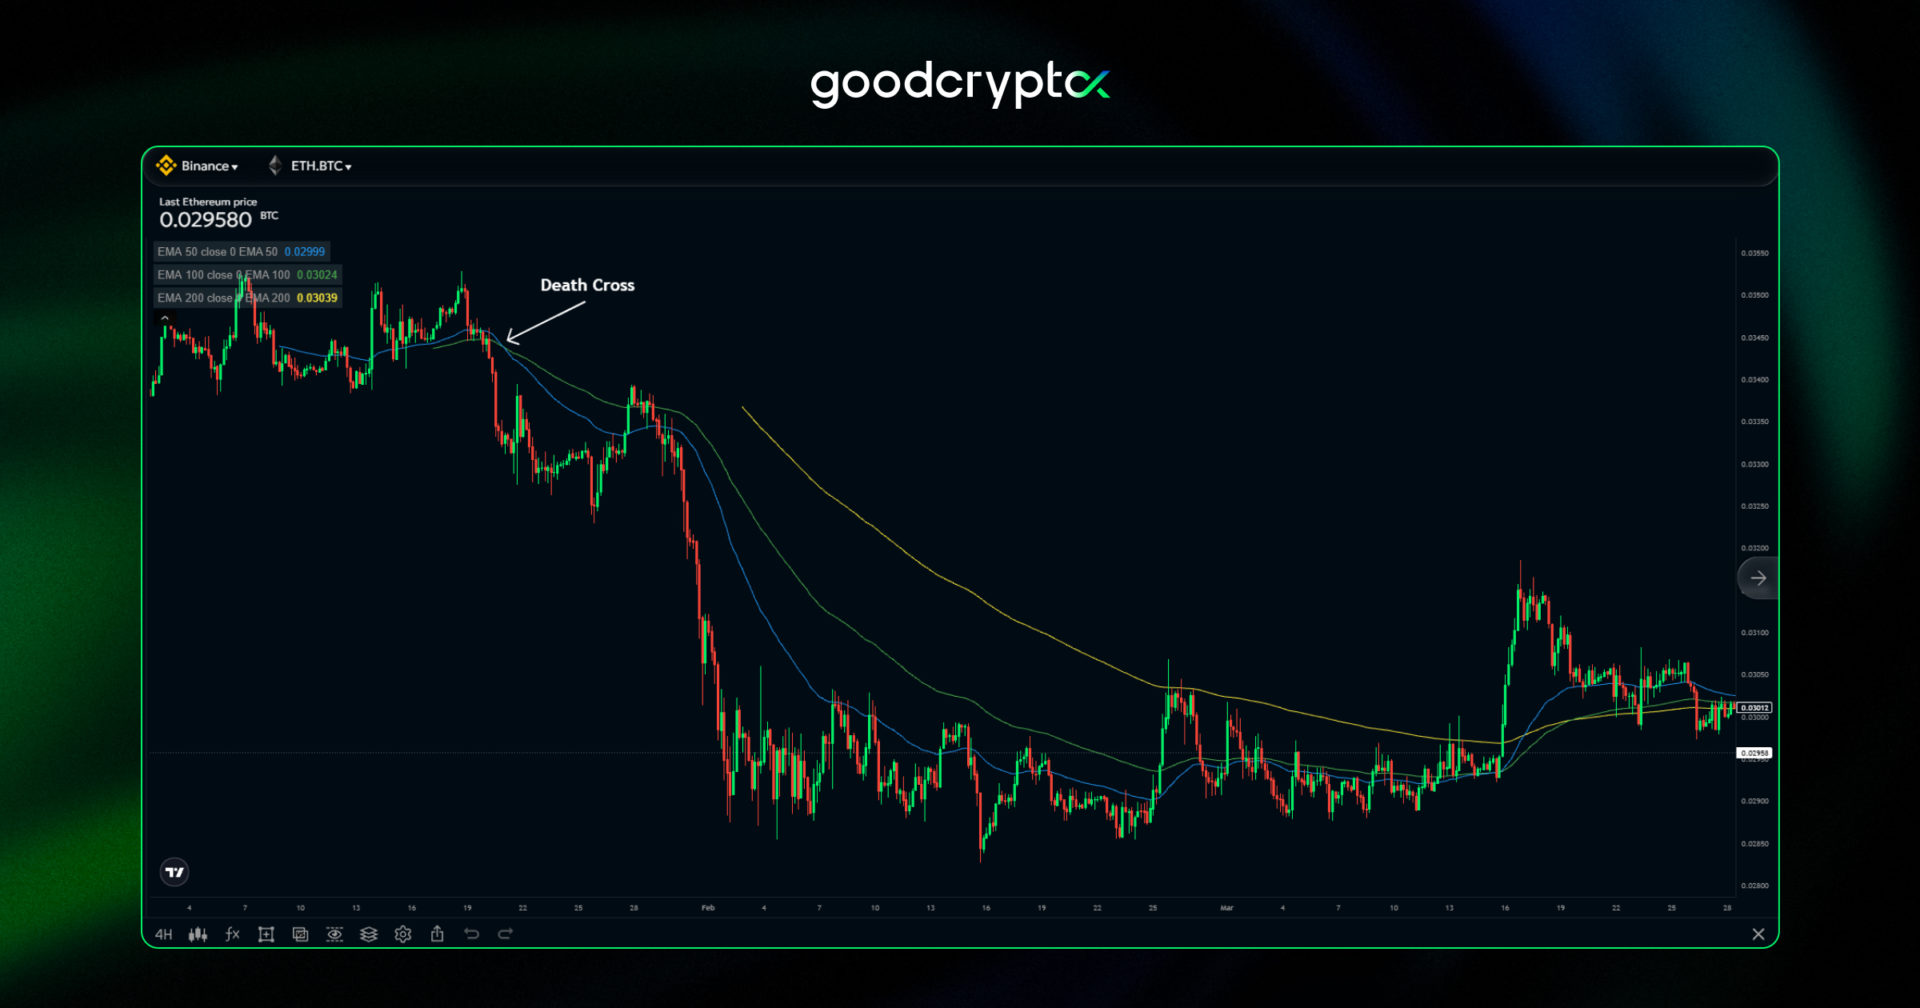
An example of the Death Cross in the 4H ETH/BTC chart, based on the 50 EMA, 100 EMA, and 200 EMA. A Golden cross or a Death cross can either be the 50 EMA crossing the 100 EMA or the 200 EMA. The higher the EMA period crossing, the stronger the signal. In this example, we see 50 EMA crossing down the 100 EMA.
crypto Moving Average trading strategy #4: support and resistance
An MA can give you a clear indication of support and resistance in the market.
- A support level is a place where buyers are willing to buy or buy more.
- A resistance level is a price where there is a lot of selling.
Using Moving Averages as an indication of where to place your Stop Loss is fairly easy, and it is also a great indication of where you could potentially place a Buy order.
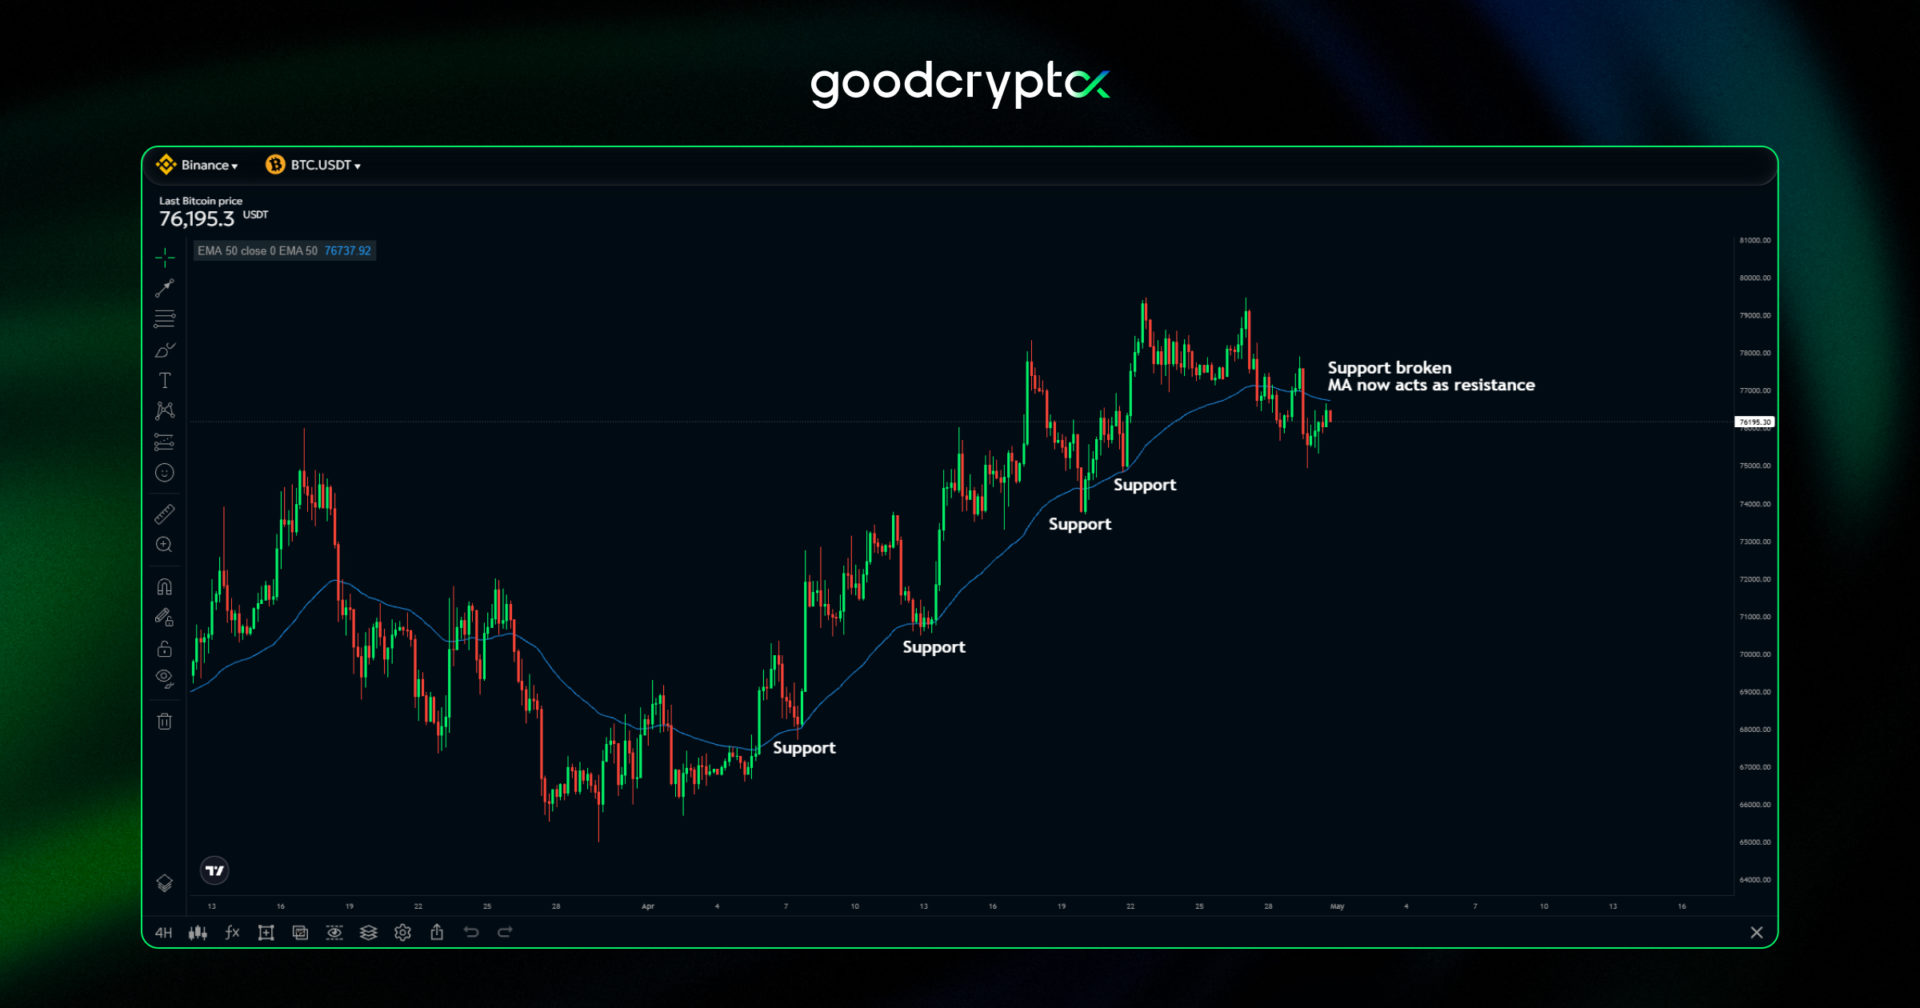
Moving averages are often used to indicate support and resistance levels
crypto Moving Average trading strategy #5: whipsaws
More data is stronger.
As explained above, higher timeframes and higher period MA’s are more important. Beware of the chaos and many signals you will find in charts with a lower timeframe. Using the MA’s takes practice and observation. Not every Crossover is a signal to buy or sell, and neither when the price touches the Moving Average indicator. A Whipsaw pattern is when the price is in a range, it makes no significant long-term trend either upwards or downwards and this creates a hesitant and continuous crossing of the lower period MA’s. This results in a fake indication of the support and resistance or fake crossovers.
Once again, lower timeframes and lower period MA’s give a lot more signals, and they will also be less significant.
An example of the Whipsaw effect. The price movement of a low timeframe and a 10 MA are flirting with each other, giving many false signals. To avoid whipsaws, change the settings of the MA to a higher number.
the benefits of goodcryptoX app for traders

goodcryptoX allows you to trade by indicators on 30+ crypto exchanges with ease. The application charges no fees for trading and takes away your stress for several reasons.
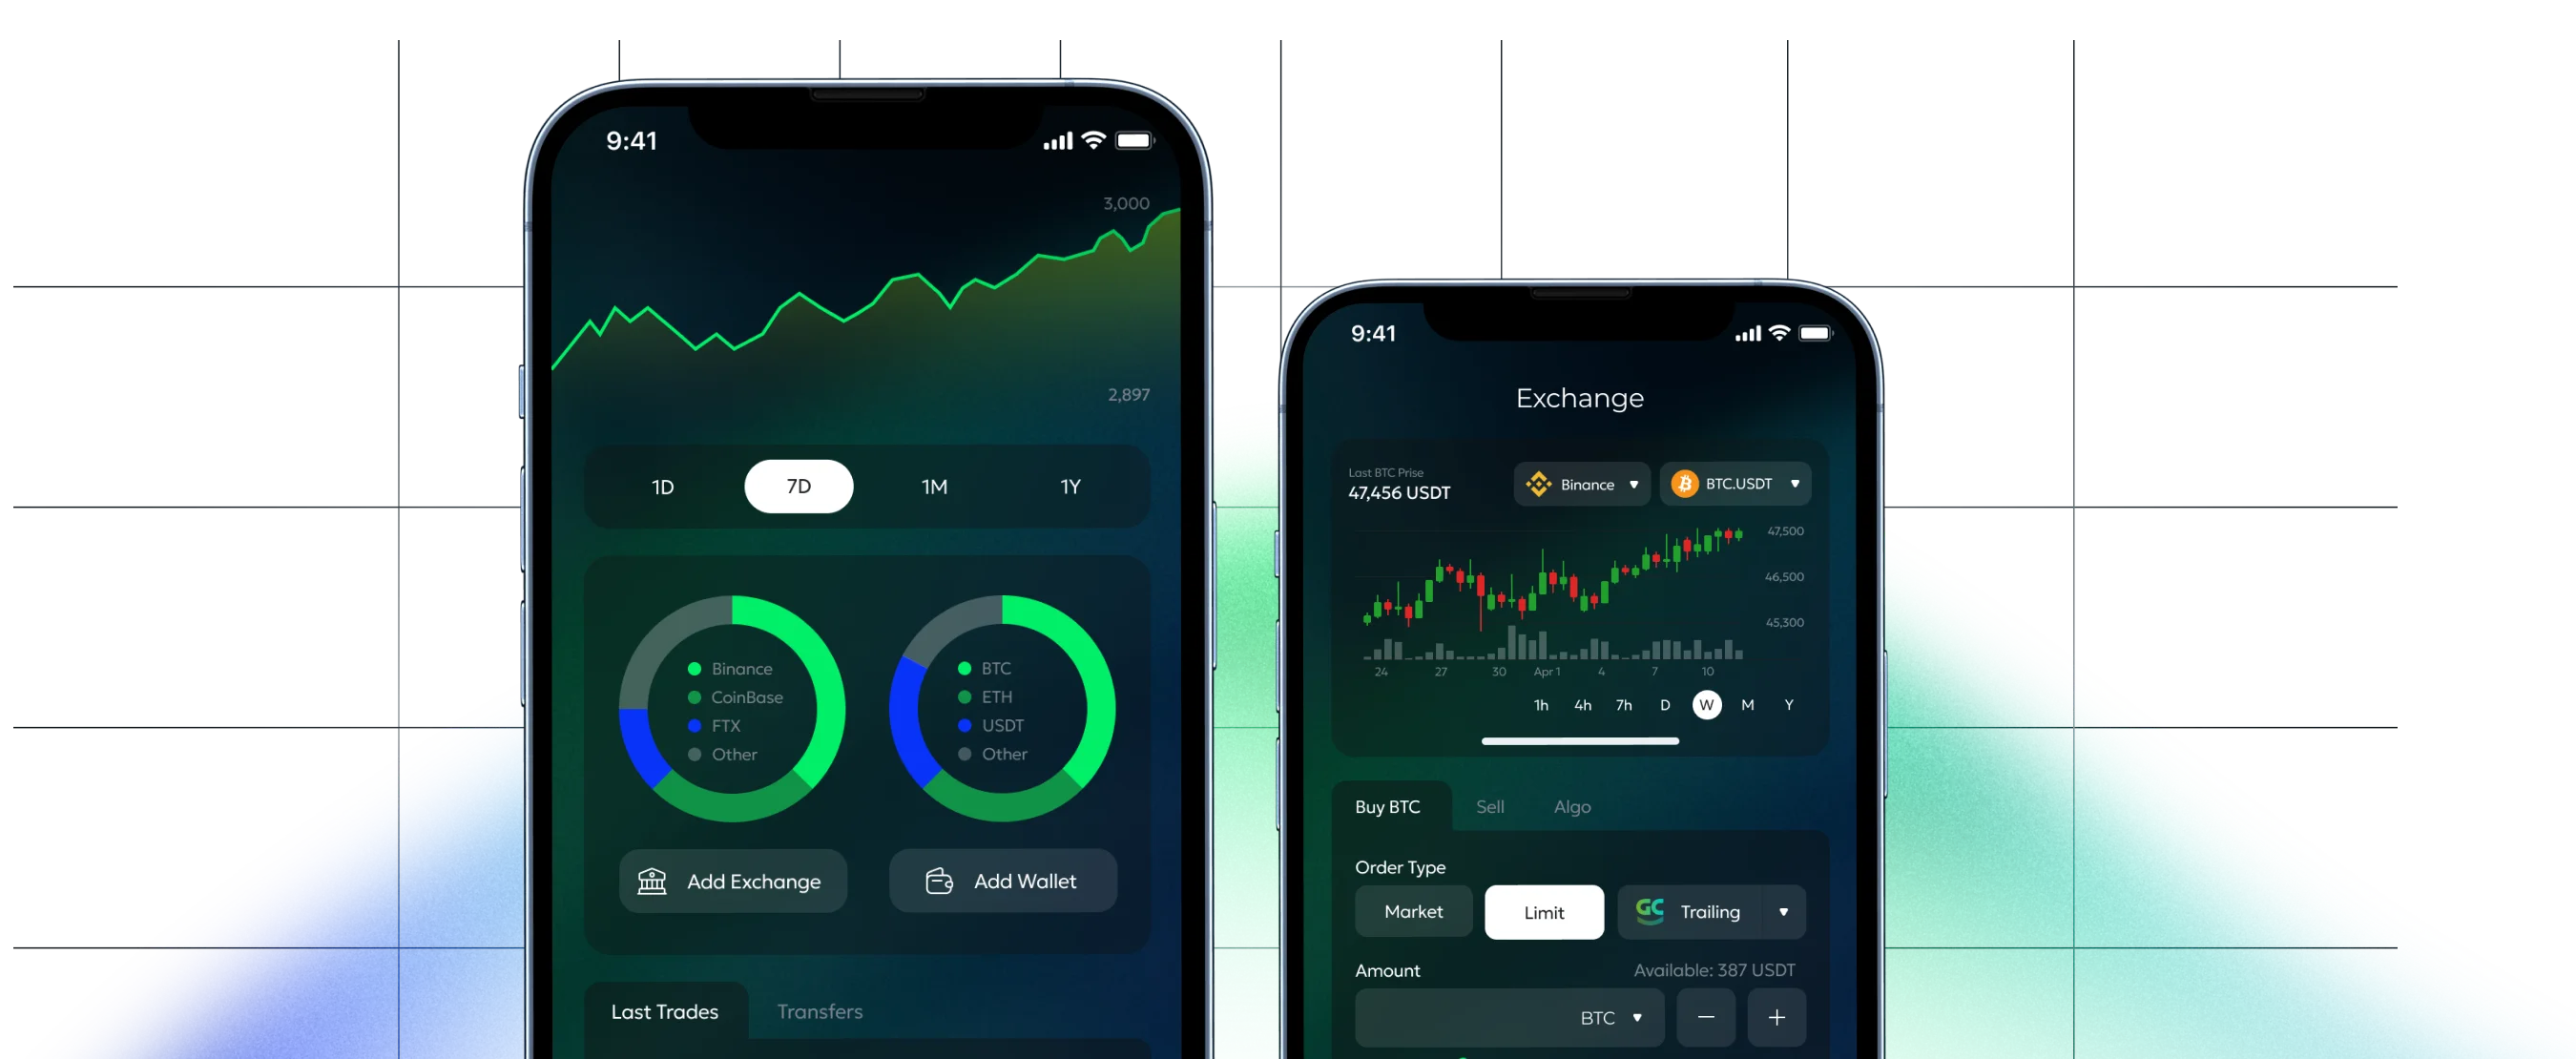
– Track all your exchange accounts and trades in one place, you can even include your blockchain wallets and track every transaction. The portfolio overview of goodcryptoX automatically creates a visual representation of your performance.
– Automate your trading. The goodcryptoX app provides users with the most wanted trading bot strategies, such as DCA, Grid, and Infinity Trailing bots. They will streamline your trading routine and help you take advantage of every trading opportunity around the clock without needing to monitor the market all the time.
– Create a trade with every order included, a Stop Loss, Take Profit, and you can even connect a Trailing Stop order. Placing trades does not freeze the funds in your account, so you can create different scenarios and see which one plays out.
– Programmable orders. A unique feature that allows you to program orders. For example, you place a buy order at $70,000 for Bitcoin. You can create the conditions that IF the order hits and fills, automatically a Stop Loss is placed at $68,000 and a Take Profit at $80,000. Clever!
– Notifications. Receive a daily overview of the market, or program alerts when a market reaches a price level. This way, you don’t need to scan the market for opportunities, you can simply place an alert and then potentially create a trade. You can even enable notifications for new listings on exchanges, and catch the most hyped projects.
– goodcryptoX Signals. This tool uses market data and analyzes each coin based on 15 Moving Averages and 10 Oscillators. The main goal of the tool is to predict further crypto price trends or direction and help traders decide where to go in and out of trades.
– Discover over 20,000 markets, where to trade them, which pairs exist, and follow their performance. Connect your exchange account and instantly trade them!
– goodcryptoX is constantly adapting and growing, the developments are based on the feedback of users, and the team aims to create the best cryptocurrency trading application on the market.
trade Moving Averages in goodcryptoX
Trading Moving Averages is incredibly valuable. Understanding how to read Moving Average signals can lead to incredible results.
However, beware of Whipsaws and make sure you are properly protected by your risk management when placing trades. Also, remember that a Moving Average has a lag, because it’s calculated on historical data, and the future can always be different.
Moving Averages are great additions to a chart, and trading becomes stronger when you combine the indicator with others. Accumulating your signals is more powerful.
After this guide, you should be able to make your Moving Averages technical analysis! You can use Moving Averages for free in goodcryptoX. However, to widen your knowledge about MAs, read our article about Advanced moving averages, such as SMMA, KAMA, LWMA, DEMA, and TEMA. Our guide will help you understand how they work and how to use these less common MA types in your trading process.
Find goodcryptoX on both the iOS App Store and the Google Play Store and discover the most advanced cryptocurrency application on the market!
Do you have questions?
Connect with the public chat room in Telegram and ask anything, 24/7.