
The ancient Greeks showed the first signs of trying to predict future market behavior. Thales of Miletus (640–546 BC), the philosopher, astronomer, and geometer, used his knowledge and observations to predict an abundant crop of olives. He decided to place deposits on the olive presses ahead of time, so when the harvest season started, he rented them out at a premium that brought him great returns.
The story of Thales and the olive presses is considered the first option-type agreement in world history, giving rise to the practice of understanding the market to profit from it.
After decades of studies and technological advances revealing the “behind the scenes” nature of markets, the mechanics of fluctuating prices became clearer, allowing traders to make informed decisions and manage risks efficiently.
However, in a market system, there is always a degree of uncertainty that people strive to mitigate through technical and fundamental analysis.
One of the most recent and novel approaches to price analysis is forecasting price changes by monitoring trading activity. The Volume Profile is an ultimate indicator that defines an asset on three levels: price, volume, and time, providing us with all the data we need to trade assets effectively.
Today, we want to delve more into volume profiles, discover what they are, and how they can provide valuable insights into market behavior that other technical indicators may not capture.
Excited? Let’s get this party started, then!
what is a Volume Profile indicator?
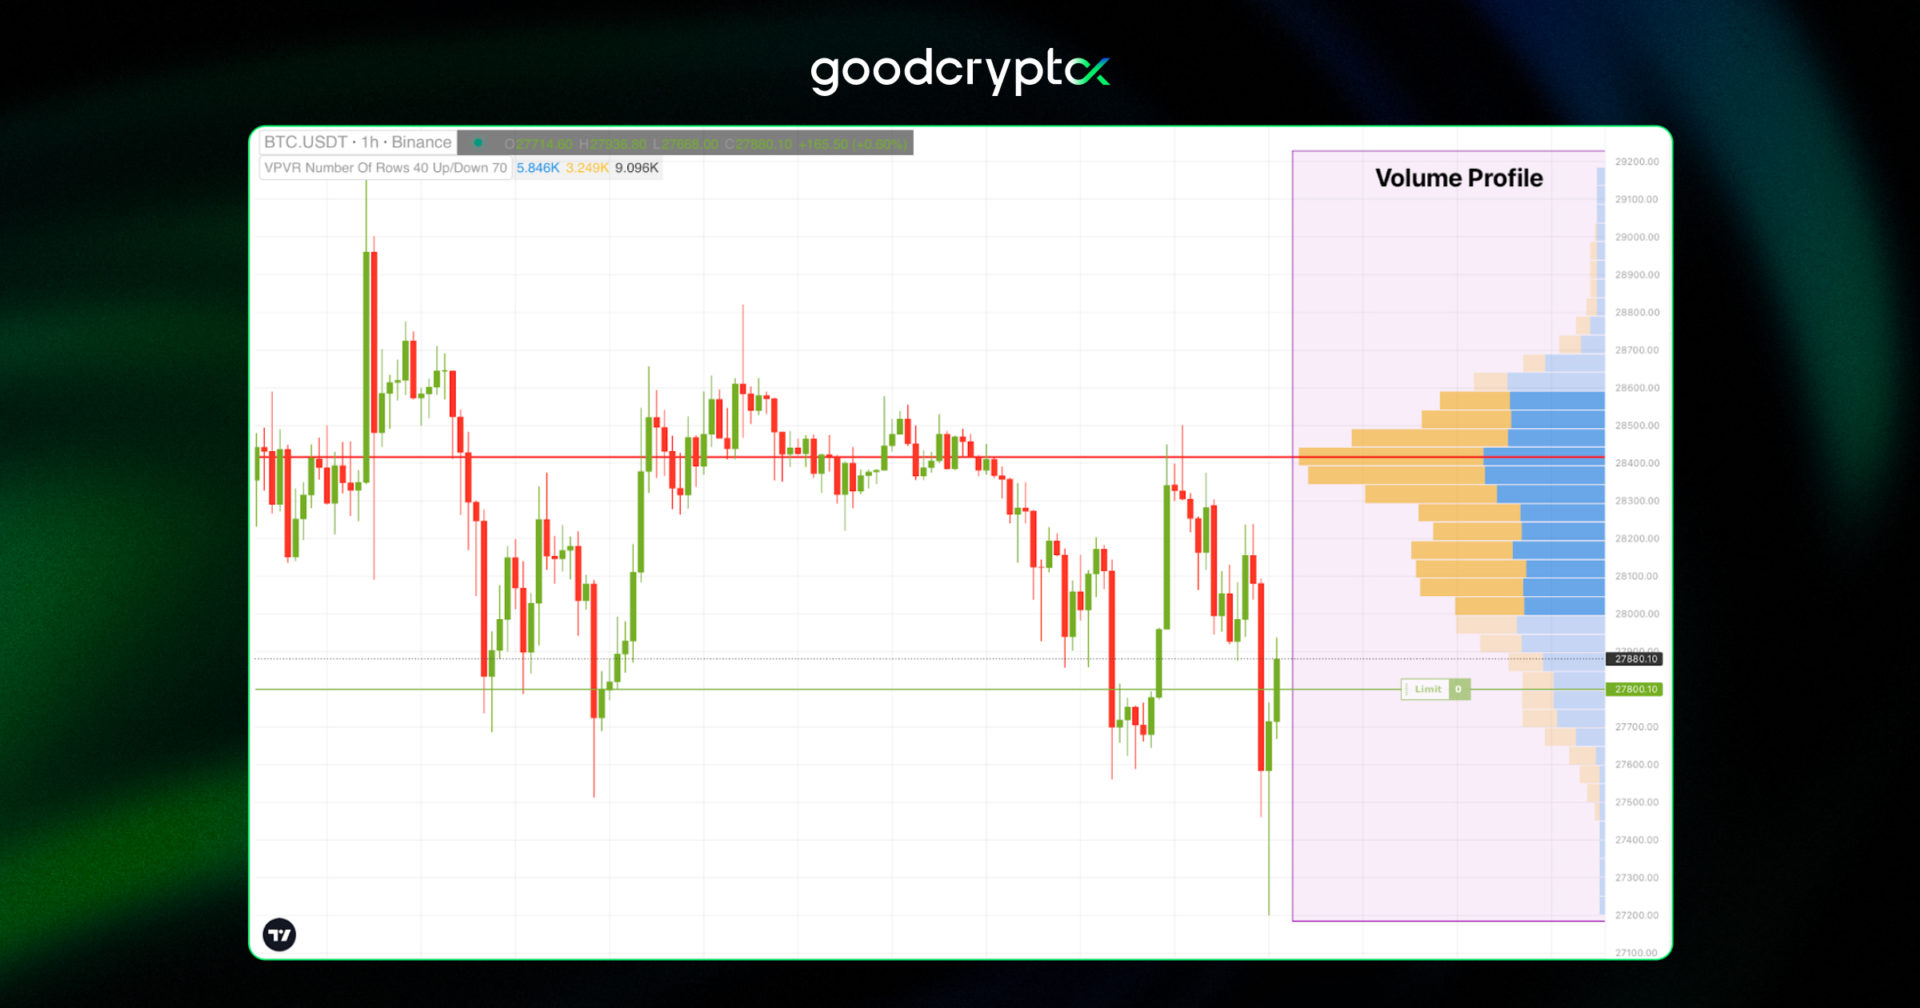
The Volume Profile is a charting technique (indicator) that shows the trading activity of a specific financial asset over time. This indicator uses horizontal bars to reflect trading activity at different price points. The bars are stacked vertically, with the highest indicating the areas with the most trade activity.
The Volume Profile is a relatively new charting technique created in the late 1980s by a trader called Peter Steidlmayer. He was a talented futures trader at the Chicago Board of Trade (CBOT) seeking a more efficient approach to examining market data.
Steidlmayer noticed that typical technical indicators, including oscillators, moving averages, and trendlines, did not accurately portray market trends and reversals. He believed the amount of trading activity at every price point was a more reliable measurement of market sentiment, so he began developing a statistical model to analyze this data.
The first thing that drew Steidlmayer’s attention was the fact that price swings were not random but instead preferred to cluster around particular price levels. He also noted that the trading activity was higher at certain levels than at previous levels.
Based on these discoveries, Steidlmayer developed a new method of assessing markets that considered both price and volume. He called this approach Market Profile, which later evolved into the Volume Profile indicator.
the components of a Volume Profile trading indicator
The anatomy of any volume indicator chart consists of several key elements, each of which plays a unique role in the market volume assessment. These elements include:
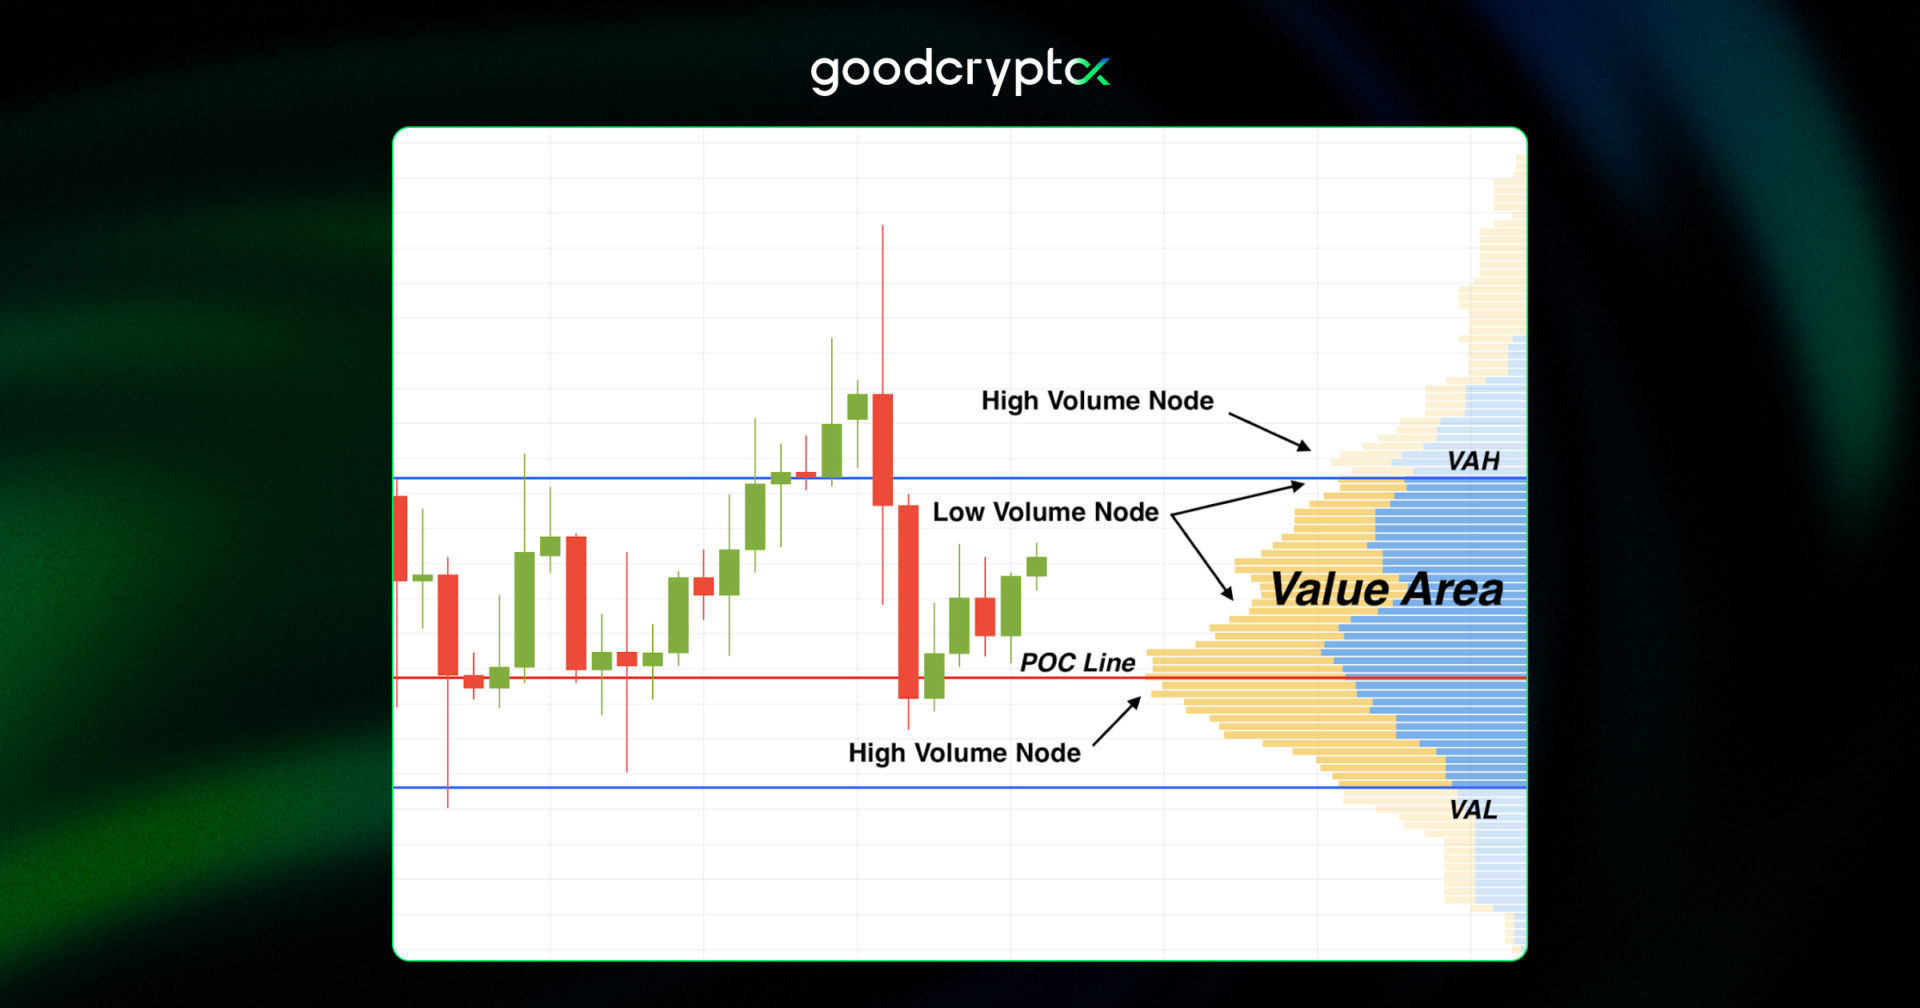
1) Value Area
The Volume Profile Value Area is a price range in which 70% of the total volume has been traded.
You may be wondering where this 70% comes from. To explain the mechanics behind the value area, we must first dig into the statistics.
In fact, the Value Area trading is a concept that comes from statistics and is centered around the Gauss model, widely known as the normal distribution.
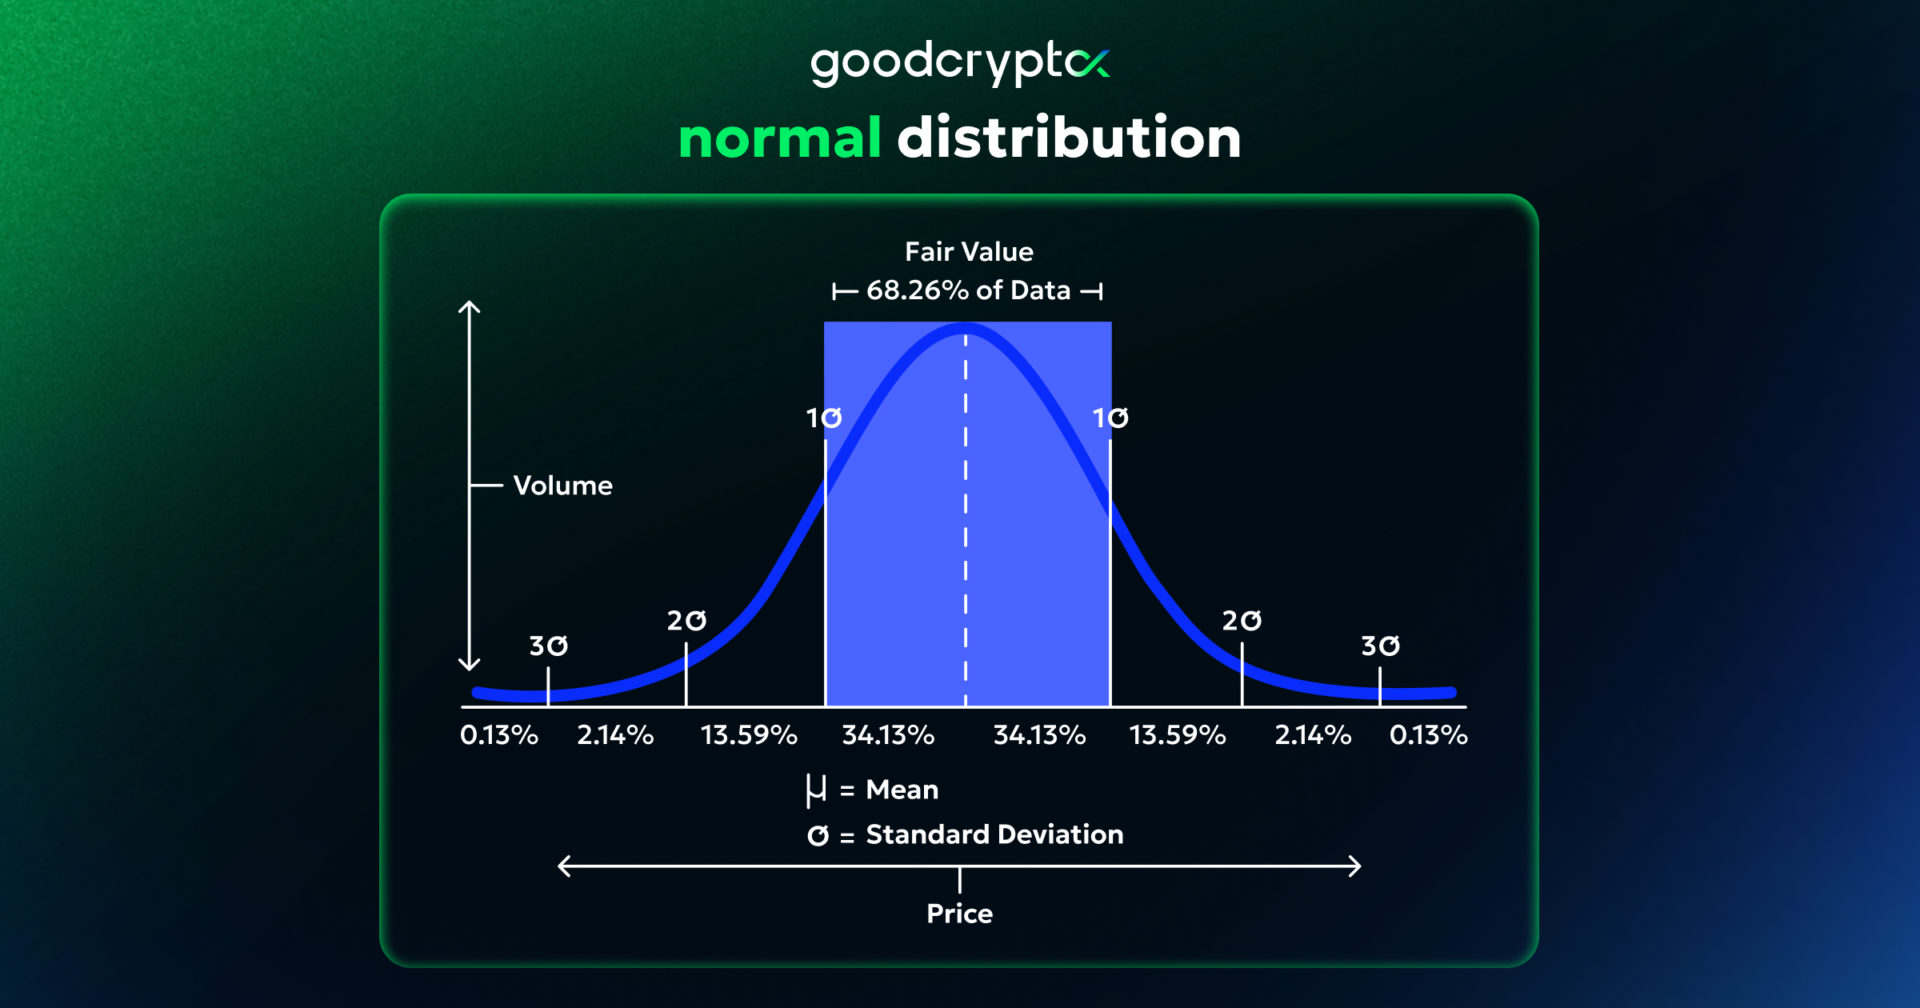
In the normal distribution model, the probability density function is defined by two parameters:
- the mean (μ), also known as average – which represents the center or peak of the distribution;
- the standard deviation (σ) represents the data’s spread or dispersion.
In a perfect normal distribution, the distance between -1σ and 1σ is where ~68.2% of the data is located. When applied to the trading volume, it goes as follows: the probability of every new order’s trading volume falling into the range of the value area equals 68%.
The normal distribution is called “normal” because it is regularly seen in nature, such as people’s height or weight, racing speed, intelligence level, etc.
It is essential to note that the value area is not a fixed range of prices but rather a dynamic concept that changes as trading activity evolves. As new price levels become more heavily traded, the value area may shift to include these new levels, while other price levels may become less significant and fall outside the value area.
2) PoC Trading Level
Point of Control, aka PoC, is a horizontal line that showcases an asset’s price point where the most trading activity occurred over the session.
The PoC line marks the price at which buyers and sellers have agreed the most. It is also called the “fair price” since the market perceives it as the most reasonable.
The Point of Control line gives traders visual clues about the overall market trend and possible reversals.
3) Value Area High (VAH)
The VAH represents the upper edge of the value area. This point is often seen as a support/resistance level by traders.
4) Volume Area Low (VАL)
The VAL refers to the lowest price level within the value area. This point can act as a support or resistance level on a trading chart.
5) High Volume Node
An HVN represents a price range with a heavy amount of trading activity compared to the average volume. This level is considered an area of significant price congestion and is often used as a critical support level when the price is below it or as a resistance level when the price is above it.
The price is attracted to these areas like a magnet since they present high liquidity, which traders appreciate. The market tends to stay within High Volume Node indicator areas since the more significant part of supply and demand is satisfied.
6) Low Volume Node
An LVN represents a price range with relatively low trading activity and a low volume of trades. This level is considered an area of little price congestion and is often used as a critical support level when the price is above it or as a resistance level when the price is below it.
Low-volume areas are usually considered reversal areas. Here the price is only accepted by a few traders, and the market tries to reject these areas. In practice, in areas with low trading activity, the price either bounces back to the value area or trades quickly to another area of value.
In these areas, the price only lasts for a short period.
Market Profile vs. Volume Profile
At first glance, Market Profile and Volume Profile are similar charting techniques designed to make technical analysis easier for traders. Many traders use these two terms interchangeably, but we don’t blame them – they sound similar and even look alike. So, what is the difference between Market Profile vs Volume Profile?
Let’s start with a bit of history.
The Market Profile (also known as TPO Profile) is an advanced technical analysis approach developed in 1980 by J. Peter Steidlmayer at the Chicago Board of Trade (CBOT) and released to the public in 1985.
At first, traders were skeptical of the Market Profile technique because it seemed complicated and difficult to incorporate into existing trading strategies. However, as time passed, more traders began using the indicator to understand how much time the market spent at each price level.
Over time, this concept evolved into the modern Volume Profile indicator, one of the most popular volume profile indicators used today. Instead of measuring time spent at a price level, the volume profile measures the amount of trading activity that occurred at each price level, helping traders perform deeper volume profile analysis.
Fun fact:
even though Market Profile does not use trading volume to build its histogram, the resulting structure is often very similar to a Volume Profile chart.
So, are they different or similar? In reality, both statements are true. The key distinction in the volume profile vs market profile comparison is that Market Profile focuses on time spent at price levels, while volume profile trading focuses on the actual volume traded at those levels.
Understanding this difference is essential before learning how to read volume profile charts, identify the point of control, define the value area, and apply effective volume profile trading strategies.
Now, let’s see exactly how the Market Profile is formed.
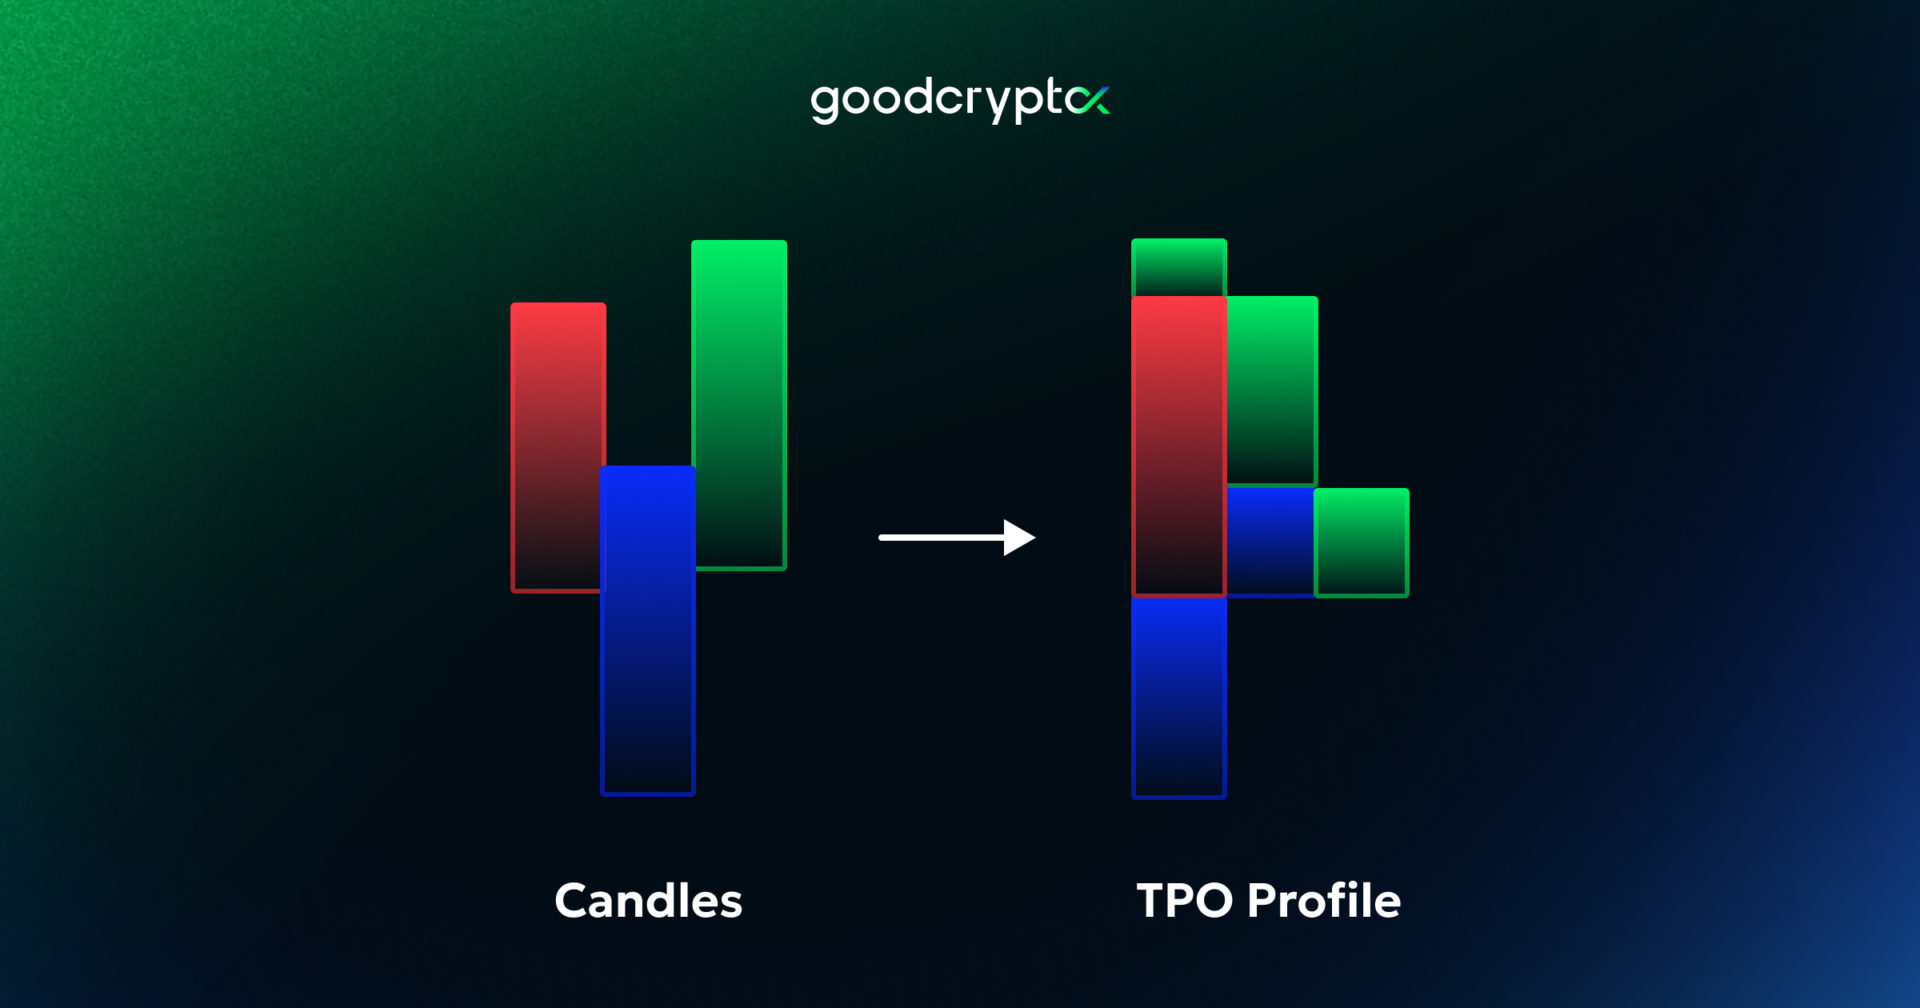
For a Market Profile, the form of the candle doesn’t really matter because it only considers high and low points. Essentially, the candles on each price level overlap and create a Market Profile, like the old-fashioned Tetris game!
The more candles there are in the price level the more thick the Market Profile will be.
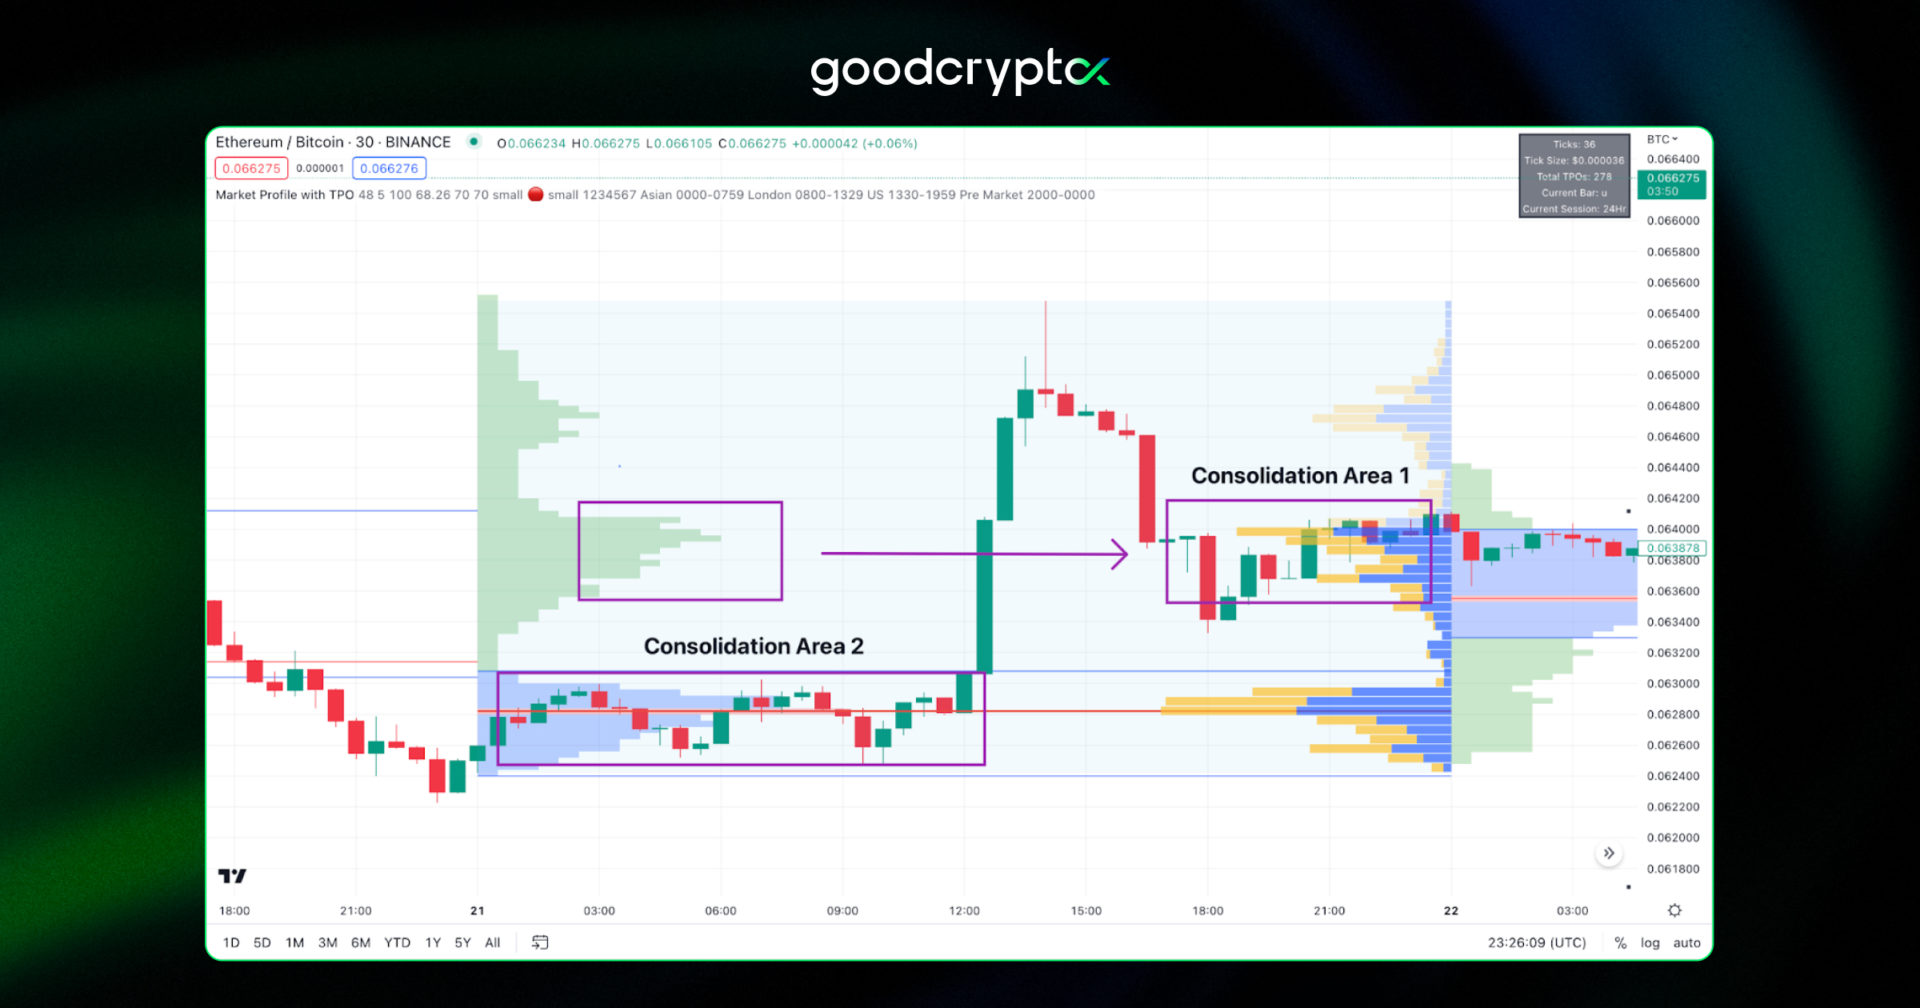
Both indicators have their own leverage when applied to different market states:
- Volume Profiles win over Market Profiles when there is a trend development. The candles don’t overlap in these areas, which gives us a little information. It is better to rely on VP indicators when the market experiences a trend.
*Market Profile is located on the left side of the chart, while the Volume Profile is located on the right side.
- Market Profile works best when there is consolidation in the market. Since there are many more candles to overlap in the same price levels, the MP chart looks more detailed.
3 types of Volume Profile Indicators
Three variations of the Volume Profile indicator differ in how the market data is presented. Let’s review each of them step-by-step.
VPVR Indicator
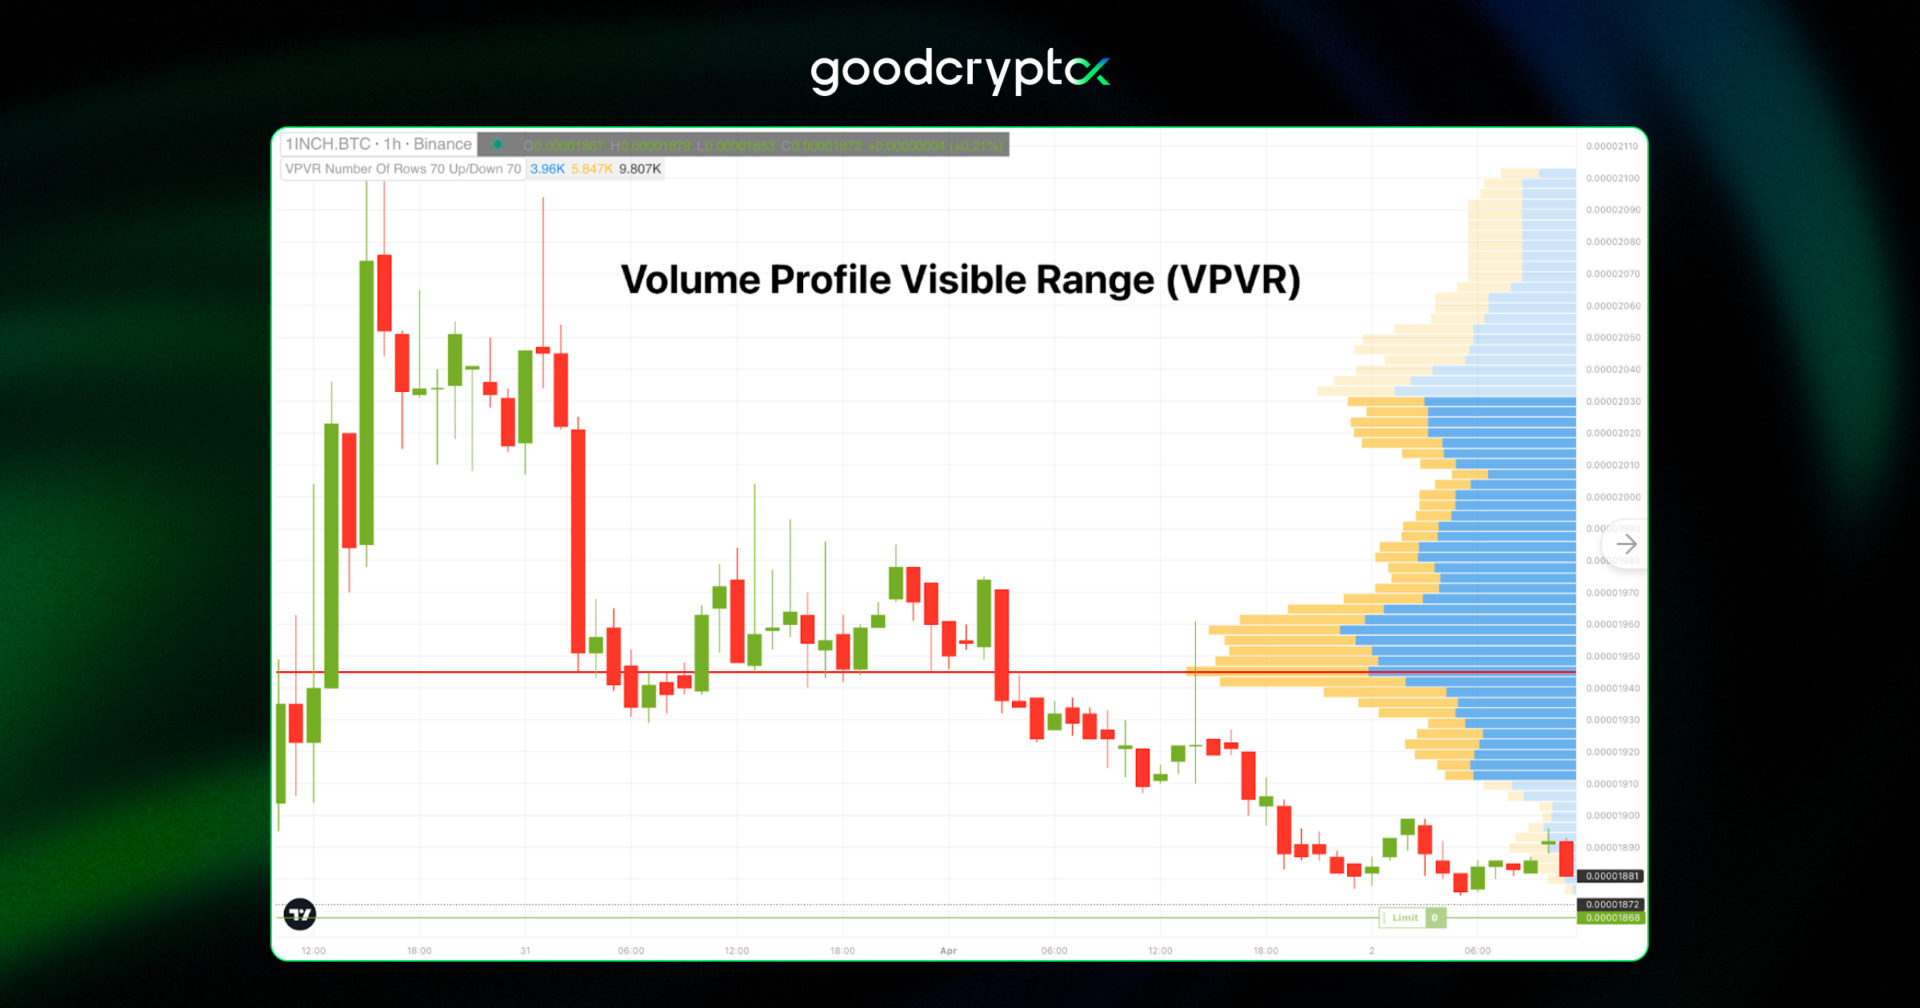
The VPVR indicator is a histogram that illustrates the volume traded at various price points over a specific time period. Each bar’s height indicates the trade volume, while its width shows the price range. The Volume Profile Visible Range indicator usually displays the most actively traded price ranges, which makes it useful for spotting support and resistance levels.
The VPVR indicator is considered the king of all Volume Profiles among traders. Too bad you can’t test it out for free on TradingView and other charting platforms – VP indicators are advanced and precious tools that are with the money, though. But we have a fantastic solution for anyone who wants to try it out free of charge!
goodcryptoX is the best charting platform, a TradingView alternative, to try and use VPVR for free. It is very user-friendly and super easy to utilize. We use it when writing articles about technical indicators to test various trading strategies and spot patterns. goodcryptoX is available in both desktop and mobile (Android & iOS) versions – you will need it after finishing this article!
Now let’s get back to the VPVR explanation.
It is vital to notice that the VPVR chart is dynamic, which means that the histogram’s values change as the user navigates through the visible parts of the chart.
Since the Volume Profile Visible Range is the most basic and widely used indicator of the three (3) Volume Profiles highlighted in this article, we will provide a more detailed breakdown of its features.
how to modify VPVR Settings?
The VPVR indicator as well as the other two Volume Profiles can be easily adjusted.
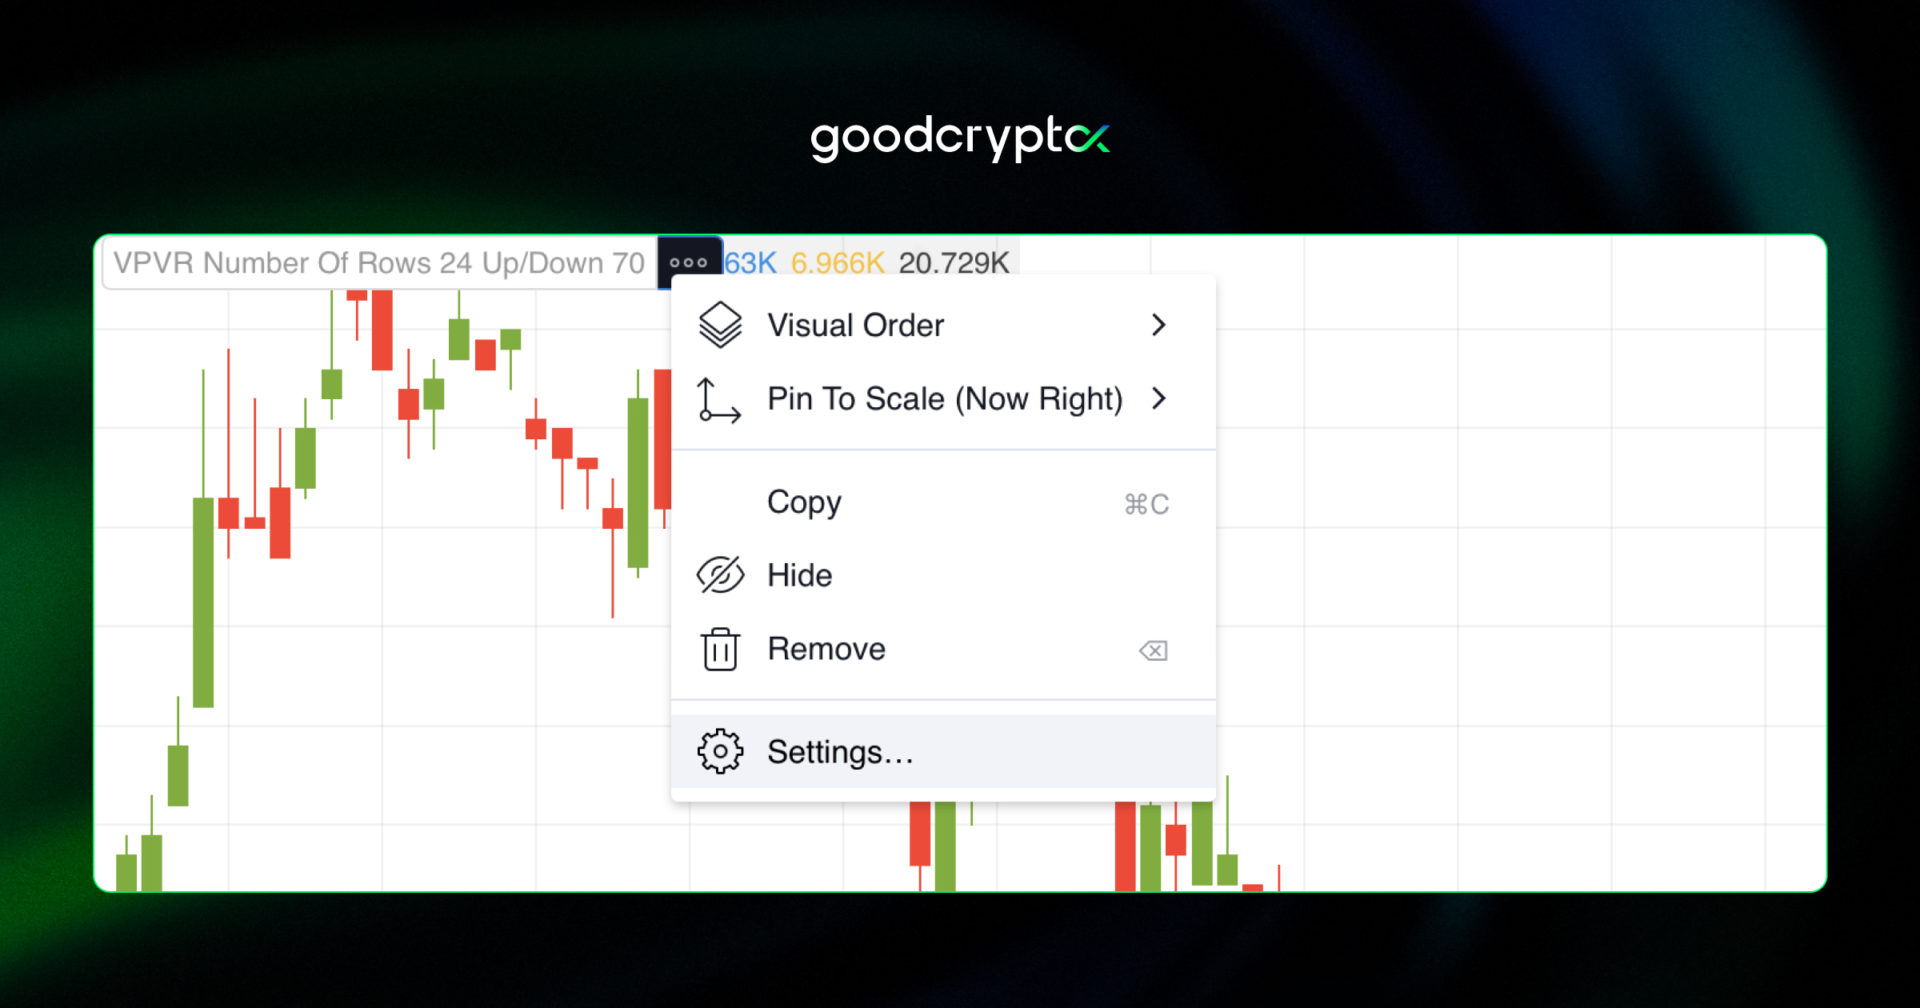
To customize the VPVR settings in the GoodCrypto app, simply click the gear icon beside the indicator:
On the Settings pop-up you will see two (2) tabs: Inputs and Style.
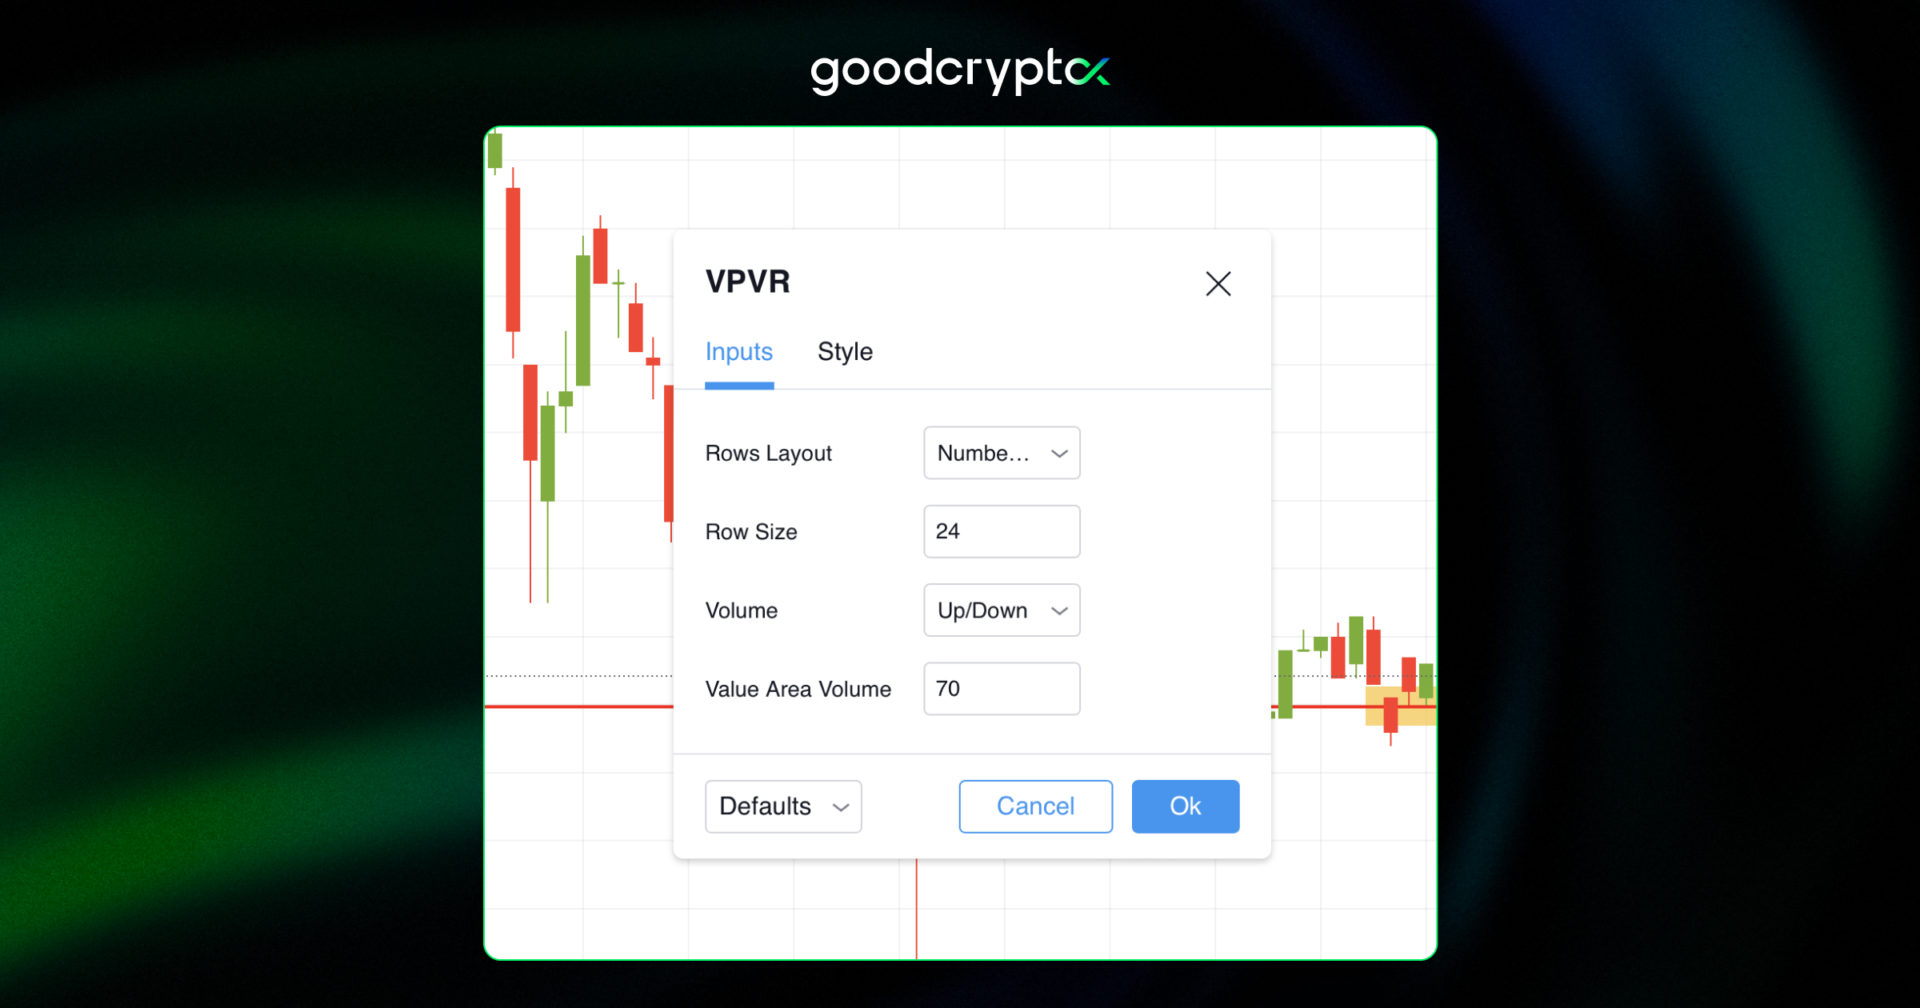
The “Inputs” tab offers four VPVR indicator settings customization options:
Rows Layout
- VPVR “Number of Rows” setting lets traders set a specific number of rows that will be displayed on the histogram. The more rows will appear on the indicator, the more precise information you will get about each price level.
- VPVR’s “Ticks Per Row” setting determines how many price ticks should be included to generate each histogram row. A smaller number of ticks provides a more detailed chart perspective, whereas a higher value combines a larger number of price ticks, minimizing noise.
Row Size – based on the layout, you must type the number of rows or ticks to be included in the indicator.
Volume – here, you have to choose whether you want both buy and sell trading volume to be colored together or be split into two different colors.
Value Area Volume – here, you can modify the percentage of the Value Area. The default value for this setting equals 70%, which is based on the normal distribution model we mentioned in the sections above.
The “Style” tab allows you to adjust the VPVR histogram according to your preferences.
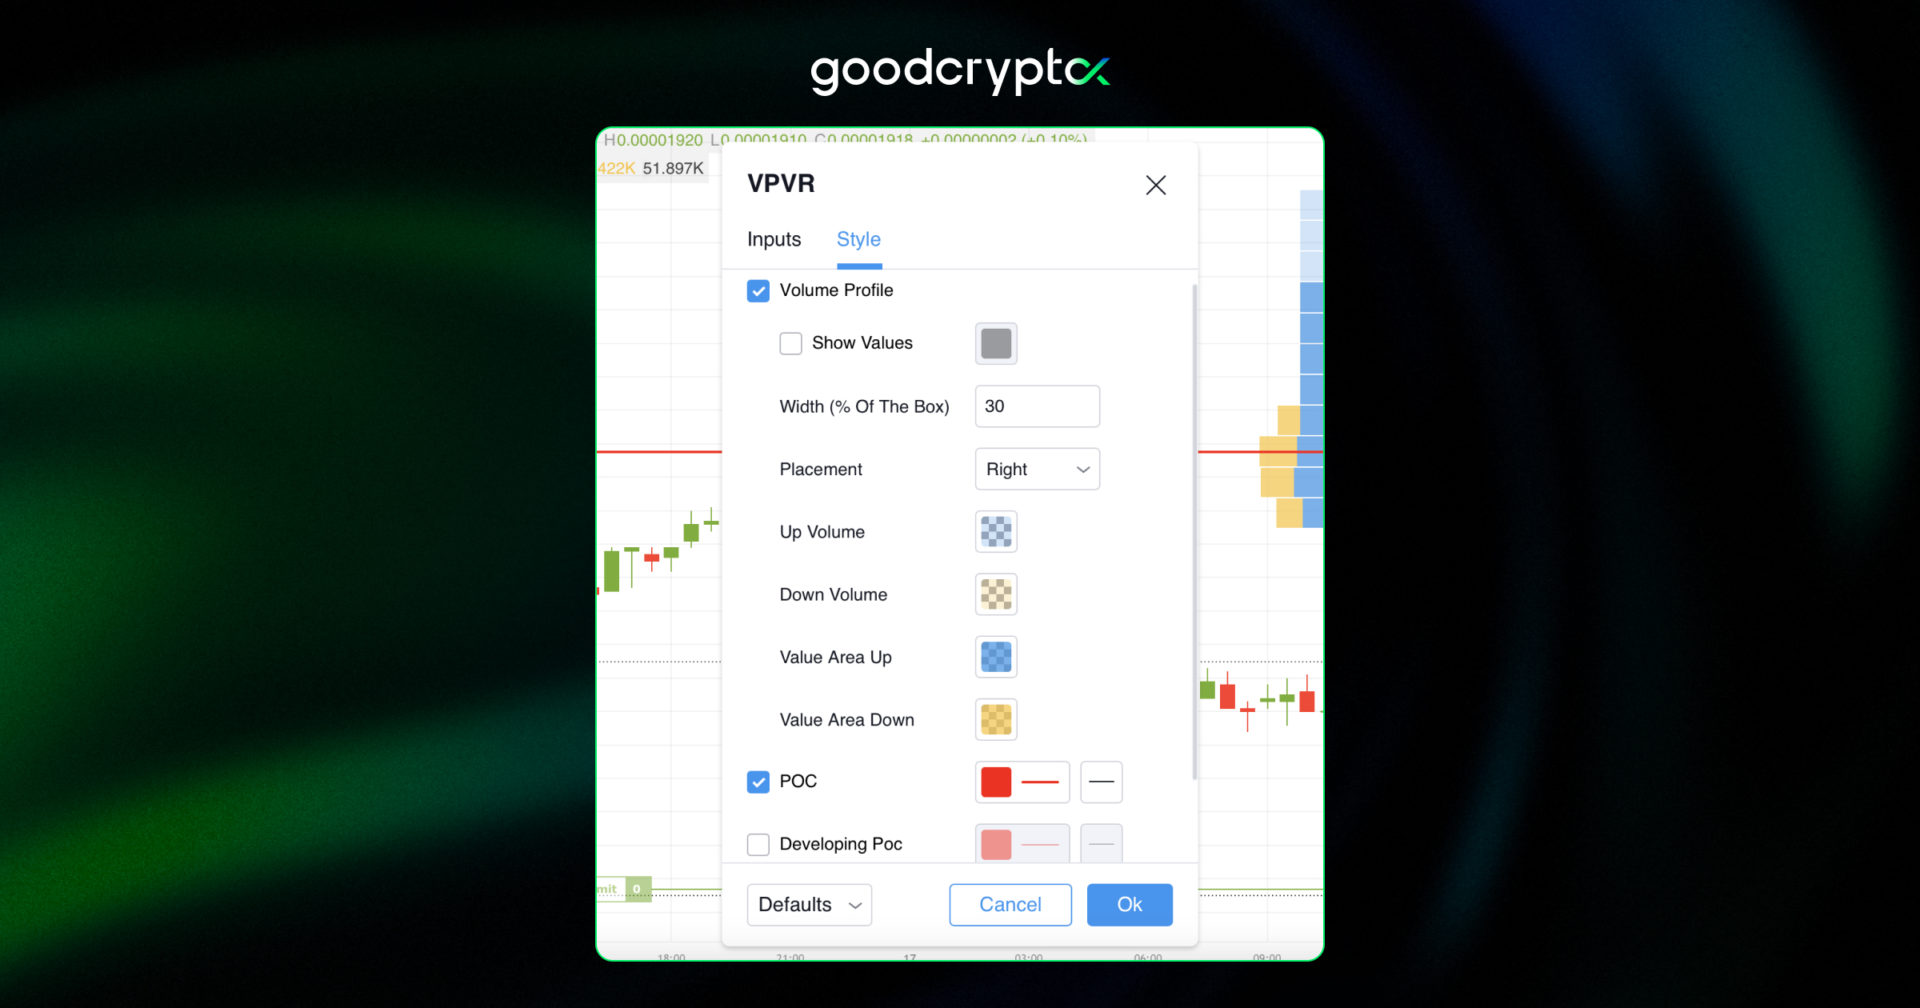
The Developing PoC and Value are two settings that require a little explanation
- Developing Value Area showcases the change in Value Area over time. It is represented by two lines that gradually go up and down.
- Developing PoC is displayed as a stepped line that marks the change of a VPVR PoC line over time.
After clicking on the “Visibility” tab, you can see settings configuring where the indicator will be on the chart.
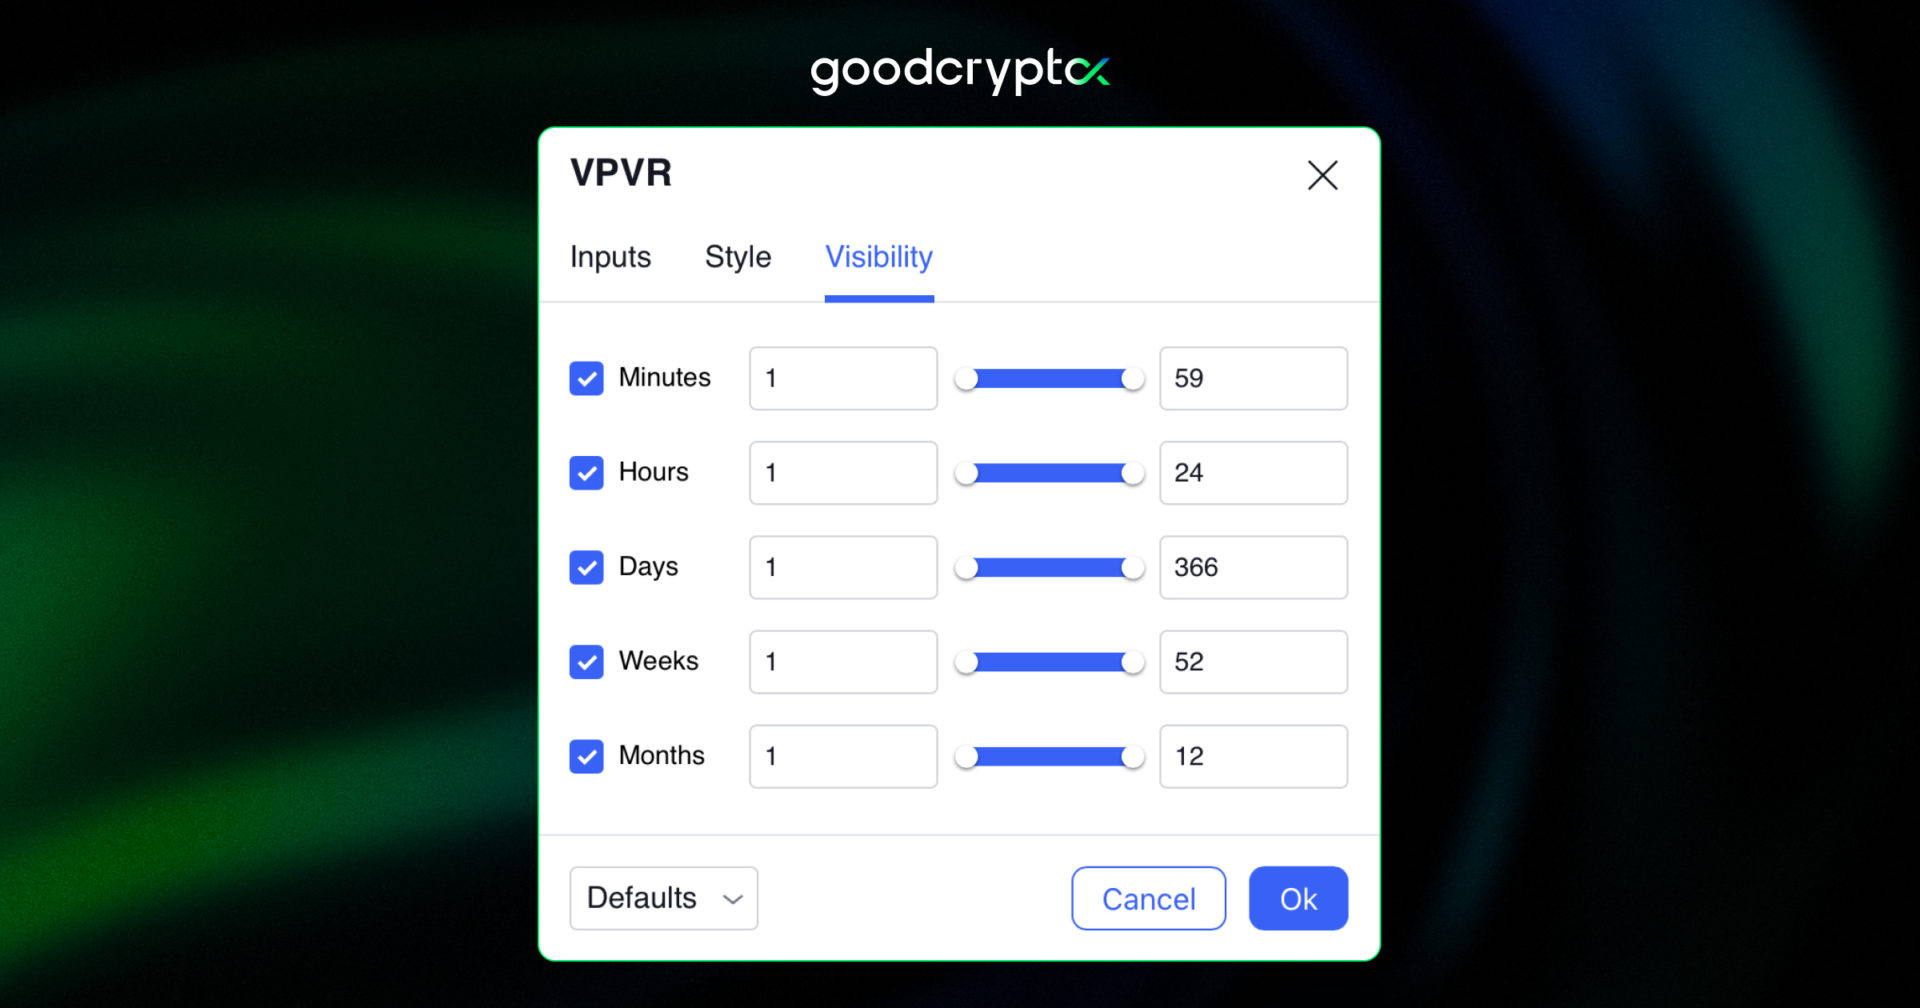
In the example below, the VPVR indicator will be displayed on the chart for all daily time frames, aside from that one day we pointed out.
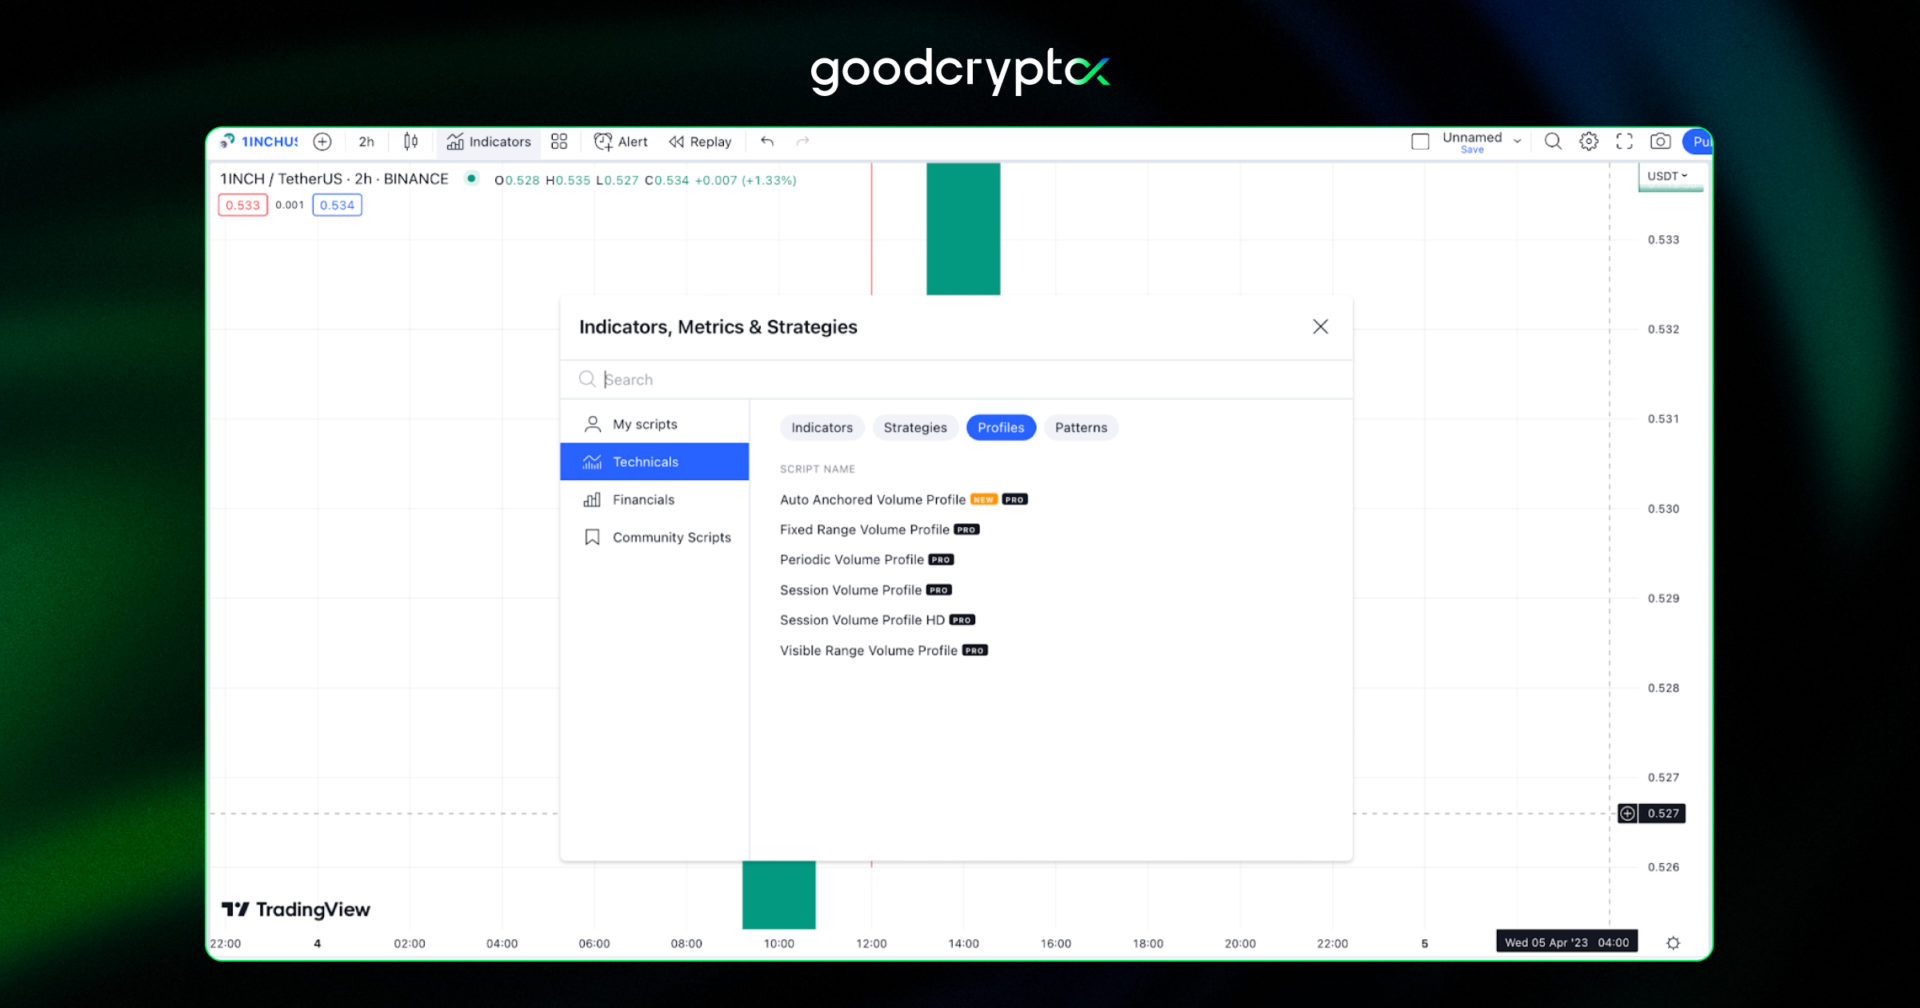
Fixed Range Volume Profile
The Fixed Range Volume Profile (VPFR) visualizes the distribution of trading activity for a specific time frame defined by the user.
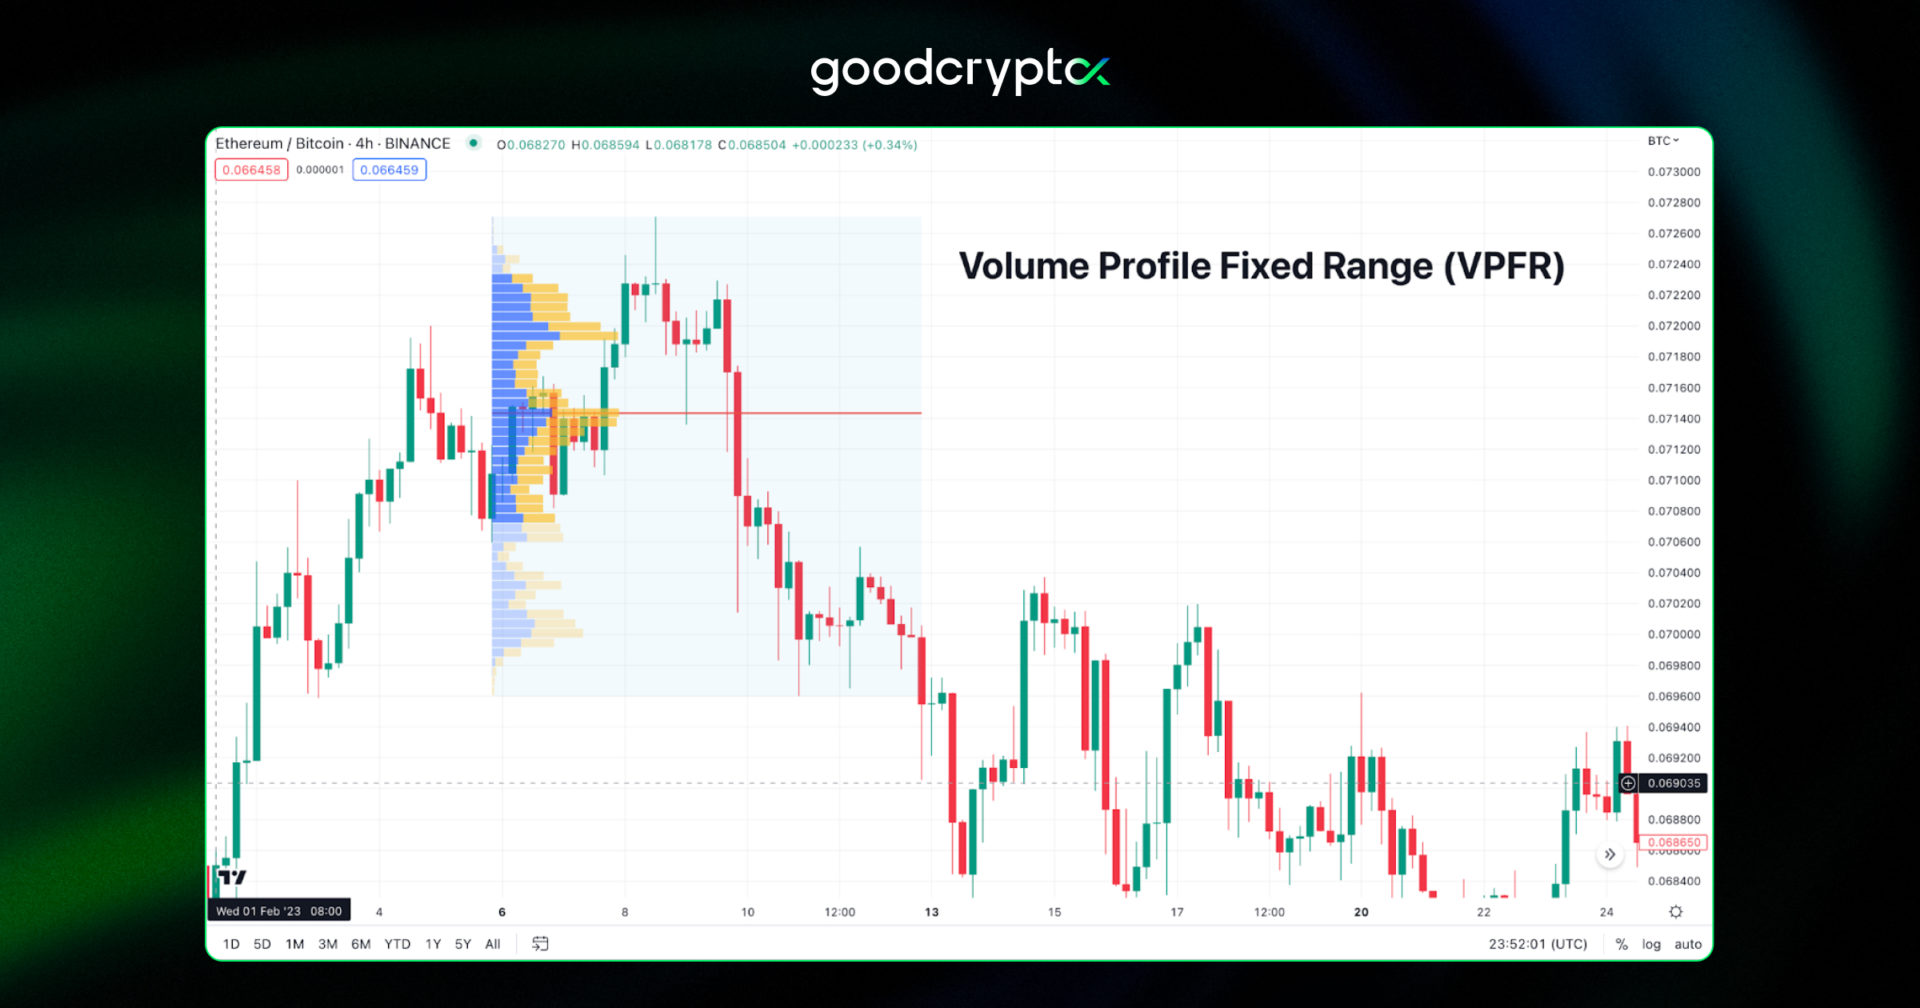
As the name implies, this Volume Profile allows traders to plot a range of the chart on the histogram. So, you can move your chart wherever you want – the values will stay still. For this reason, the way this Volume Profile is presented in the graph varies from the VPVR.
How to set a VPFR indicator?
- Firstly, you have to select a price range you want to analyze.
- Once the price range is set, the Fixed Volume Profile gathers the data on how many trades occurred within that range and plots it into the histogram.
VPSV Indicator
The Volume Profile Session Volume is similar to the Fixed Range, except for one thing: instead of a fixed time frame, it delivers volume statistics for each price point instead of a fixed time frame.
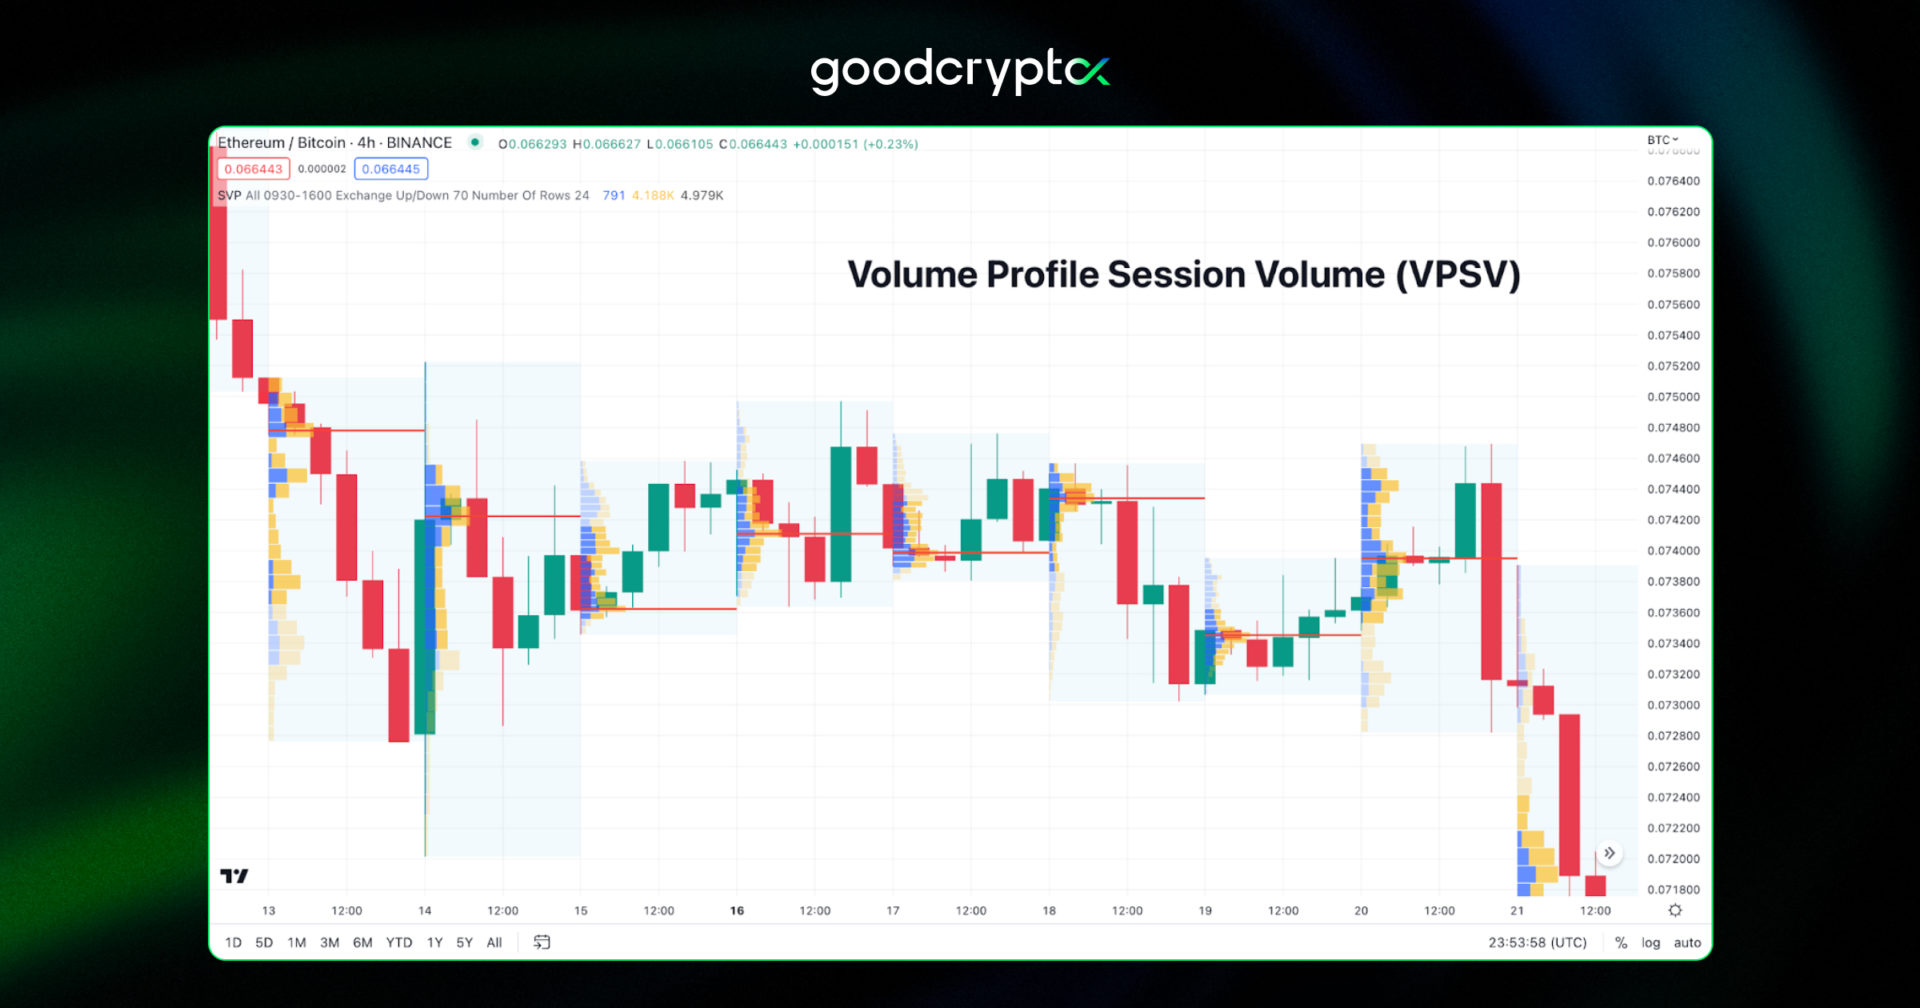
The VPVS indicator is based on the volume traded during a specific session that a user can specify.
First, to calculate the VPVS indicator, split the entire volume traded during the session into smaller periods, which generally range from 1 to 5 ticks. The volume for each period is then added together to provide a profile of the volume transacted at each price level during the session.
how to use Volume Profile Indicator?
Here is a brief summary of how the Volume Profile can be utilized. The VP indicator can be used to:
- Showcase support and resistance levels
- Display a fair price of the asset
- Predict a potential trend reversal
- Determine whether the market is balanced or imbalanced
So, why don’t we move forward and start looking at how Volume Profiles can benefit your trading strategy?
the Only Volume Profile strategy you’ll need
The strategy we will share is universal for every Volume Profile indicator. We will use a VPVR indicator since it can be accessed for free in our beloved goodcryptoX app!
If you decide to test this or any of the Volume Profiles on TradingView, be prepared to buy a PRO plan because none of the indicators can be utilized for free.
Let’s get back to the volume trading strategy, shall we?
First and foremost, before you start spotting Volume Profile patterns, you need to adjust the settings of the VPVR indicator.
The histogram with the default number of bars, usually 24, looks chunky and tells us little to no information regarding actual trading activity.
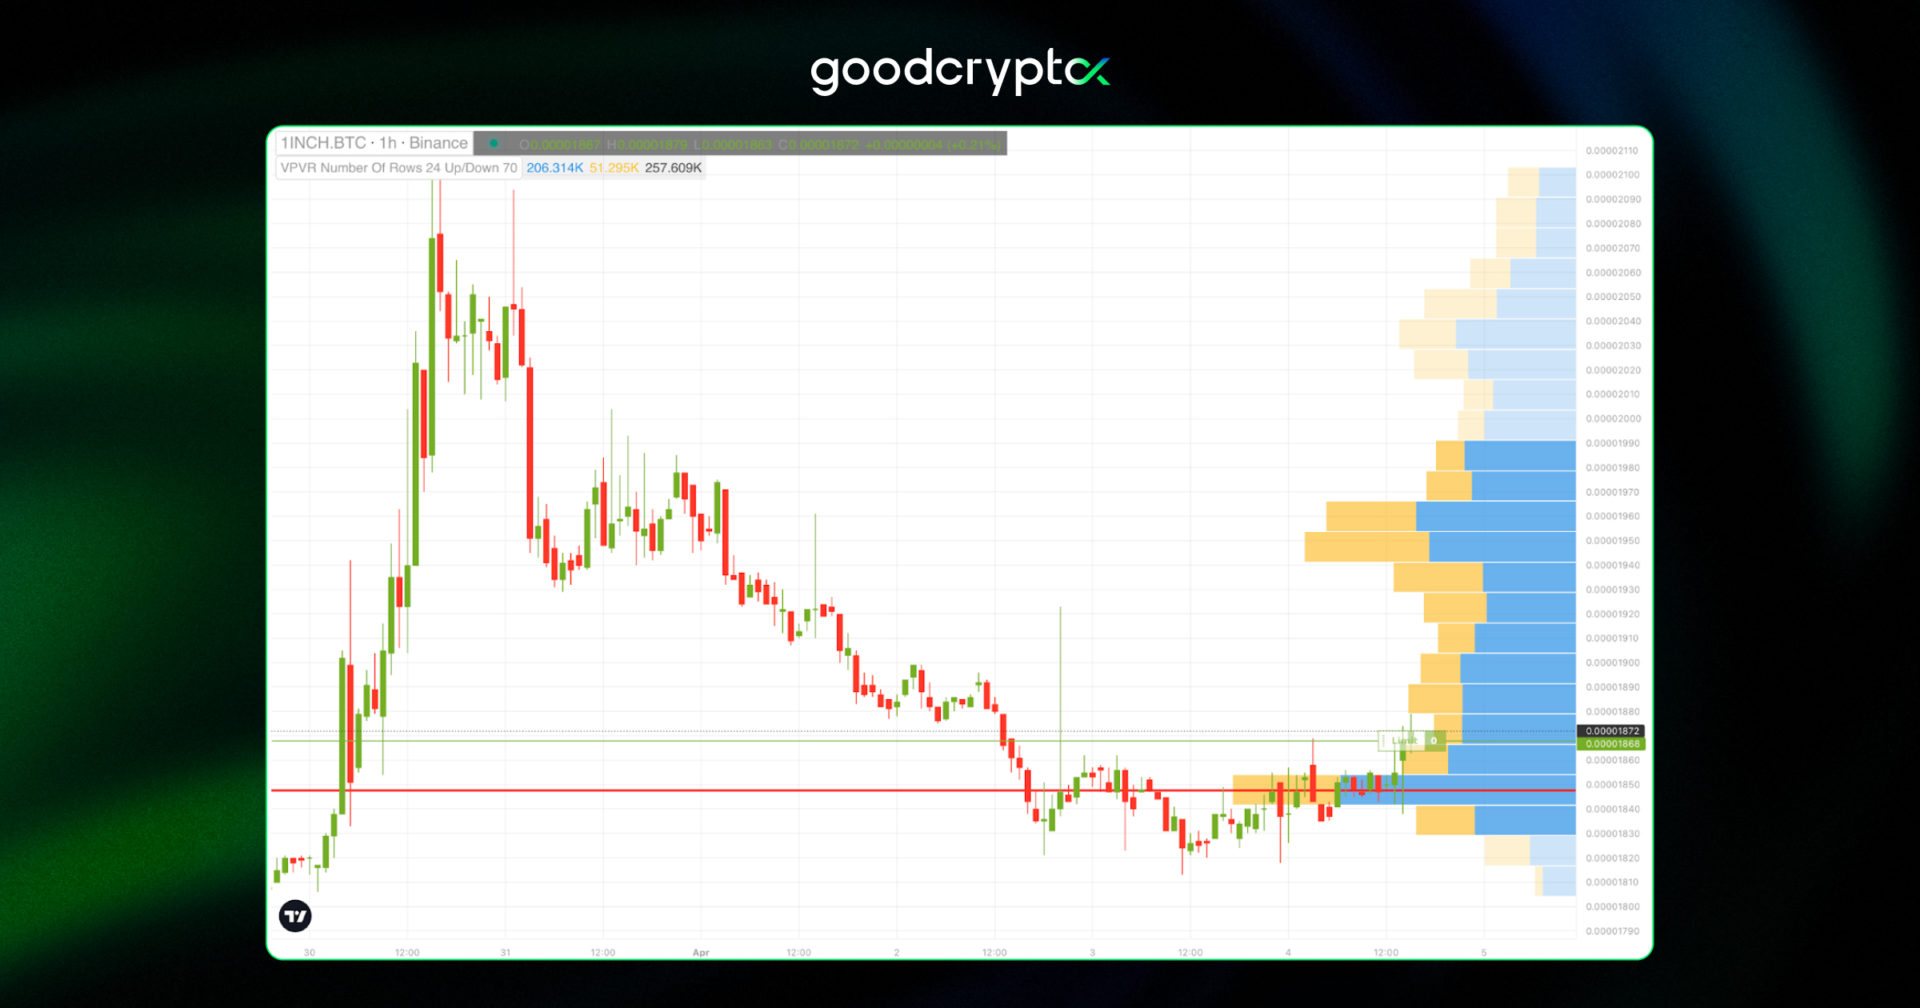
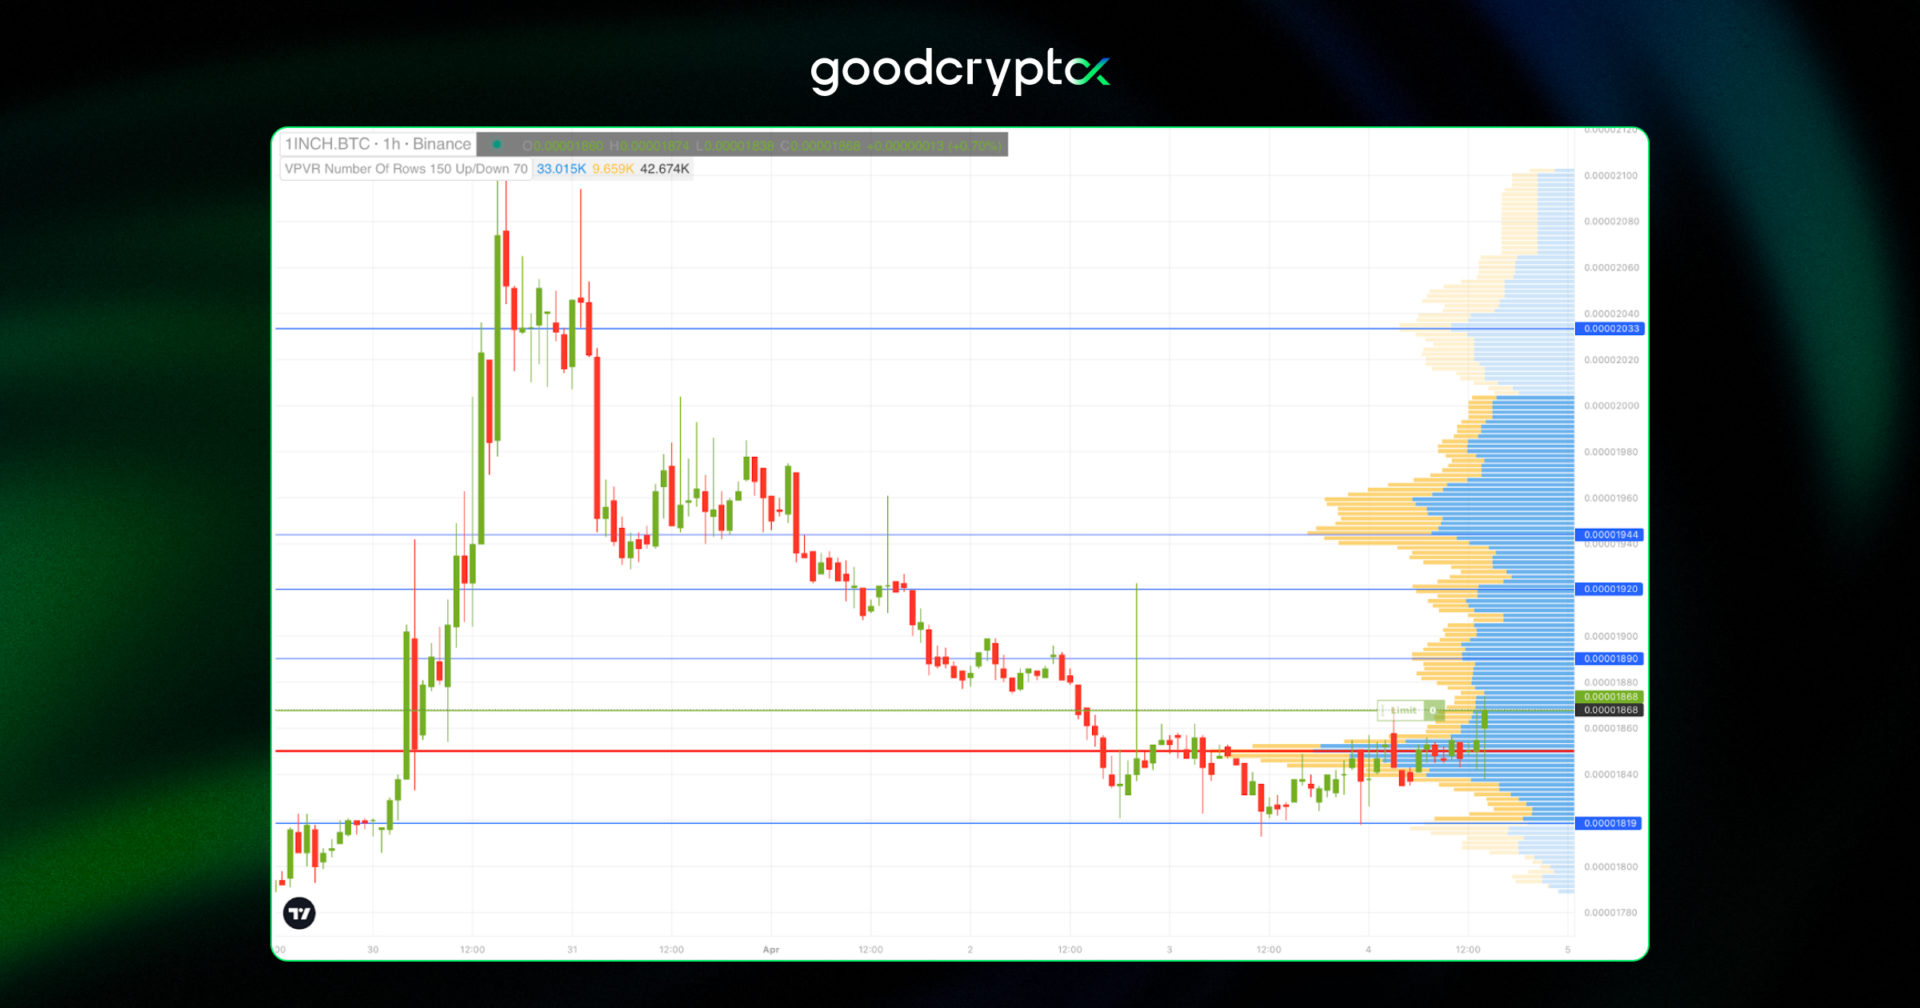
However, once we increase the number of rows, the histogram transforms and immediately looks more detailed, giving us a better visualization of where the volume is. You will see later why it is so important.
As we’ve already mentioned, we use the POC line as support and resistance, and both high and low-volume nodes can serve as support and resistance levels as well – those are the areas where you can see potential reversals or bounces.
Compared to LVN areas, high-volume nodes are followed by a short period of consolidation since there is increased trading activity.
This is a little reminder for you, dear reader!
“A support level denotes a price point at which the purchasing pressure is powerful enough to halt an asset’s downward movement, while a resistance level marks a price point where the selling pressure is powerful enough to stop an asset from continuing its upward trajectory.”
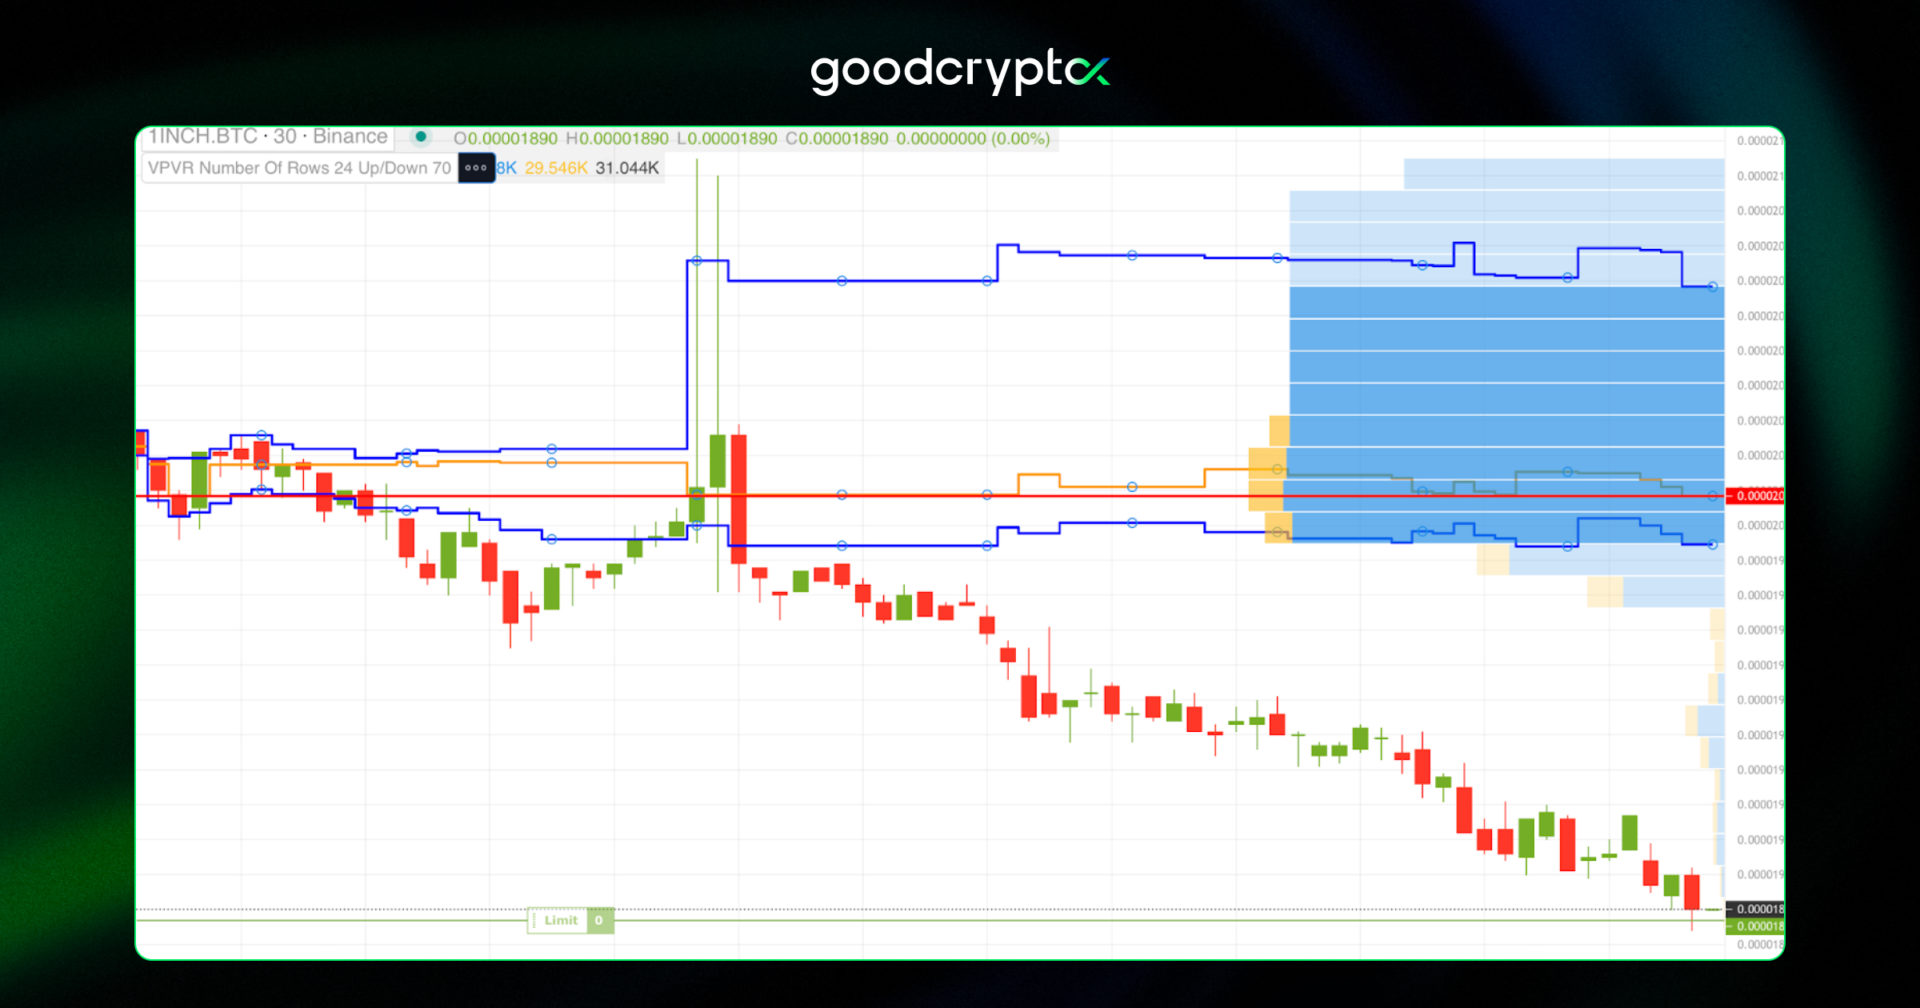
So, here are key takeaways from the 1INCH/BTC chart:
- On March 30, the price broke above the POC line – a signal to take a long position. In this case, the POC line served as a support line.
- The price was in an active uptrend until it went over the Value Area. After a short period of consolidation, the price started to fall, breaking below a few High Volume Nodes and the POC line, which is, in fact, a signal to short. However, since the price doesn’t make any sudden movements and just oscillates around the POC line, we should change the time frame to look closer at the current market state.
- As we can see, the price tried to break above the new POC line, but the trend wasn’t strong enough, so it consolidated for a day and then broke above the Point of Control line once again.
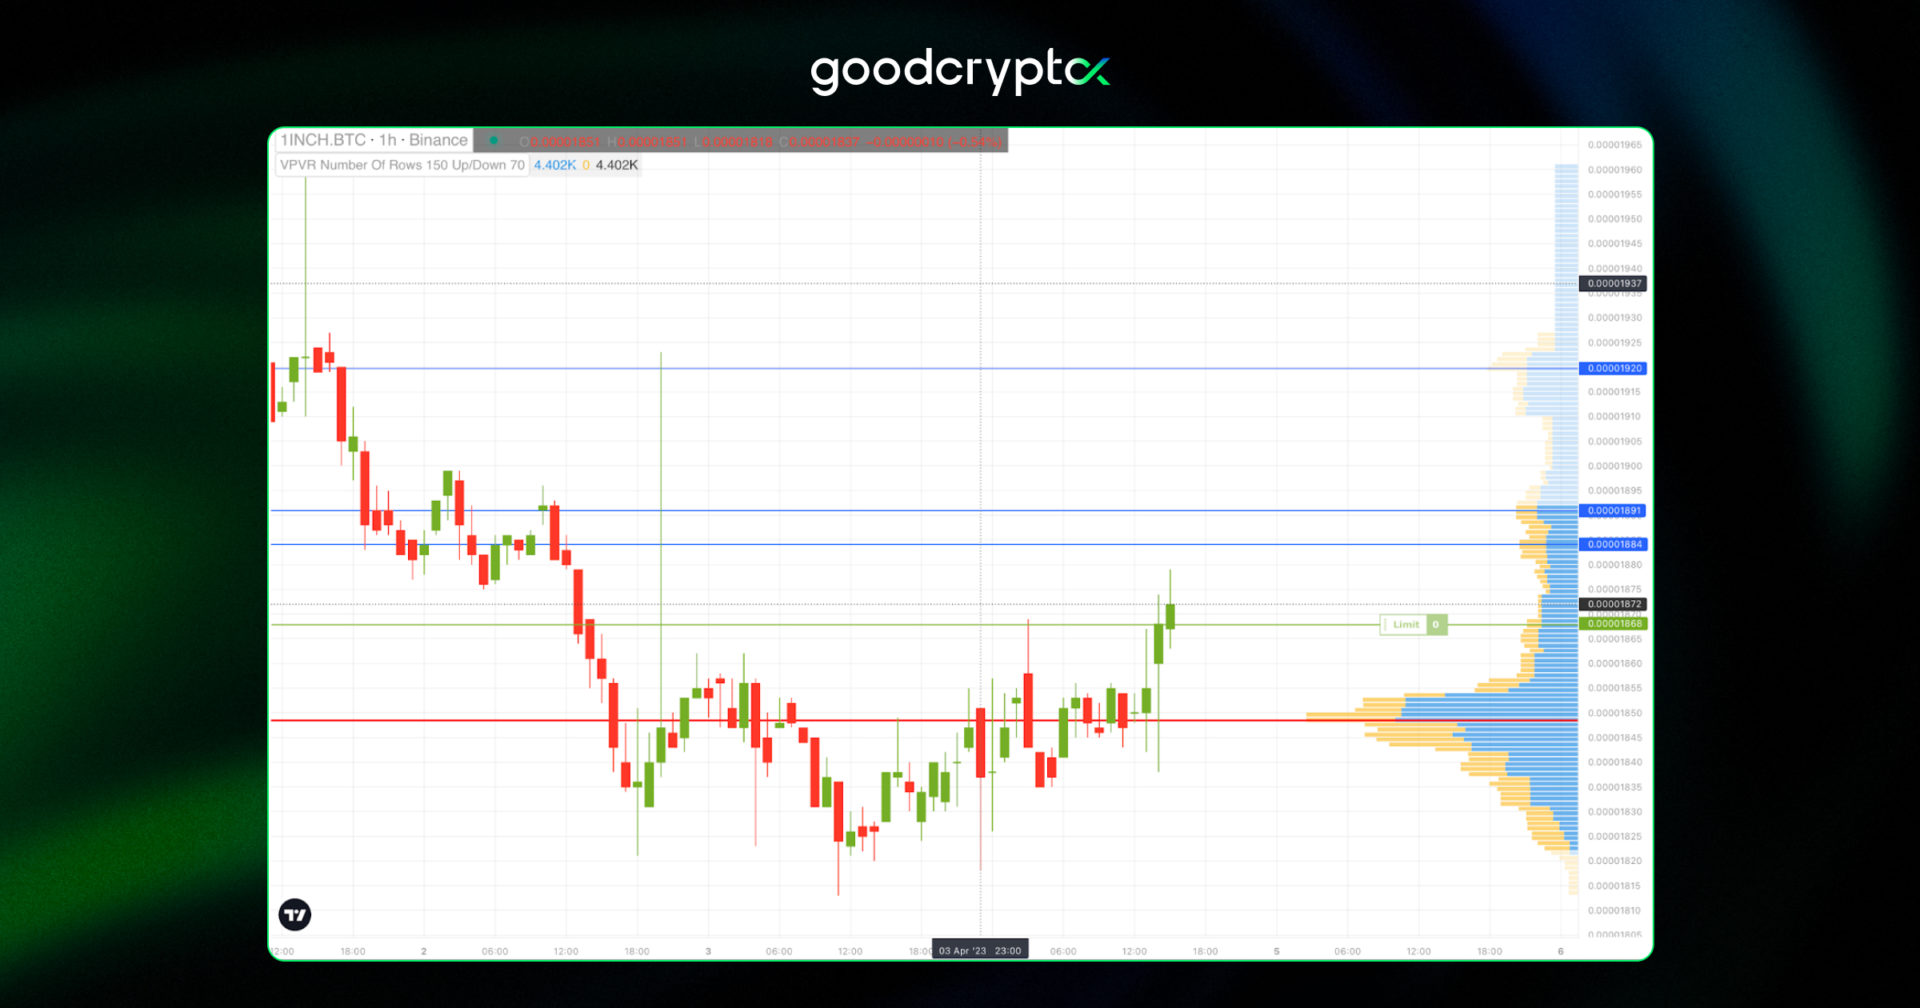
- Now, the price is in the LVN area, a market with less trading activity, so we expect the price to either rise and/or break one of the HVN areas that we already marked or lose momentum and try to go back to the POC line.
In the larger time frame (29 March – 04 April), the price has experienced a downtrend and is currently (at the time of writing) consolidating in the most active part of the VA. While in the shorter time frame (1 April – 4 April) it showcased an uptrend and moved outside the VA and towards an area with less trading activity.
identifying market trend with Volume Profile Shape
The VP indicator comes in different shapes and forms. As a trader, you can grasp helpful information based on the distribution pattern.
Some of the widely known shapes of the Volume Profile include:
- D – Shaped Volume Profile: This Volume Profile distribution represents balance in the market. It looks just like a bell, a sign of a statistically standard distribution model: the POC line in the middle of the profile is regarded as “fair” in this stage, and neither buyers nor sellers behave aggressively.
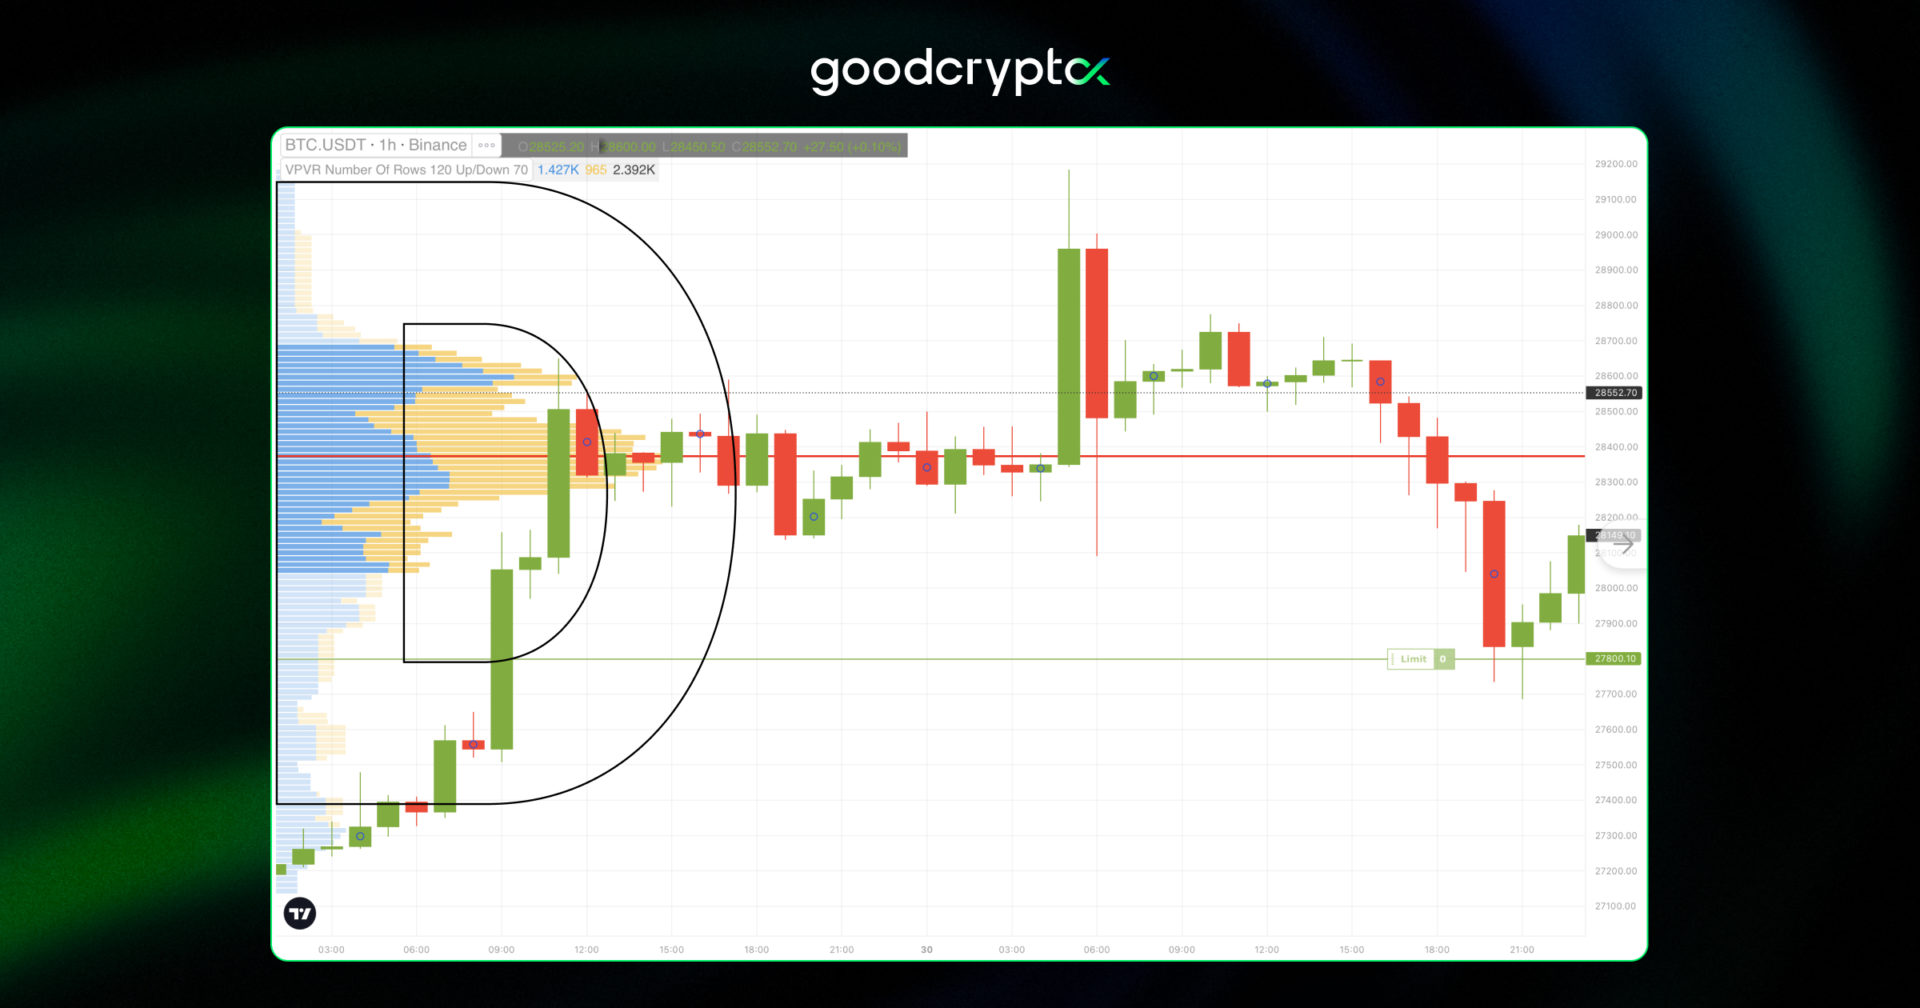
Volume Profile traders observe D-shaped histograms closely since they anticipate a price change – the market will eventually break out in one direction or another.
- P – Shaped Volume Profile: This Volume Profile distribution shows a market uptrend. The “P” shape is formed when buyers start acting more aggressively, and sellers can’t keep up with them – the price increases dynamically and then consolidates.
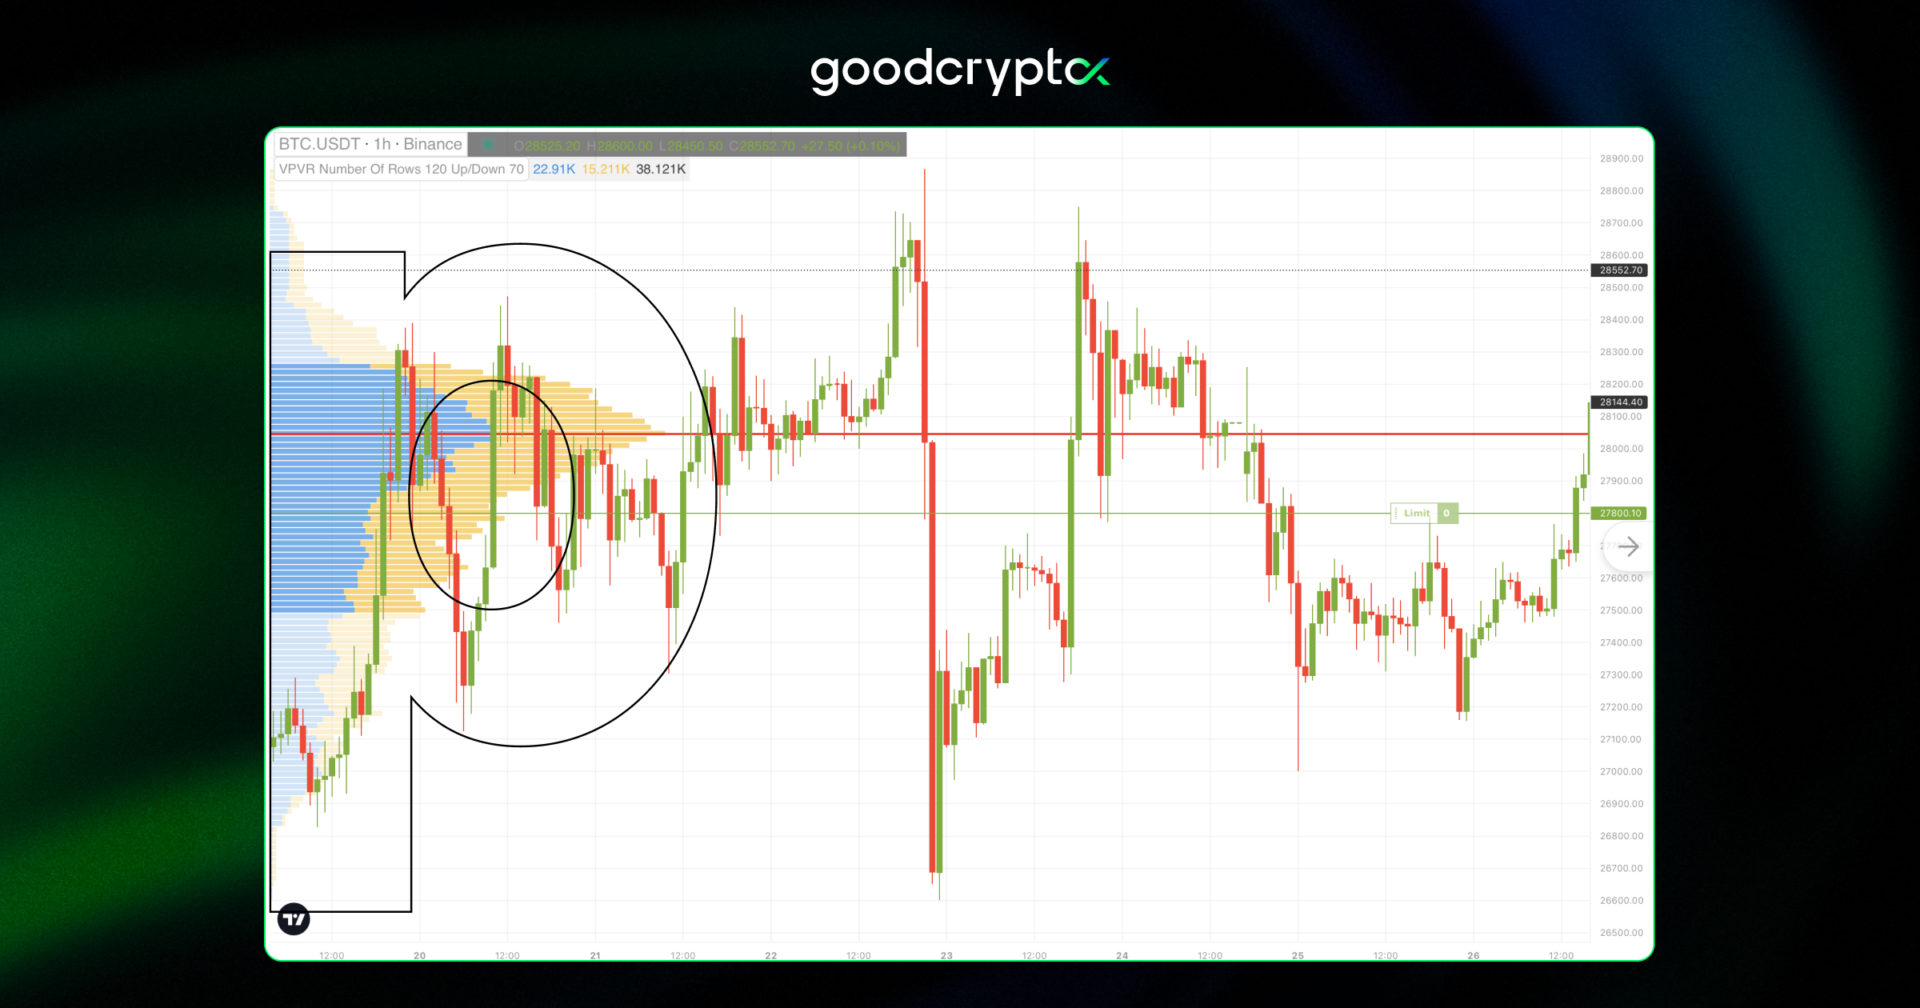
The P-shaped profile’s wider top half shows a new “reasonable” price (POC) between the two parties.
- b – Shaped Volume Profile: The “b”- shaped Volume Profile appears when the price drops and consolidates. It is the outcome of the battle between pushy sellers and weak purchasers.
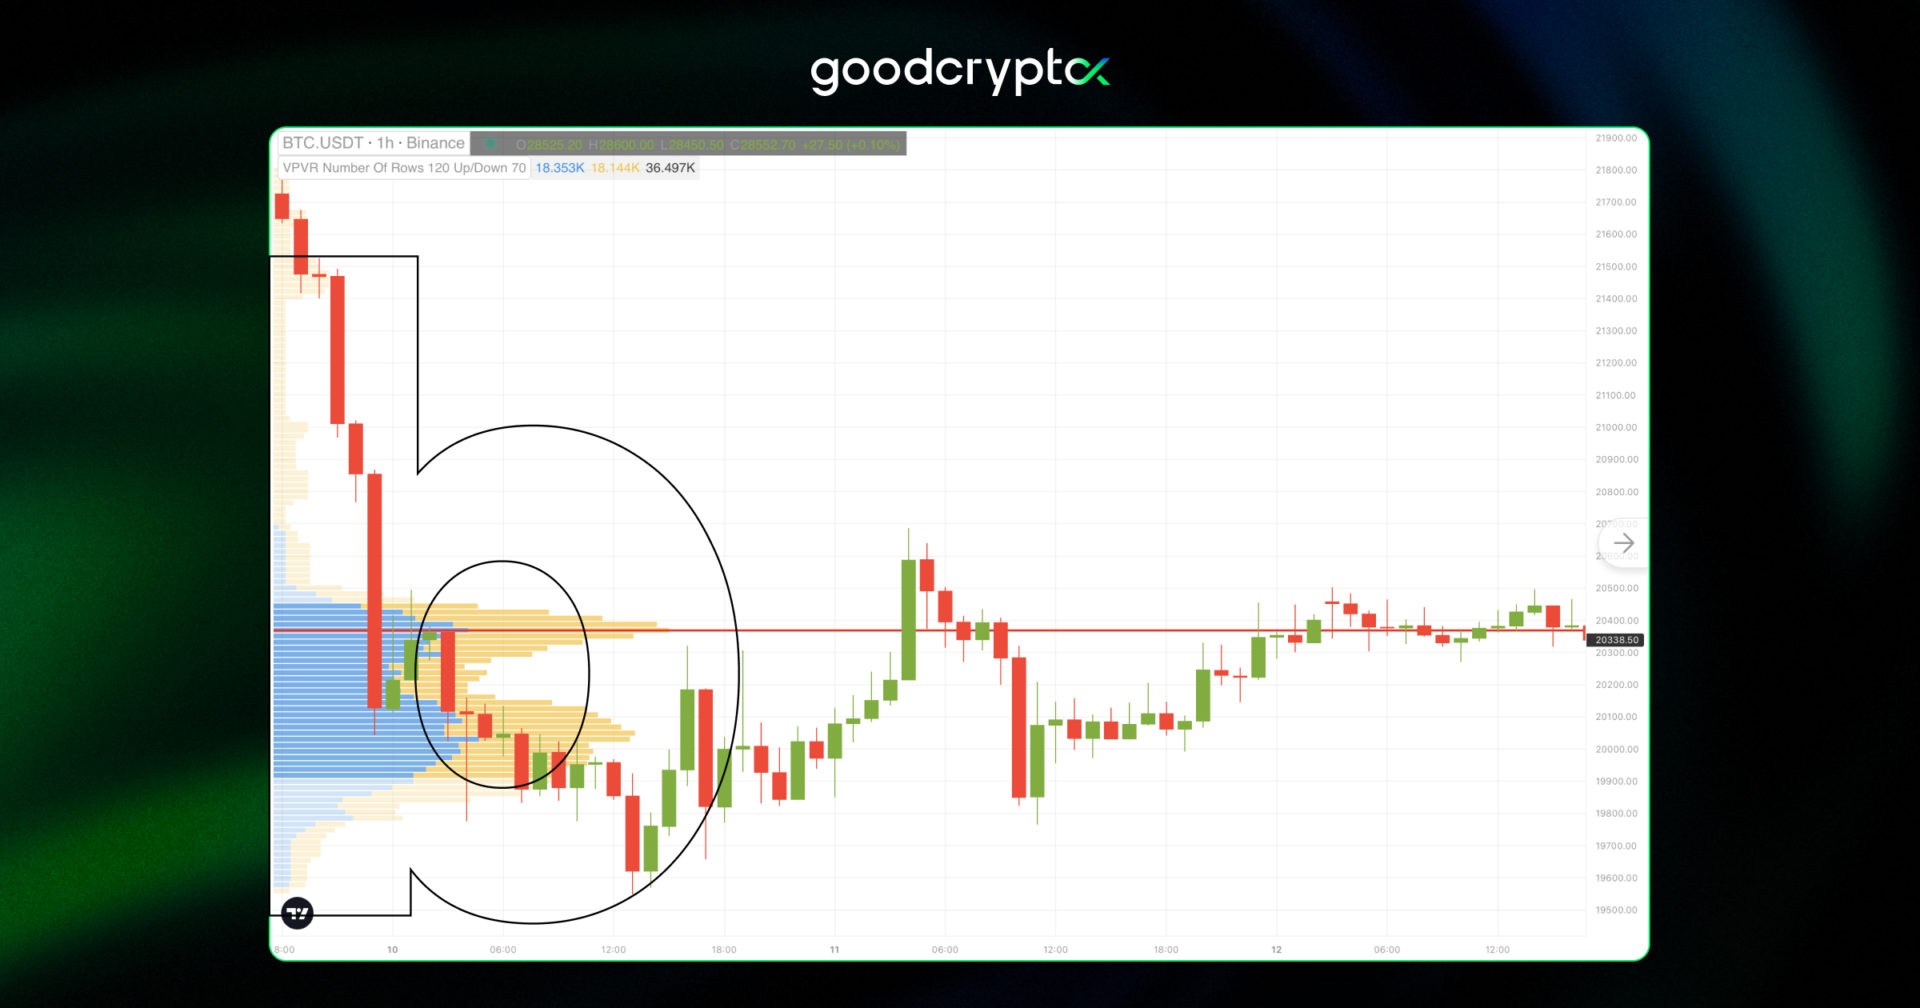
Generally, the price with this pattern is believed to balance itself in the long run, so traders consider it a bearish indication.
- B – Shaped Volume Profile: The B-shaped Volume Profile develops when two high-volume congestions occur inside the same session. It’s a sure indicator that the trend will continue.
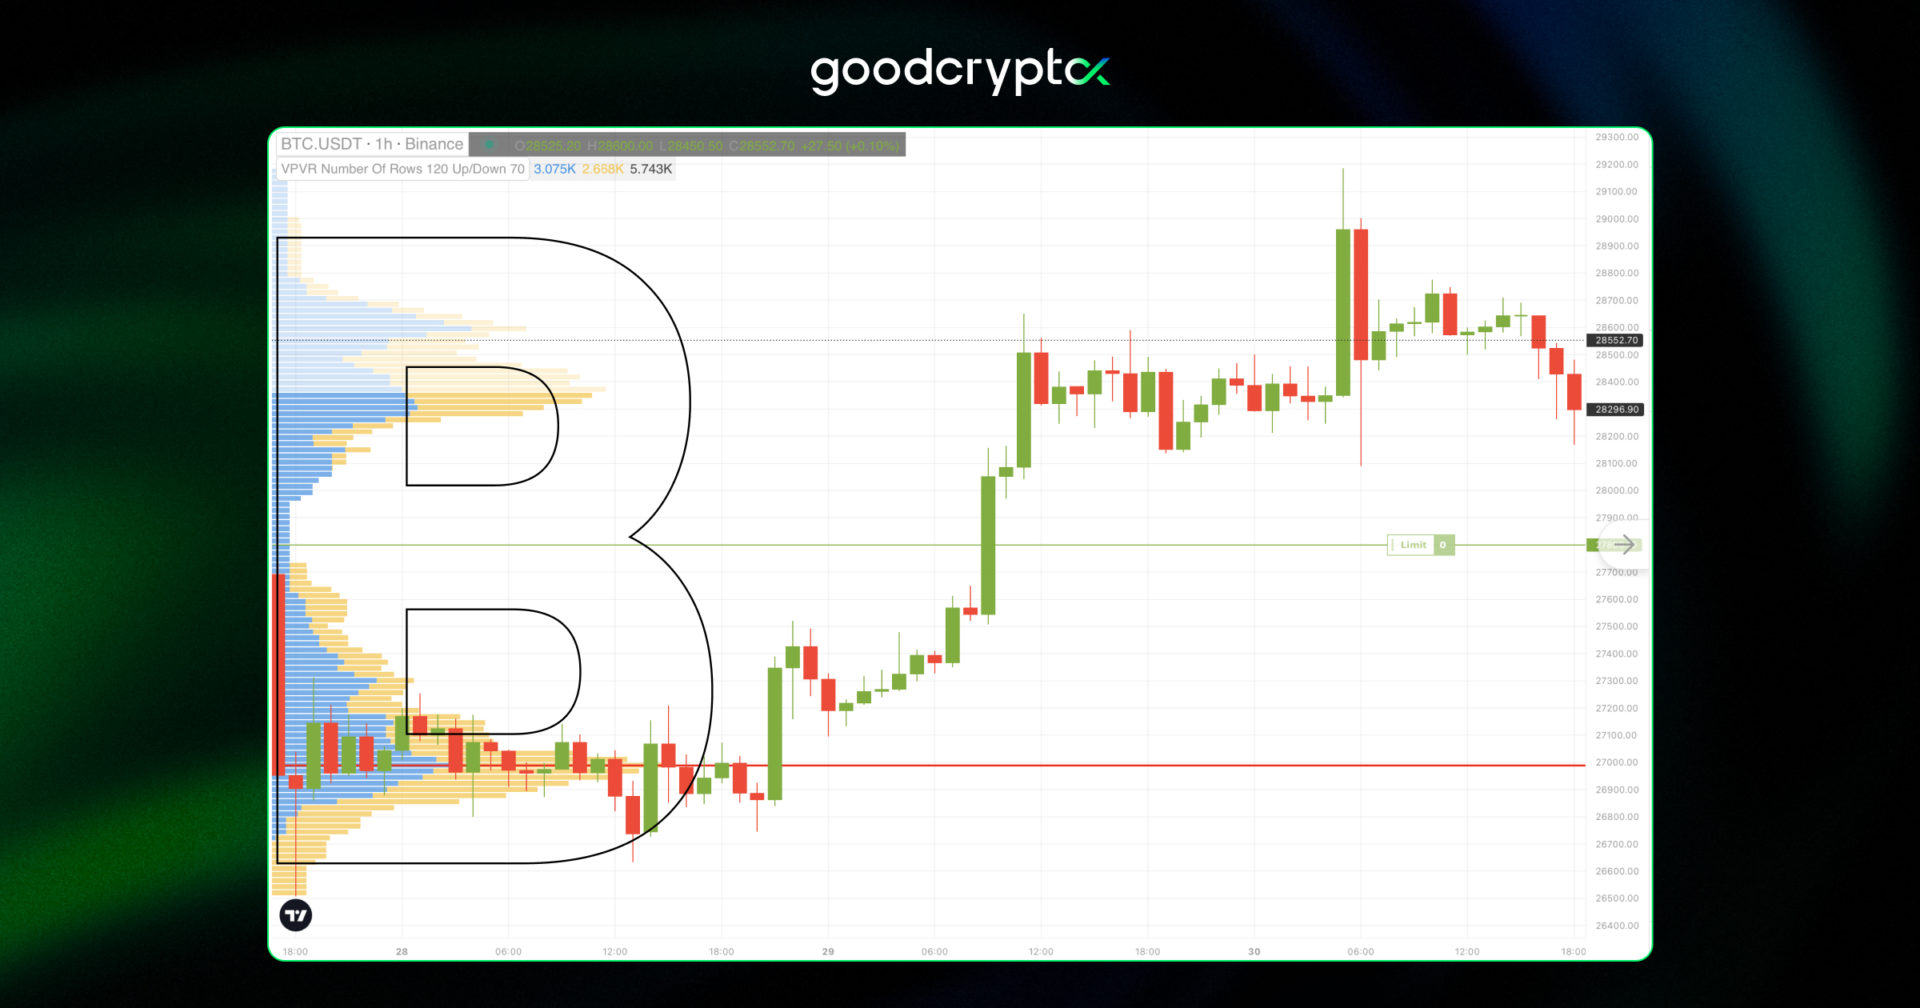
As we all know, the Volume Profile contains only one POC line and one Value area. However, after examining the B-shaped histogram, both “bells” may be viewed as normal distributions. Yet, the one with the actual POC line and Value Area is regarded as dominant.
conclusion
Volume is a lifeblood of the markets and liquidity, so understanding the Volume Profile will provide valuable insights into the market and its participants’ behavior.
One of the key advantages of the Volume Profile Indicator is that it can help traders identify essential price levels that may take time to be evident from looking at a traditional price chart. This is because the Volume Profile Indicator considers the volume of trading activity at each price level rather than just the price itself. Besides, it helps traders determine the future state of the market.
If you want to sharpen your toolbox, Volume Profiles are your go-to additions to your arsenal!
trade volume indicators easily with goodcryptoX
Volume Profiles are advanced technical indicators that might not always be found on the trading charts of some tools and exchanges, even if you are ready to pay for them. But what if you just want to dip your toes into the volume profile analysis to see whether it runs up to your expectations?
goodcryptoX is just the tool you are looking for! You can download a mobile app or go to the website to test out one of the most famous Volume Profiles, the VPVR indicator, alone or in combination with other technical indicators, like Moving Averages, Bollinger Bands, and RSI. All of them and much more are available and free of charge!
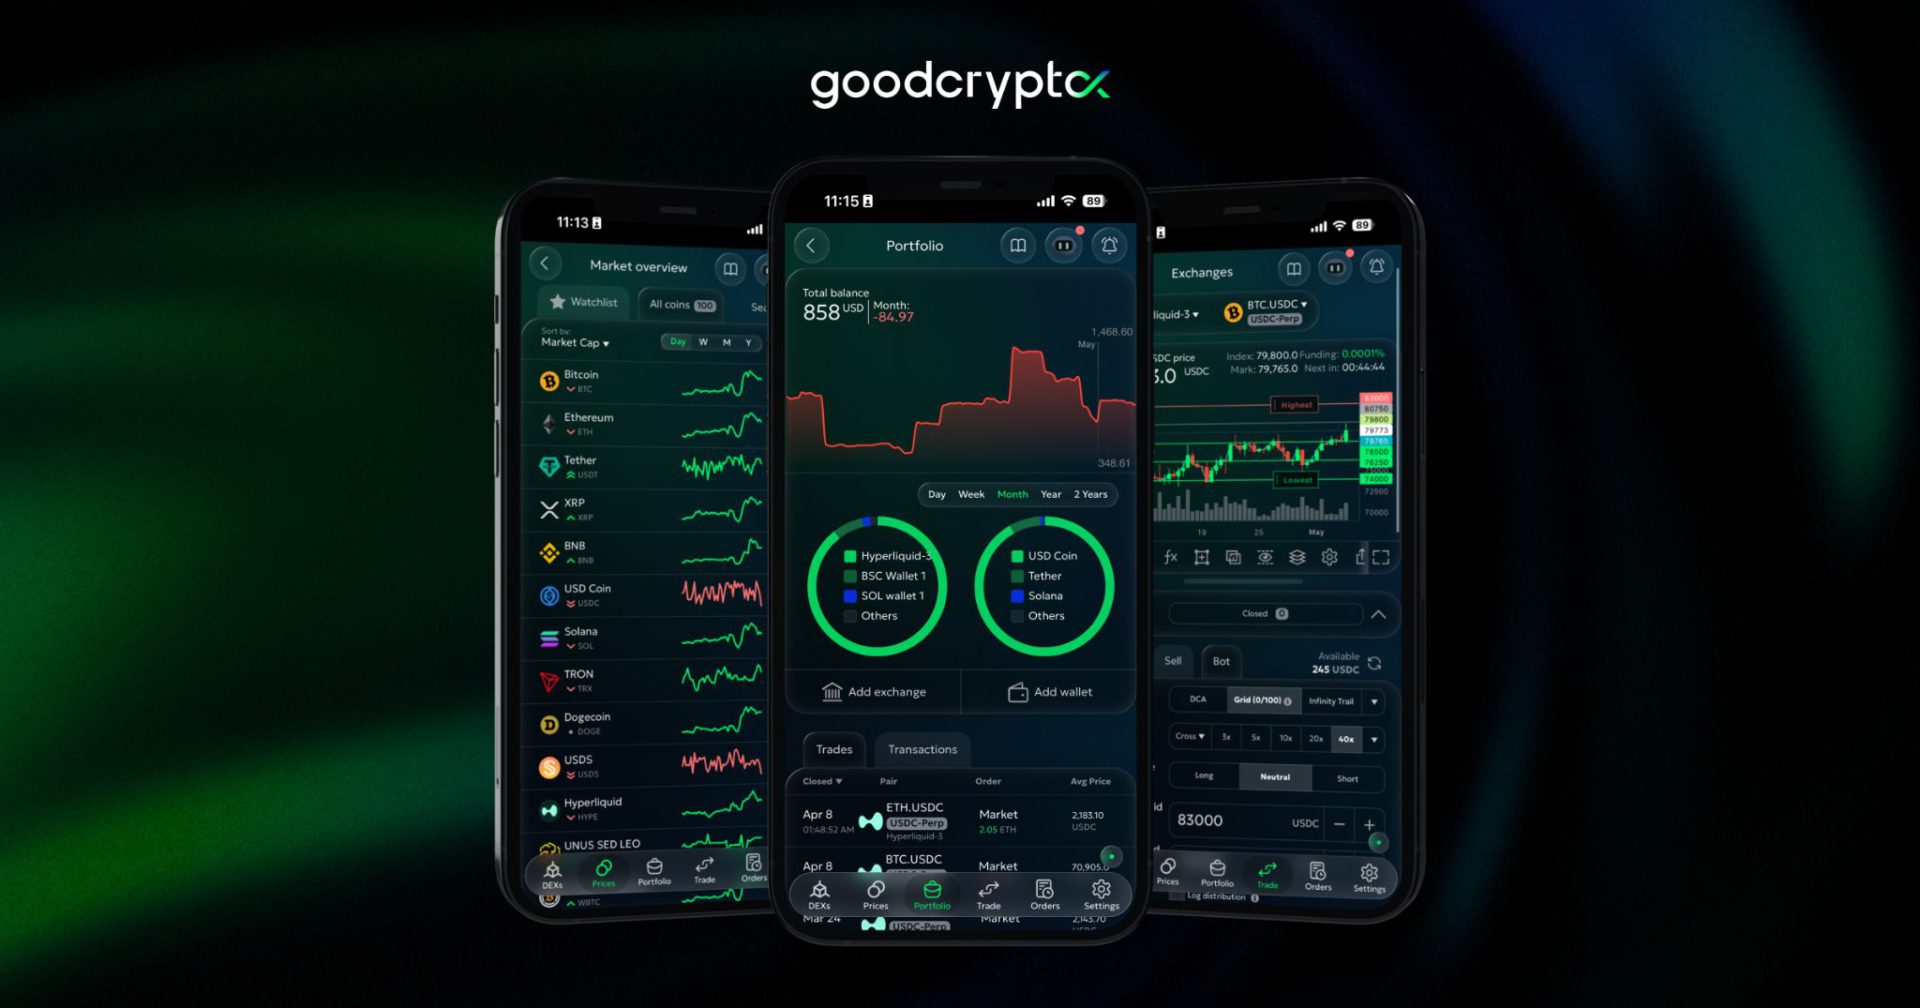
Gone are the days of juggling multiple passwords and logging into numerous accounts. With goodcryptoX, you can effortlessly manage your digital assets from a single platform, providing you with a hassle-free and stress-free trading experience.
What’s more, goodcryptoX offers advanced trading tools that enable users to trade digital assets like professional traders:
- Take advantage of Grid, DCA, Infinity trailing, or TradingView Strategy bots, and make them execute trades for you 24/7.
- goodcryptoX provides access to crypto signals based on a currency market state and 25 technical indicators, which allows traders like you to capture ideal entry points and make informed trading decisions.
- Apply goodcryptoX’s Trailing Stop Orders to enhance your gains from deals.
- Finally, goodcryptoX’s Take Profit & Stop Loss combos can protect trades without locking the user’s balance until triggered. Ultimately, the goodcryptoX Trailing Take Profit and Stop Loss features help users to maximize their gains from trades.
In addition, goodcryptoX provides real-time tracking of the entire crypto market, with over 10,000 currencies and 20,000 trading pairs available for monitoring, as well as a comprehensive Gems DEX Screener for on-chain gems discovery across the 5 largest chains.
Users can also connect their exchange and blockchain wallet accounts to the app to keep track of their portfolio’s performance at all times.
Excited? As you should! Download goodcryptoX now from the iOS App Store or the Android Play Store to learn why it’s the go-to software for aspiring cryptocurrency traders and investors.
If you have any more questions, please ask them in our Telegram public chat channel, which is open 365/24/7.