

Being a successful trader requires that you put in the work, and your journey will most likely begin by learning technical analysis. One of the most essential skills in TA is to be able to spot chart patterns and interpret them correctly. This will allow you to better assess trends and give you sufficient insight to forecast a possible trend continuation or reversal.
In this article, we cover some of the most common crypto chart patterns that expert traders use on a daily basis. More importantly, we will provide some useful pattern day trading examples for each one of them, so that you can apply them in your analysis. What’s more, all of this will be done using the goodcryptoX trading app.
To streamline the learning process even further, we will provide you with a full rundown of the tools required to draw your own crypto patterns. So not only will you learn how to read chart patterns, but you will also be able to apply them yourself.
Top Trading Patterns for Crypto Day Trading
Before we delve deeper into our trading patterns article, let’s first thoroughly explain: “what is pattern day trading?” Crypto trading patterns are chart formations of the price action of an asset. These can be easily singled out to predict a likely price direction in the near future. Consequently, trading chart patterns can be used to place entry and exit points in your day trading activities and take advantage of the upcoming price movement.
The day trading patterns you will be using depend heavily on the timeframe that you choose to day trade crypto. For instance, crypto trading patterns on a 15-minute interval will be useful for short-term trades, allowing you to open multiple positions in a single day. On the other hand, drawing crypto trading patterns lines on the 4-hour chart will allow you for better insight into swing trading strategies.
This means that to become a successful pattern day trader, you have to manipulate charts like a pro, applying a chart pattern trading strategy for various timeframes.
Stock Trading Patterns vs. Crypto Patterns: What is The Difference?
When comparing crypto day trading forecasting patterns to stock patterns, you will quickly notice that there isn’t much difference between the two. So if you know how to read crypto patterns, you will be able to apply this same knowledge to the stock market as well. As such, the stock trading patterns vs. crypto patterns debate is completely unnecessary.
The moment you have assimilated: “which are the best crypto trading patterns to watch for?” you can correlate these findings on day trading stocks.
Bullish Reversal Patterns and Bearish Reversal Patterns
There are two main trading patterns in day trading – crypto reversal patterns and continuation patterns. First, let’s cover reversal chart patterns as they usually trigger higher trading volumes and can help you make good amounts of profit.
Trend reversal patterns fall into two distinctive categories:
- Bearish reversal pattern signals, which signal a trend reversal to the downside and provide sell signals.
- Bullish reversal pattern signals, which signal a trend reversal to the upside and provide buy signals.
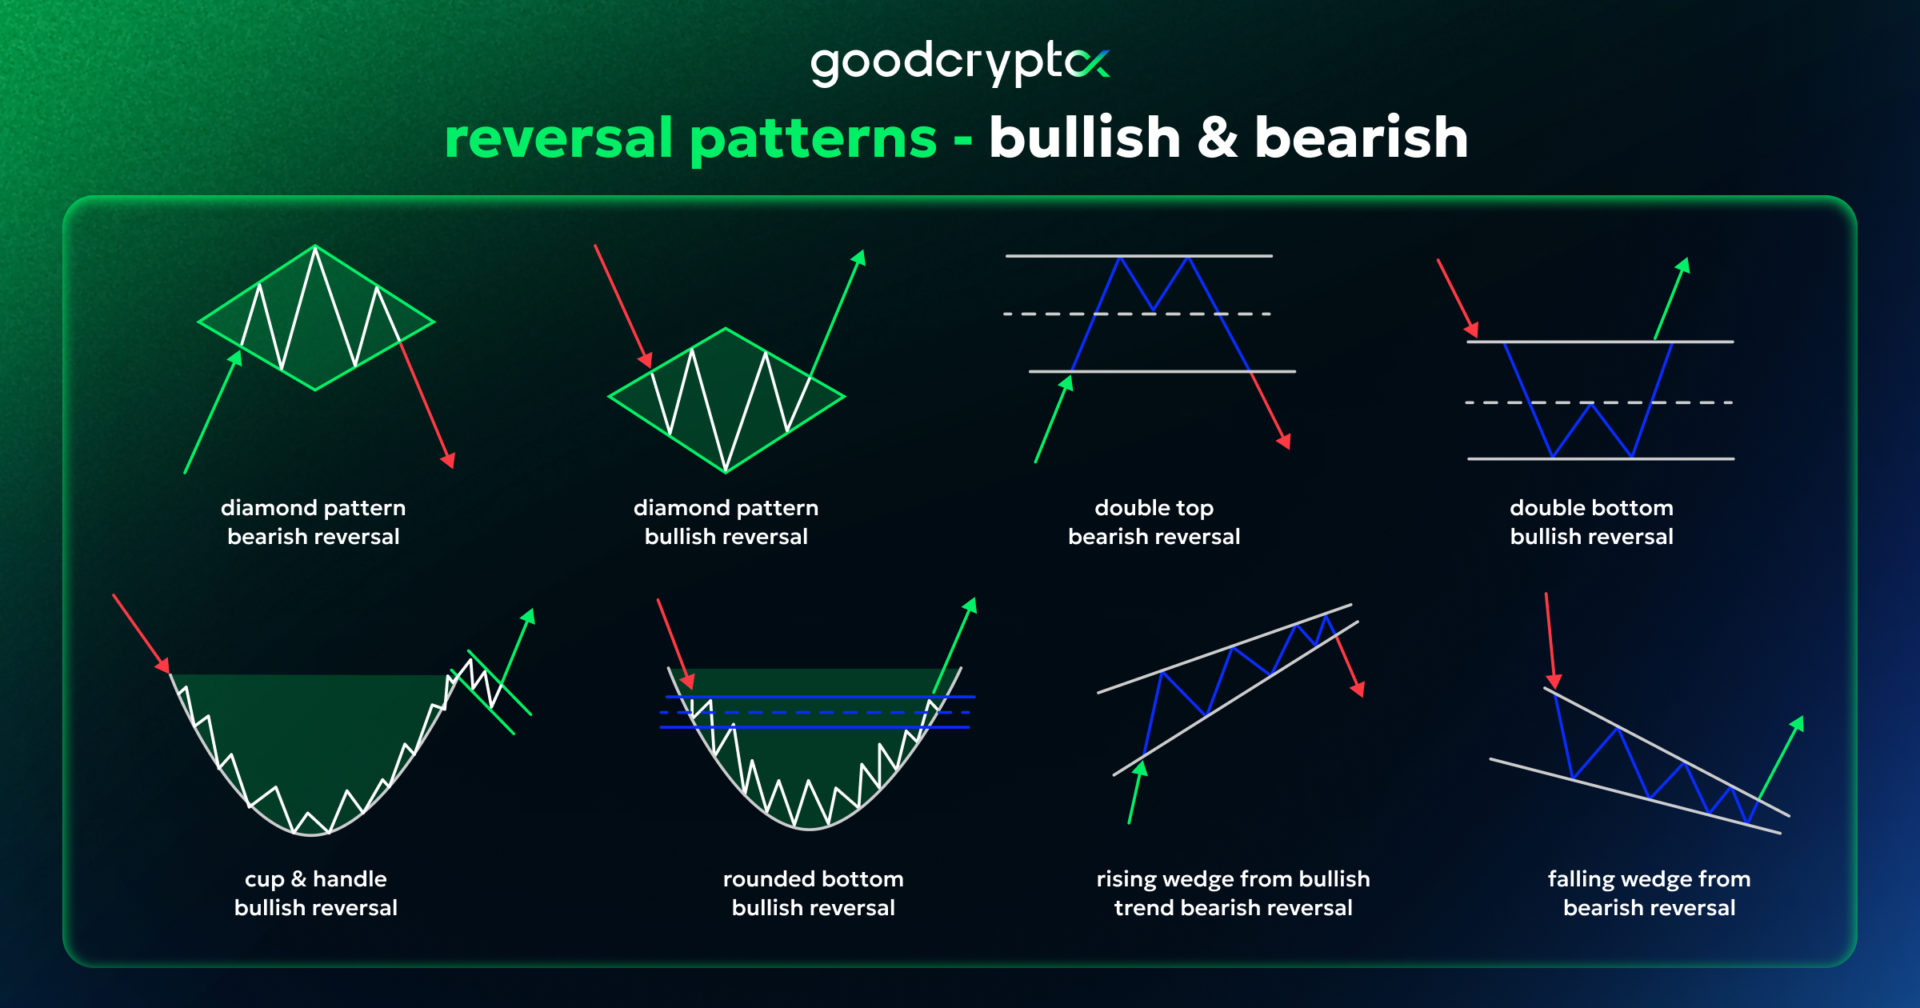
Detecting and trading reversal patterns are some of the best ways to make considerable profits. To help you quickly spot them, we created this trading patterns cheat sheet for quick visualization of these chart reversal patterns. Since we will cover a wide array of possible crypto day trading forecasting patterns, having a good overview will be essential.
Bullish and Bearish Continuation Patterns: How To Read and Use?
The second major type of pattern in a chart is the continuation pattern. As their name suggests, continuation candlestick patterns signal the continuation of a trend. Like with reversal patterns, trading trend continuation patterns can be applied to both bullish and bearish situations.
- Bullish continuation patterns help you to assess the continuation of price growth, providing you with buy signals.
- Bearish continuation patterns allow you to assess a continuation in the price decrease, providing you with sell signals.
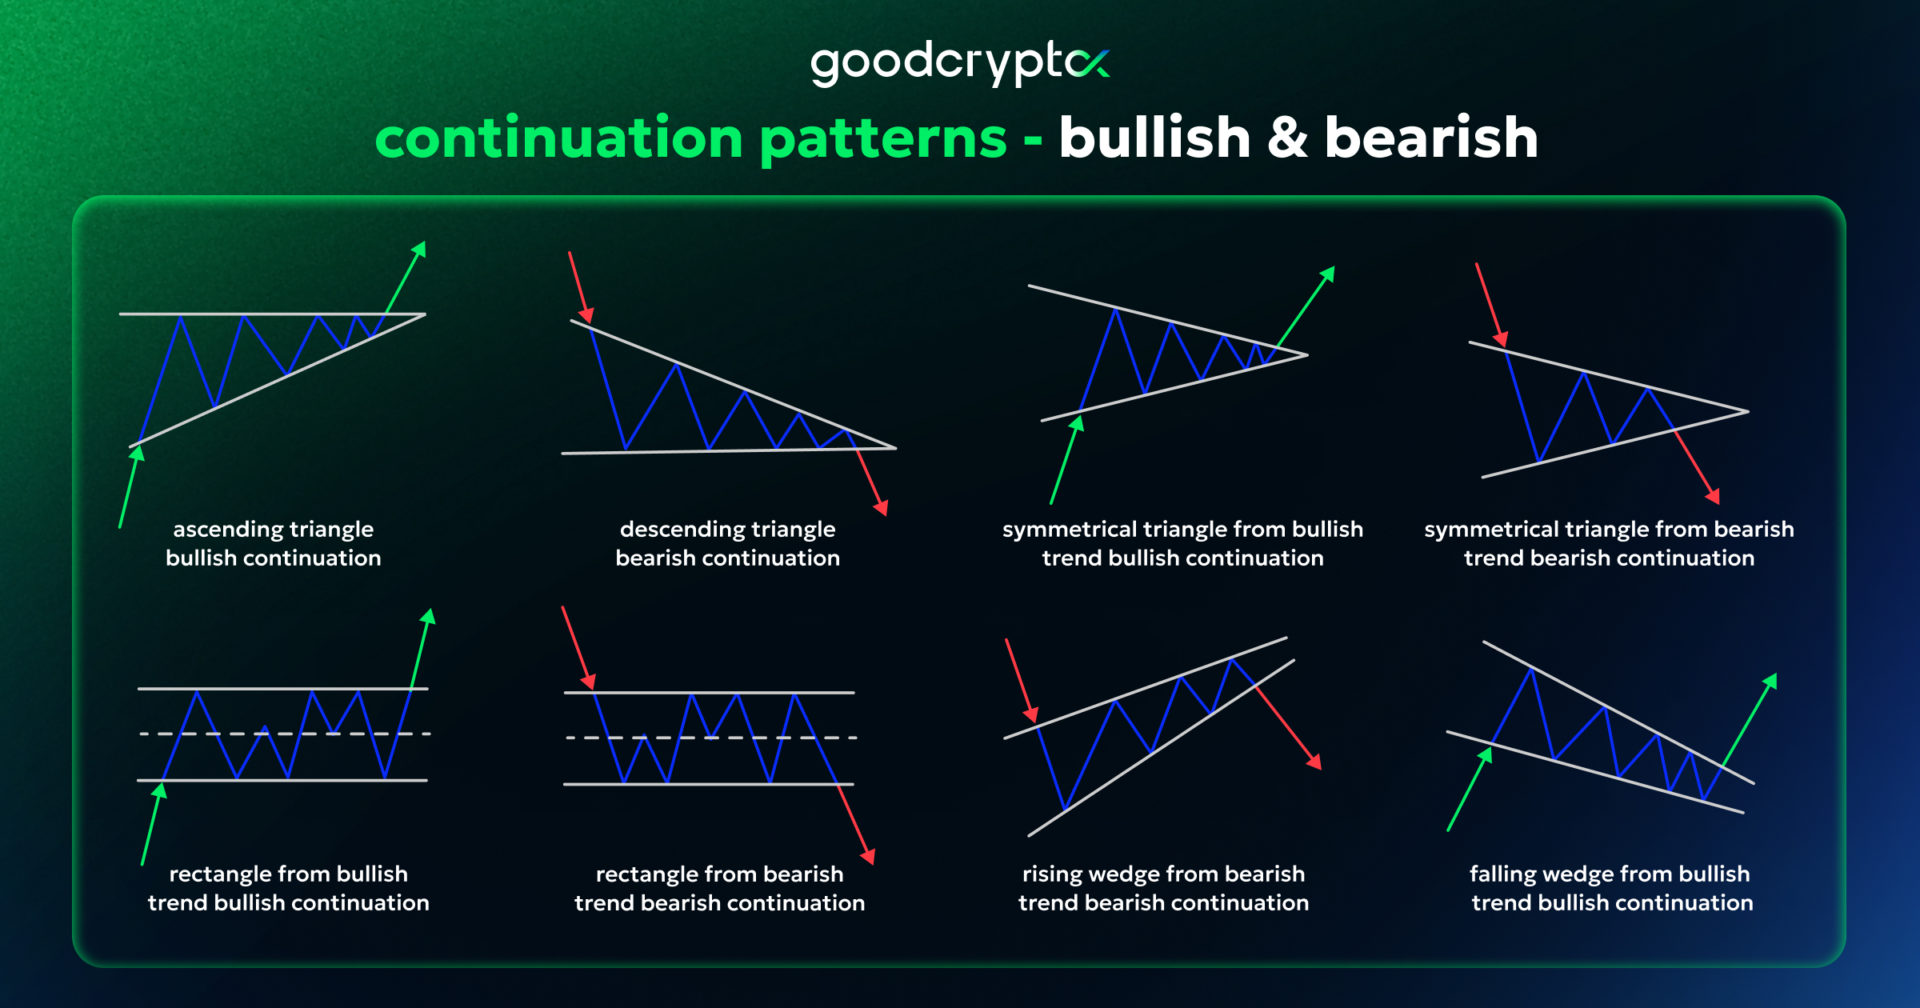
If you are still wondering what continuation patterns are, take a look at the following graphic that consolidates the most popular ones available.
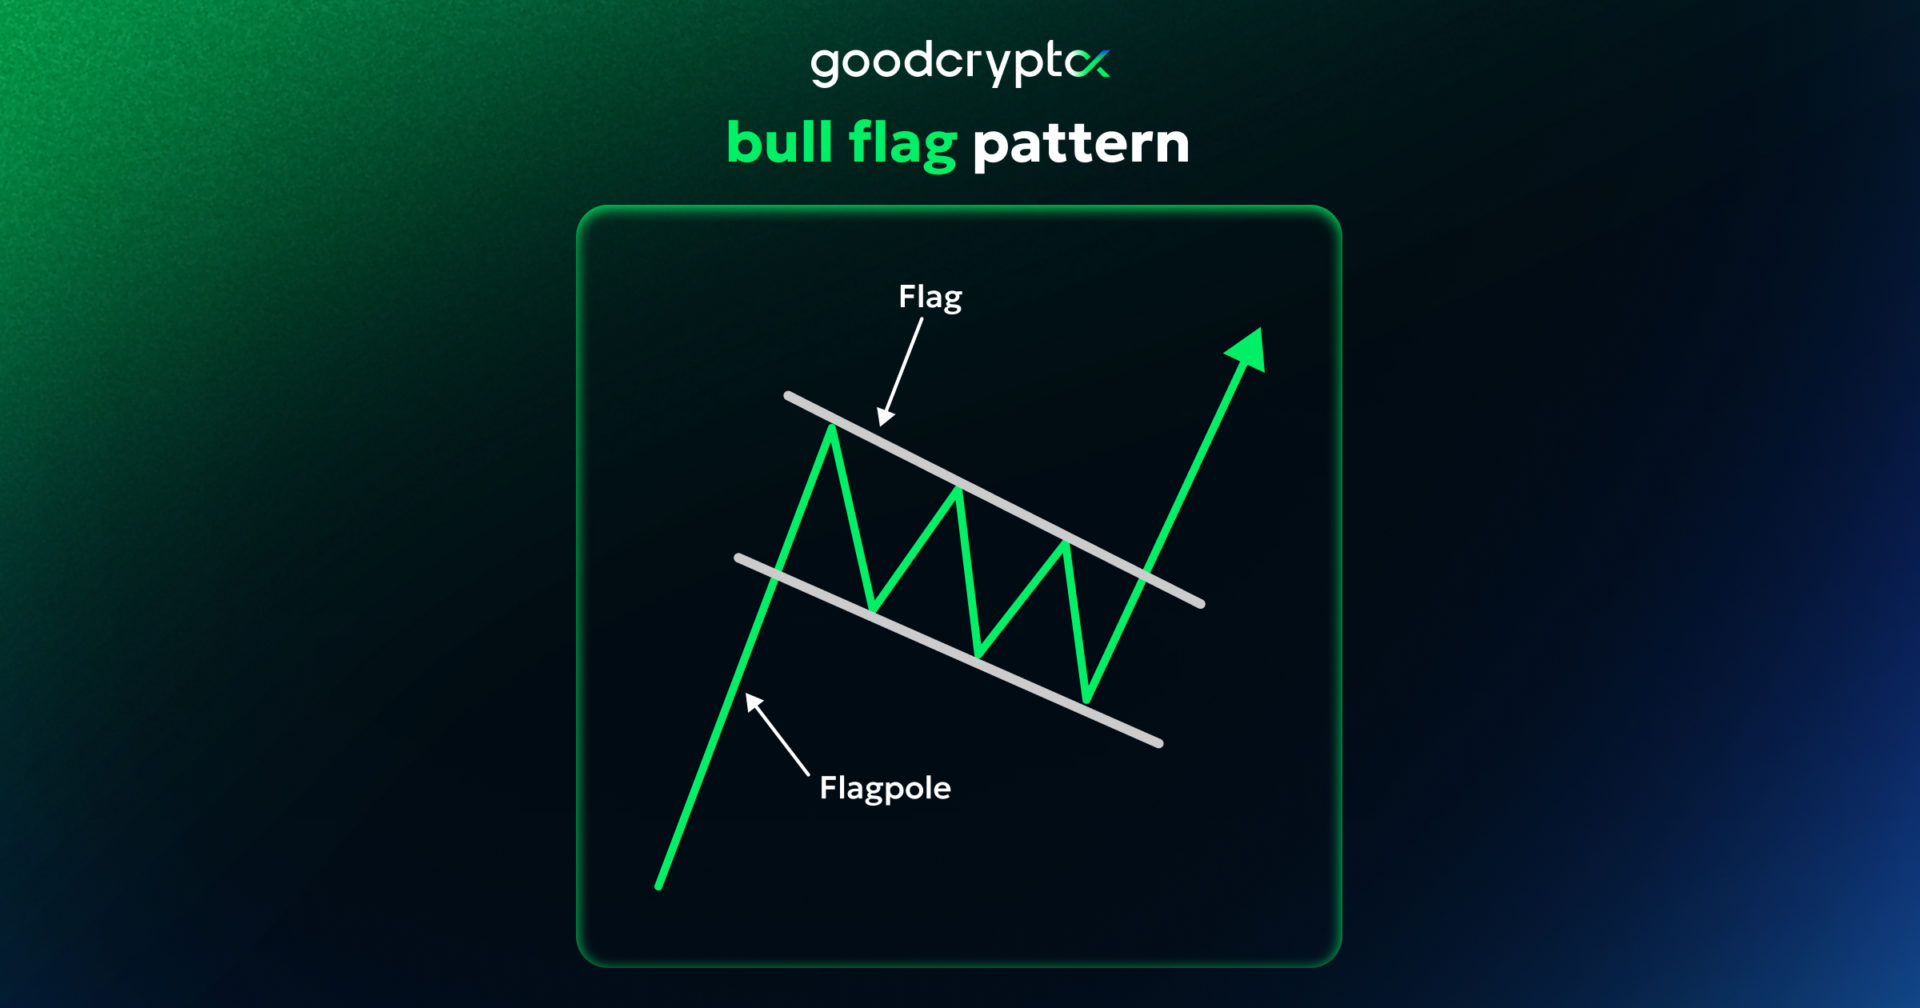
Bull Flag Pattern
The bullish flag pattern is a bullish continuation pattern that forms after a sharp price increase, known as the flagpole. What is a bull flag? It’s essentially a brief pause where the price consolidates in a narrow, slightly downward-sloping channel before continuing the prior uptrend.
This pause in the chart reflects short-term profit-taking rather than a true reversal. The bull flag meaning for traders is straightforward: it signals that buyers are likely to push the price higher once the consolidation channel breaks to the upside, with the flagpole’s length often used to project the next price target.
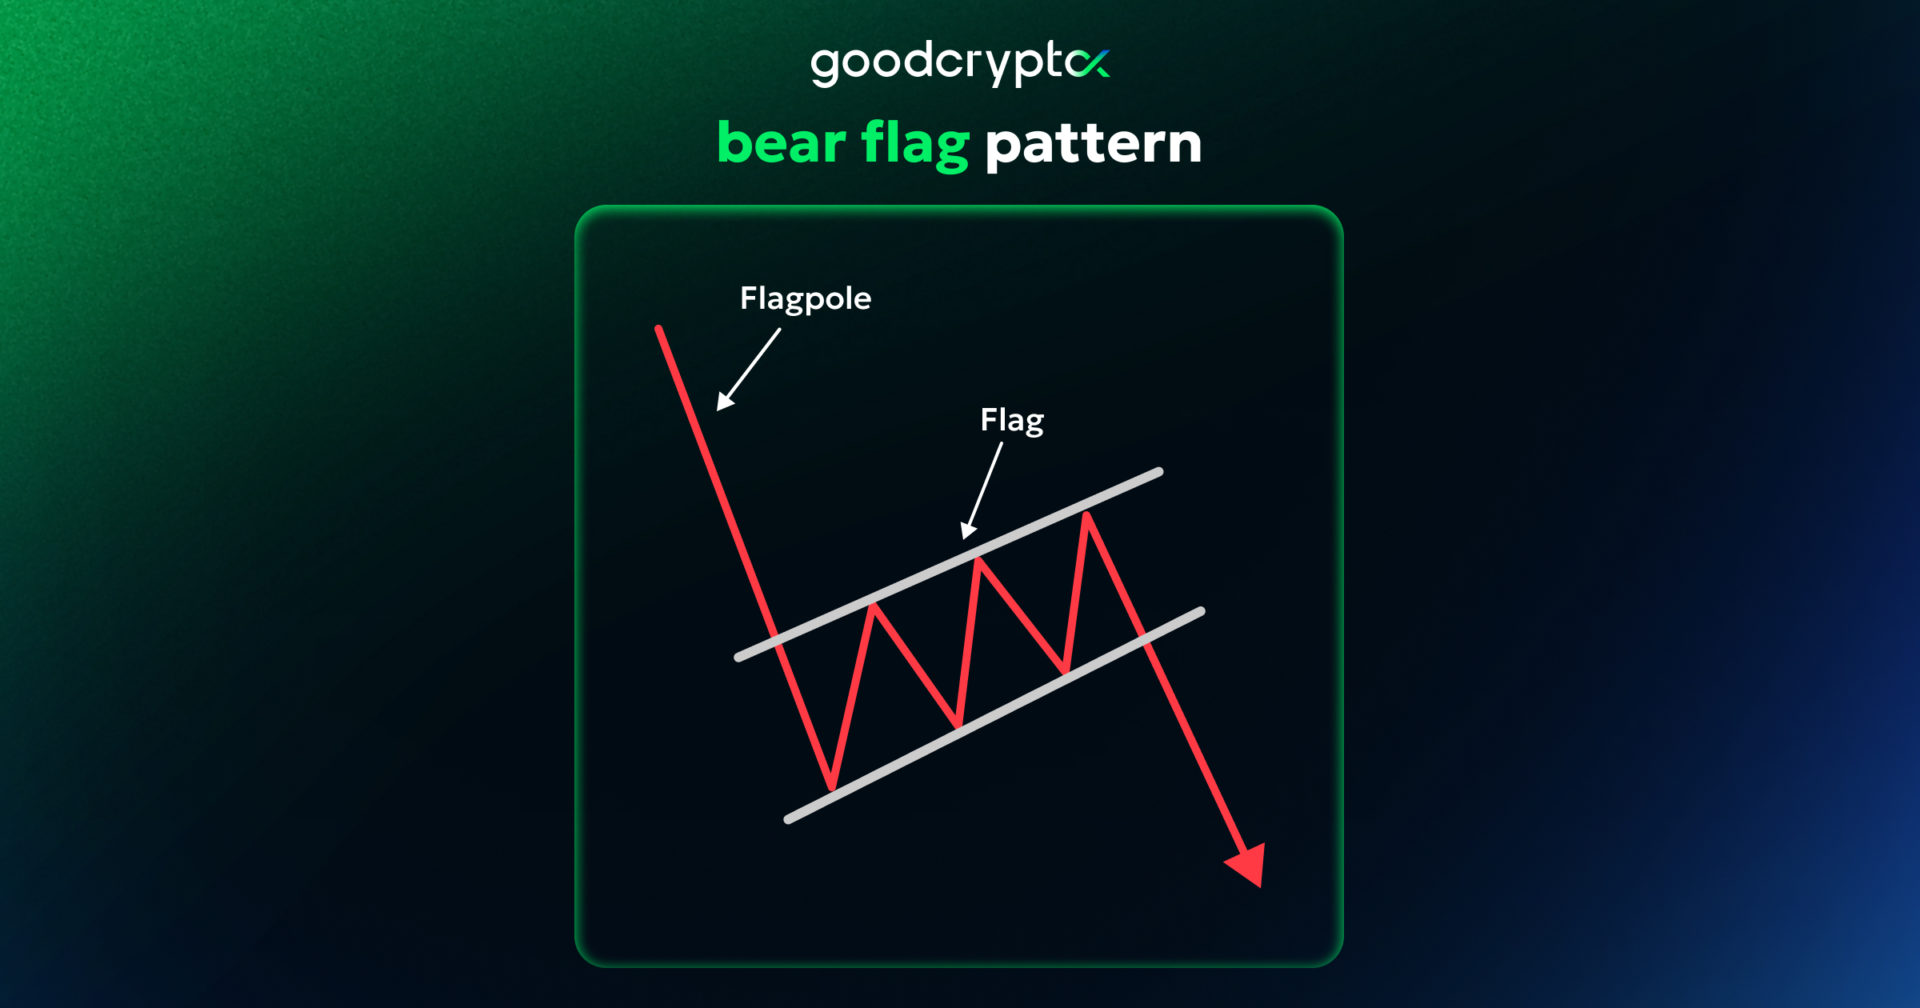
Bear Flag Pattern
The bearish flag pattern is the bearish counterpart to the bull flag, forming after a sharp price decline. The bear flag chart pattern consists of a steep drop (the flagpole) followed by a brief upward-sloping consolidation channel before the downtrend resumes.
When comparing bull flag vs bear flag, the key difference lies in the prevailing trend and the slope of the consolidation: bull flags slope downward within an uptrend, while bear flags slope upward within a downtrend. Both serve the same purpose technically, signaling that the dominant trend is likely to continue once the channel breaks in the trend’s original direction.
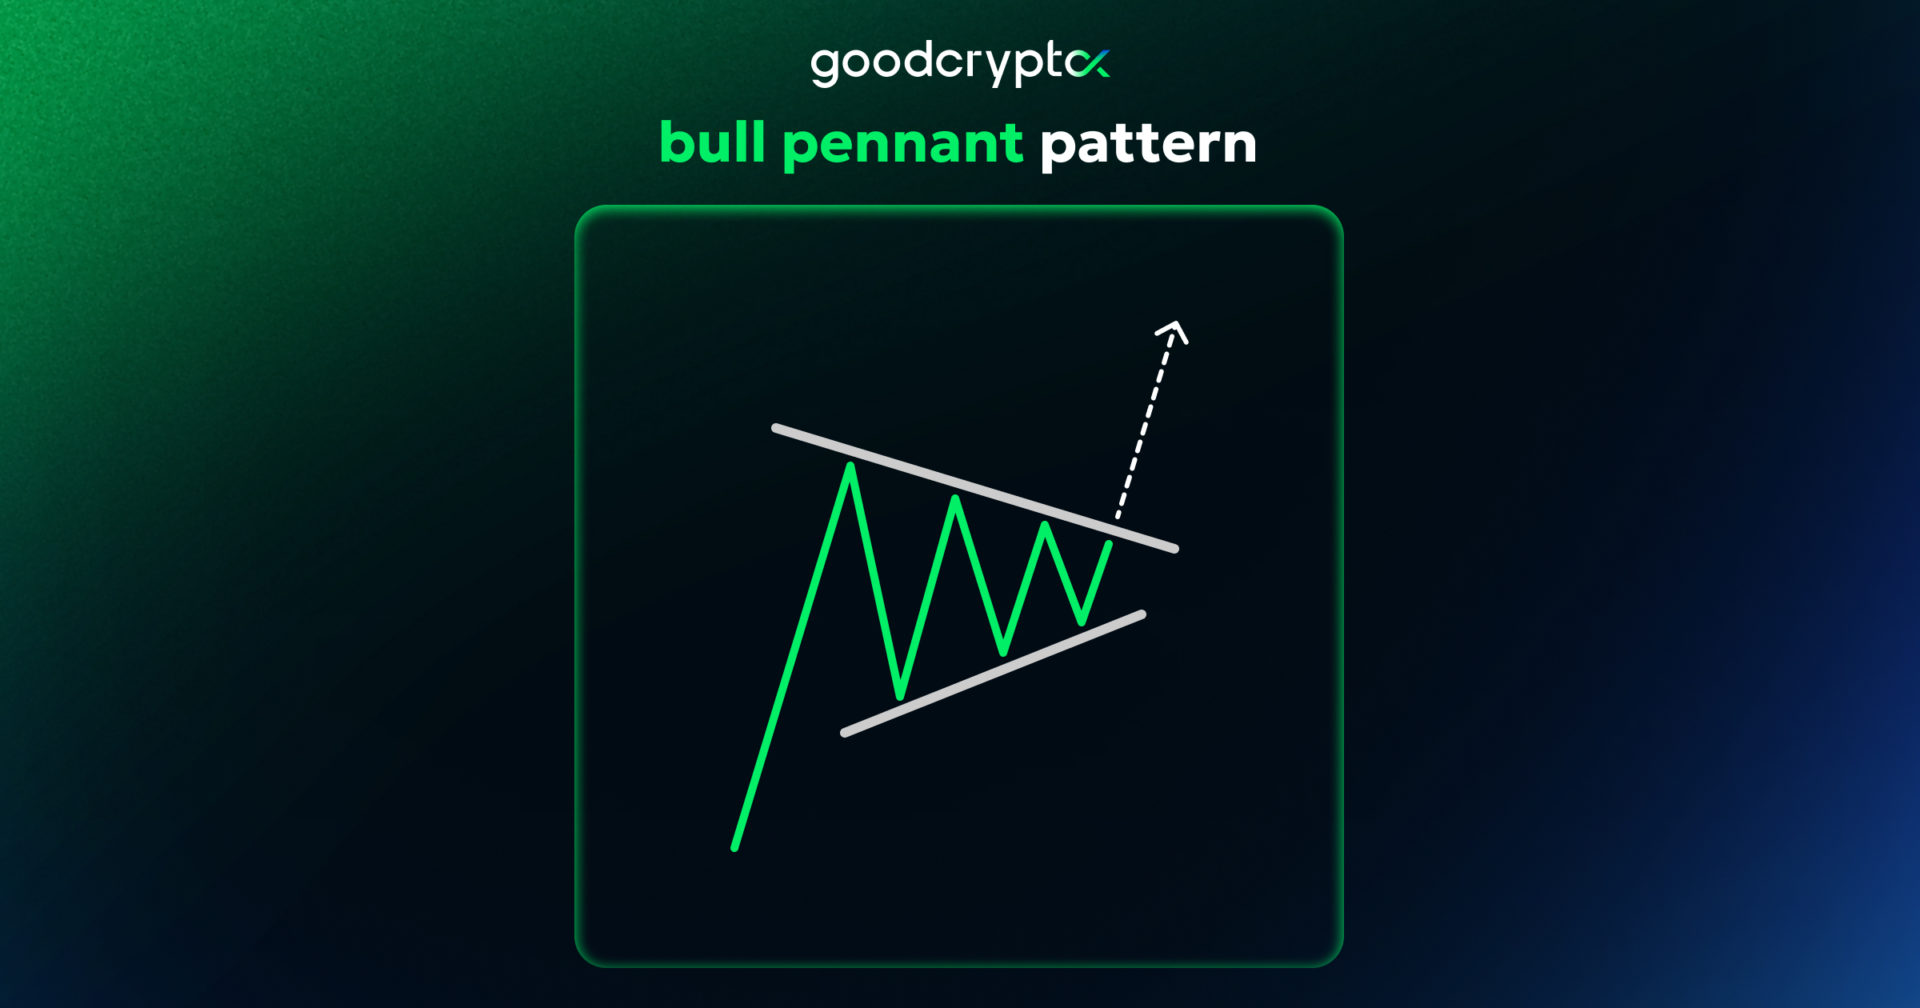
Bull Pennant Pattern
The bull pennant is another continuation pattern that, like the bull flag, follows a sharp price increase. However, instead of a parallel channel, the bullish pennant pattern forms a small symmetrical triangle as the price consolidates, with converging trendlines reflecting decreasing volatility. This pennant pattern trading setup typically resolves with a bull pennant breakout to the upside, continuing the original bullish move.
In pennant pattern technical analysis, traders pay close attention to volume during the bull pennant formation, since contracting volume during the consolidation, followed by a volume spike on breakout, adds confidence to the signal.
Bear Pennant Pattern
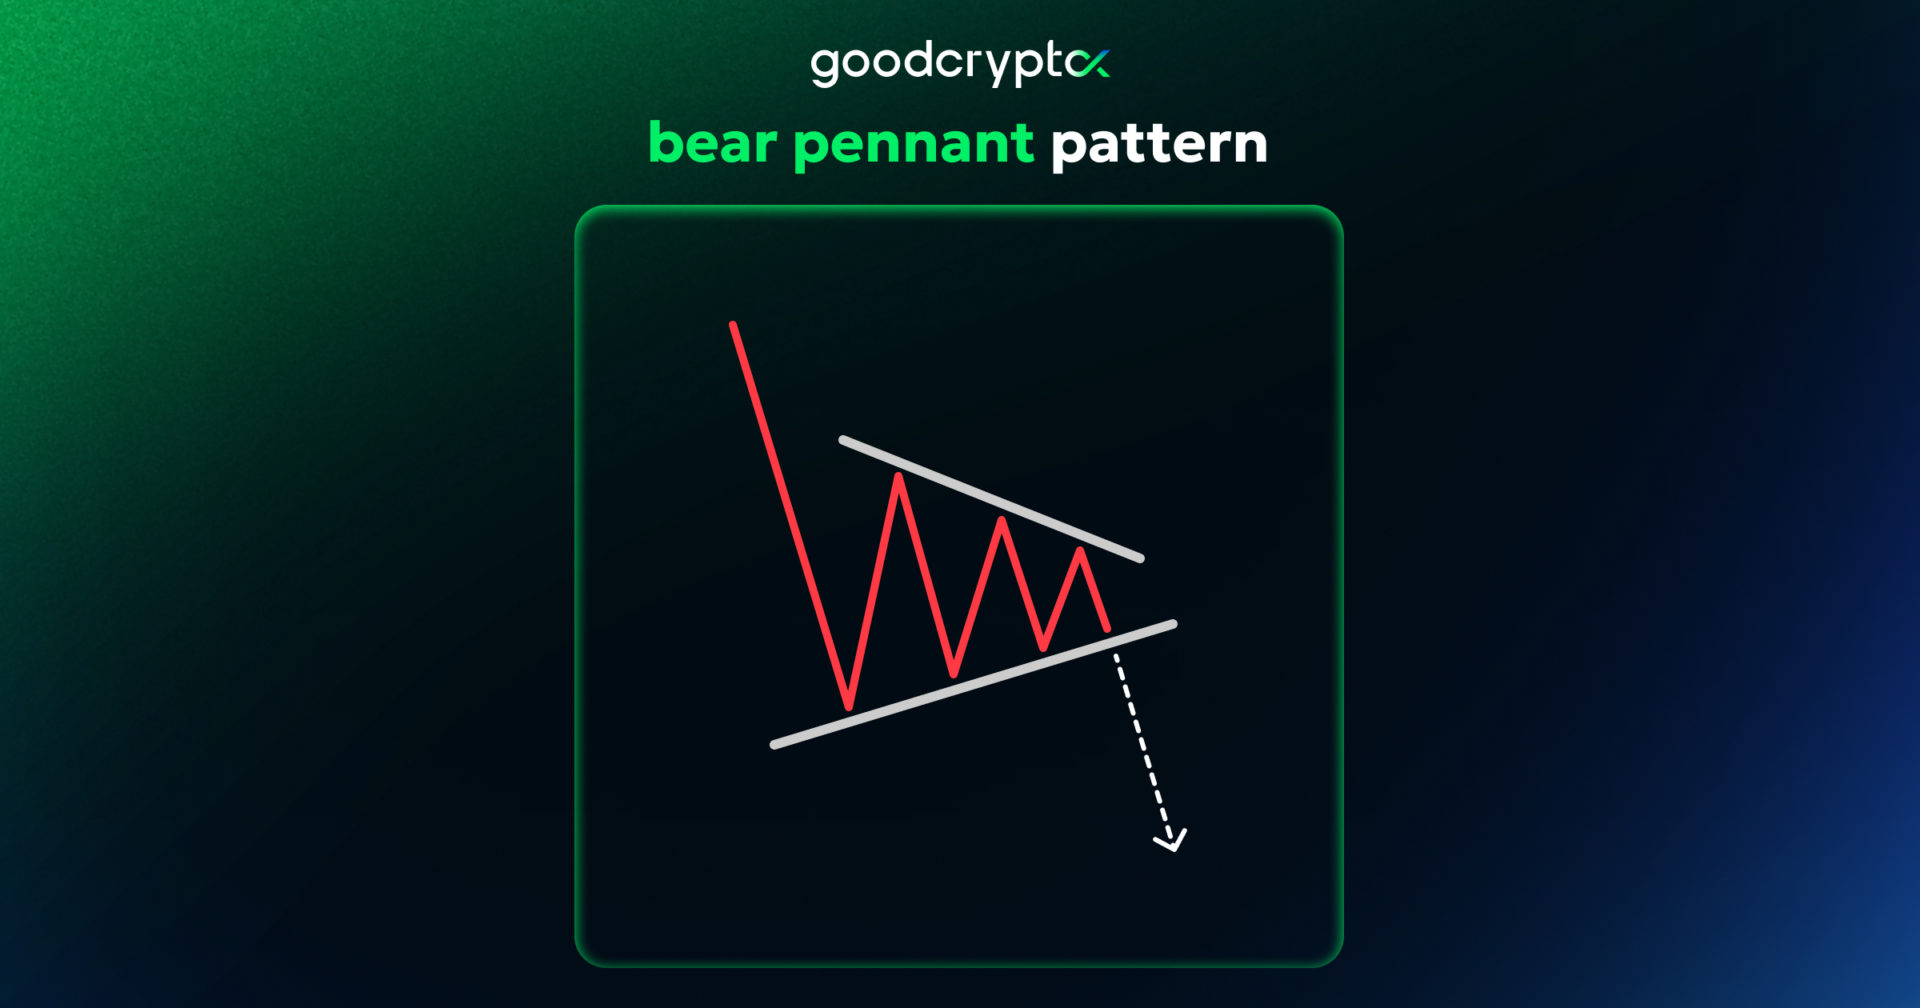
The bear pennant mirrors the bull pennant but appears within a downtrend. After a sharp decline, the bearish pennant pattern forms a small converging triangle before the price typically breaks downward, continuing the bearish move.
Like other flag patterns, the bear pennant relies on the preceding sharp move (the flagpole) to gauge the strength and likely extent of the move following the breakout. A bearish pennant breakout is generally confirmed with increased volume, giving traders a sell signal in line with the prevailing downtrend.
How to Setup and Draw Crypto Chart Patterns? Exemplified by goodcryptoX App
Now that you have some basic knowledge on how to identify patterns on a currency trading chart, let’s dig into some trade pattern examples using our app.
Our goodcryptoX app offers all the necessary tools on how to find patterns in day trading charts. It’s the perfect app for pattern trading as it provides a wide array of versatile tools for drawing a pattern in a chart. In this section, we provide you with the necessary knowledge on how to look at patterns for trading and use goodcryptoX to draw your own.
To this end, let’s take a look at a practical example of using the technical analysis pattern chart.
Setting up the goodcryptoX App
This simple step-by-step guide will help you learn how to use chart patterns in practice.
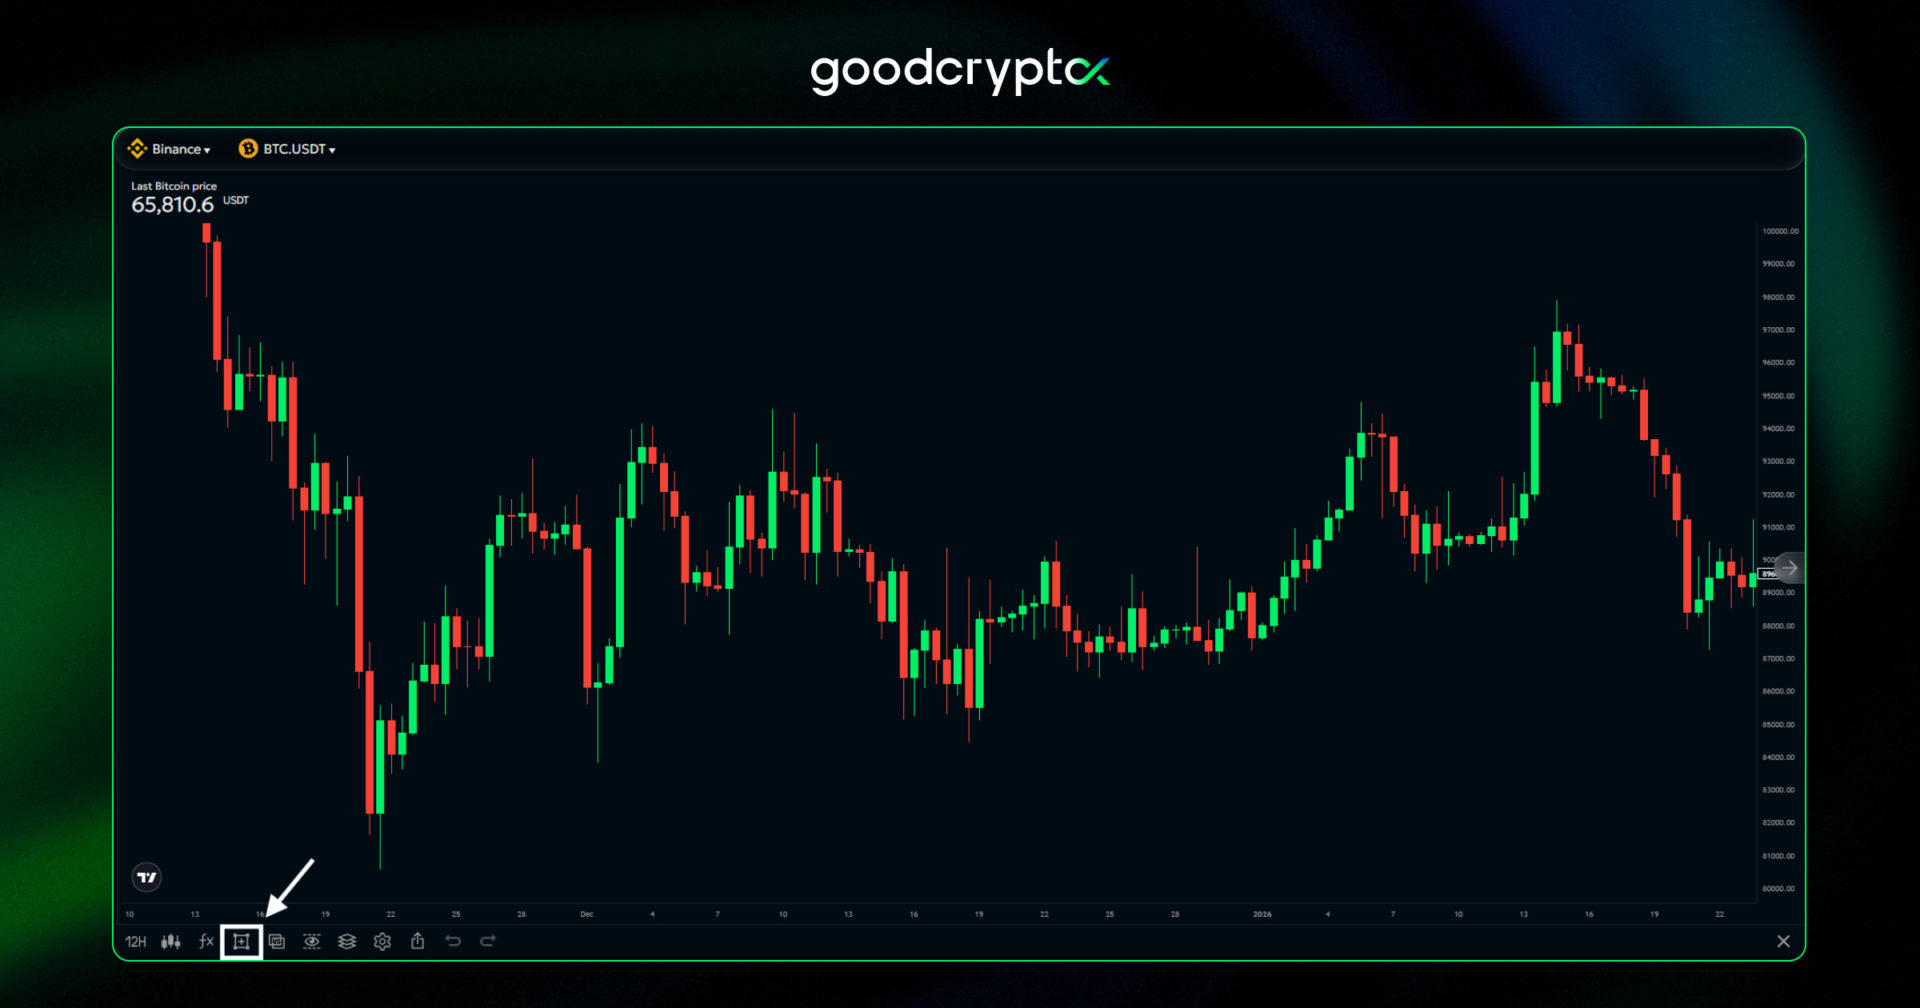
- First, let’s start by opening the goodcryptoX app. Then, activate the drawing tools by clicking on the corresponding icon (square with a cross in the middle).
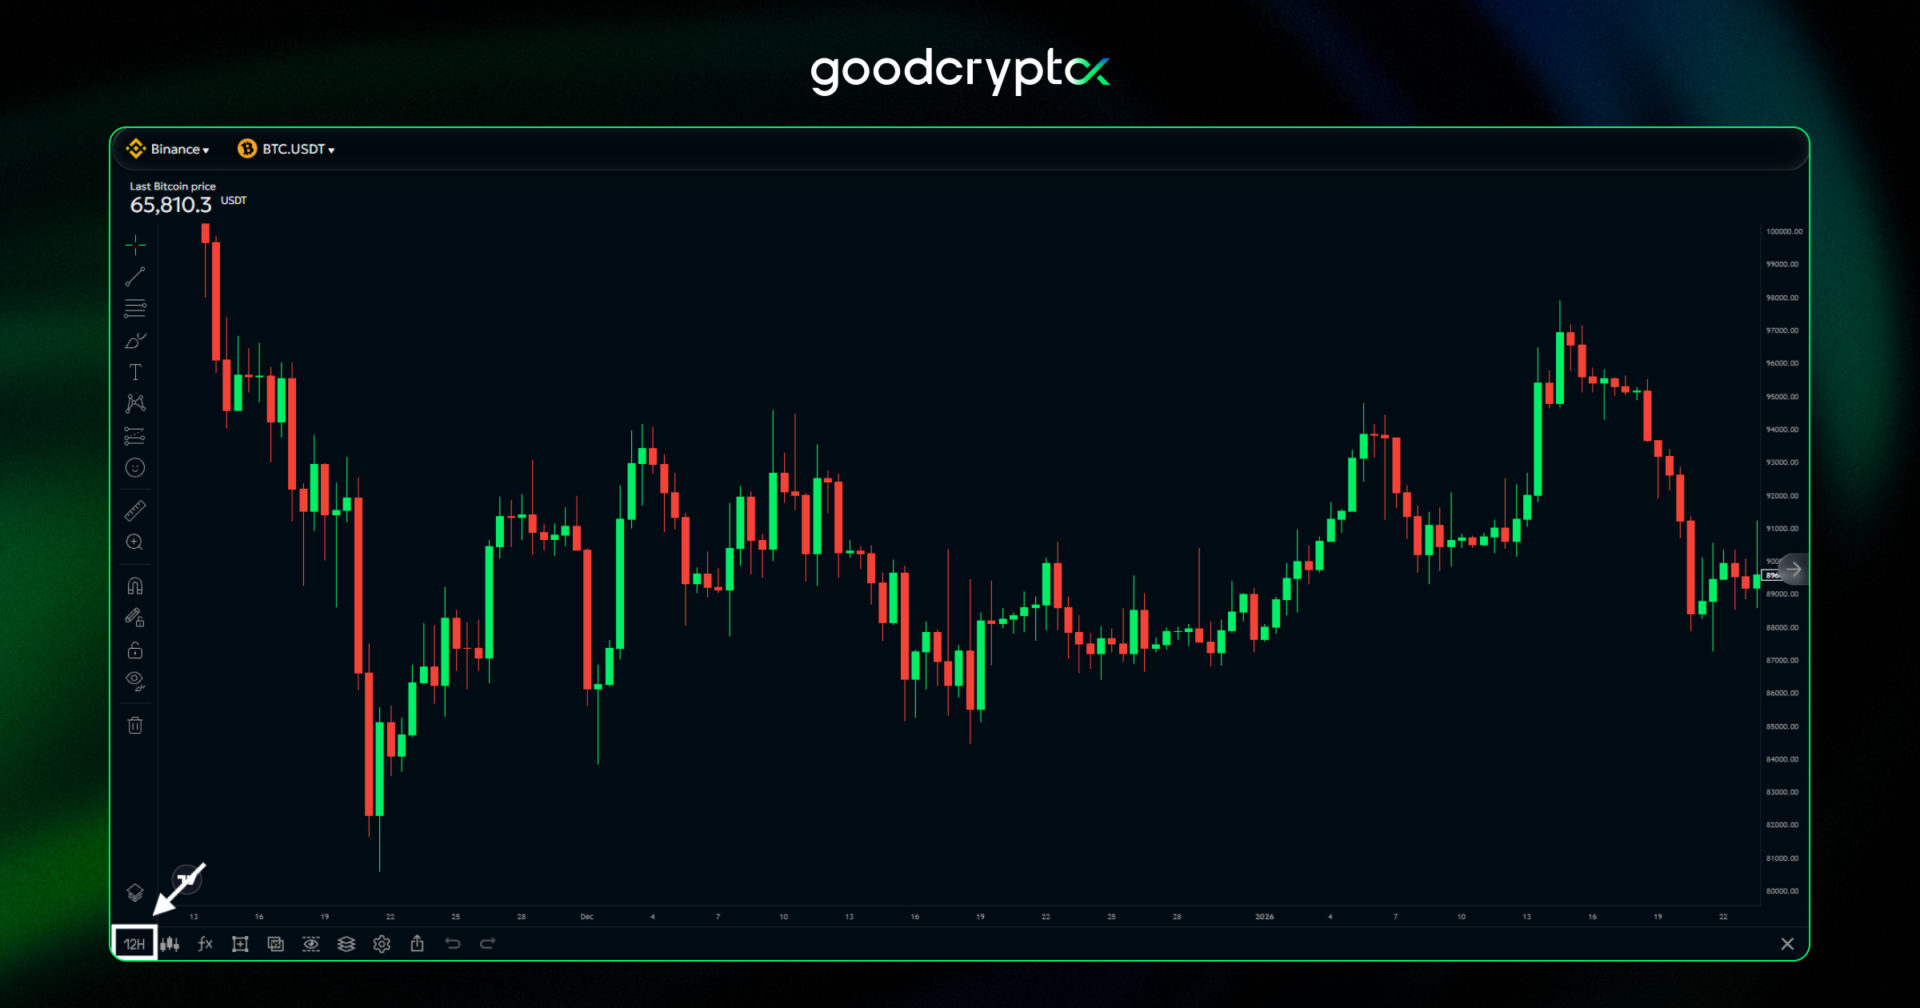
- Next, click on the timeframe icon and select your trading interval. We went with 12 hour candles in this example.
Before you start identifying patterns on live charts, make sure to download our FREE Crypto Chart Patterns PDF guide. It contains all the major bullish, bearish, reversal, and continuation patterns covered in this article, making it easier to recognize them while trading.
Keep the PDF open on a second screen or save it on your device for quick reference. As you analyze charts in goodcryptoX, simply compare what you see with the examples in the guide to identify patterns faster and with greater confidence.
Now, let’s move on to detecting and drawing chart patterns directly on the chart.
Detecting and Drawing Patterns
In this instance, we will be using trend lines to draw our trading patterns. While the app contains a specific tool for patterns, these are advanced chart patterns that we won’t be covering in this article.
- Select the trend line tool and try spotting a pattern in your favorite crypto chart. If you are having trouble identifying chart patterns, use the list of examples of chart patterns we provided earlier in this article.
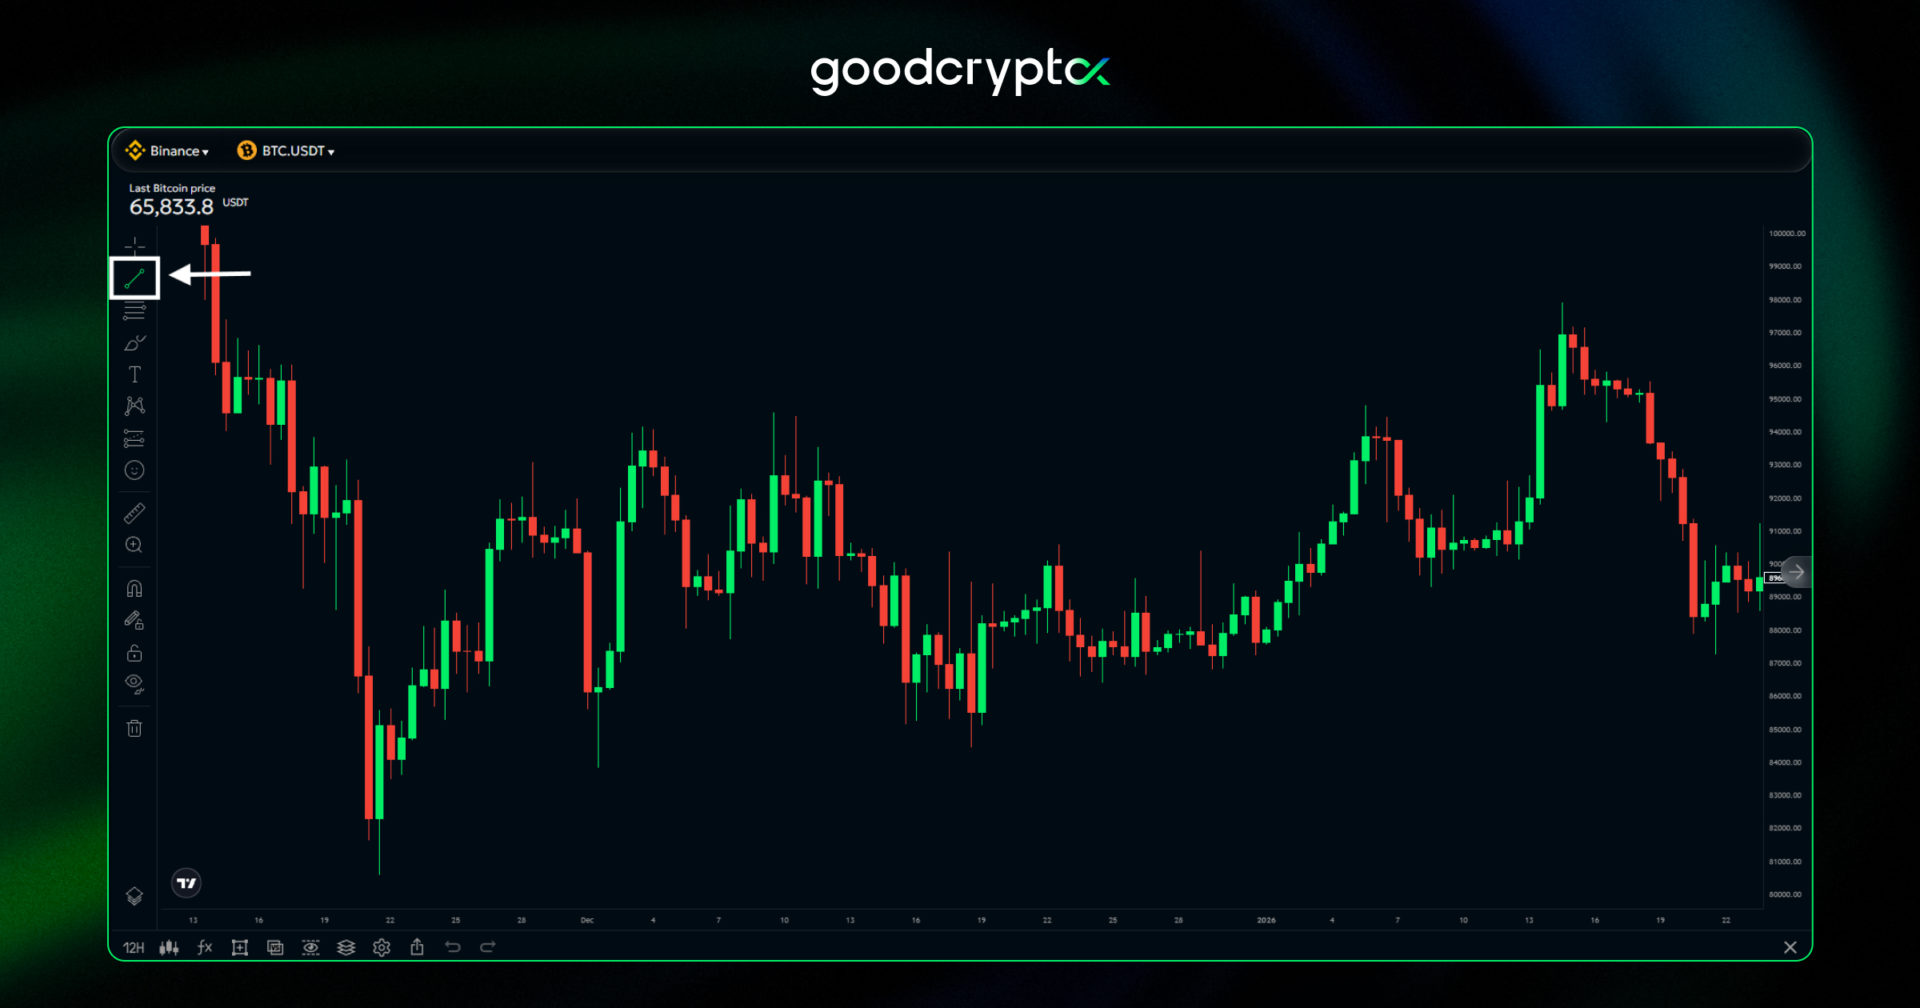
- Draw trendlines to outline the pattern on the chart. In our example, we detected a falling wedge pattern. To do this, click on the top of the trend and drag it to its end, making sure your line isn’t cutting any candles.
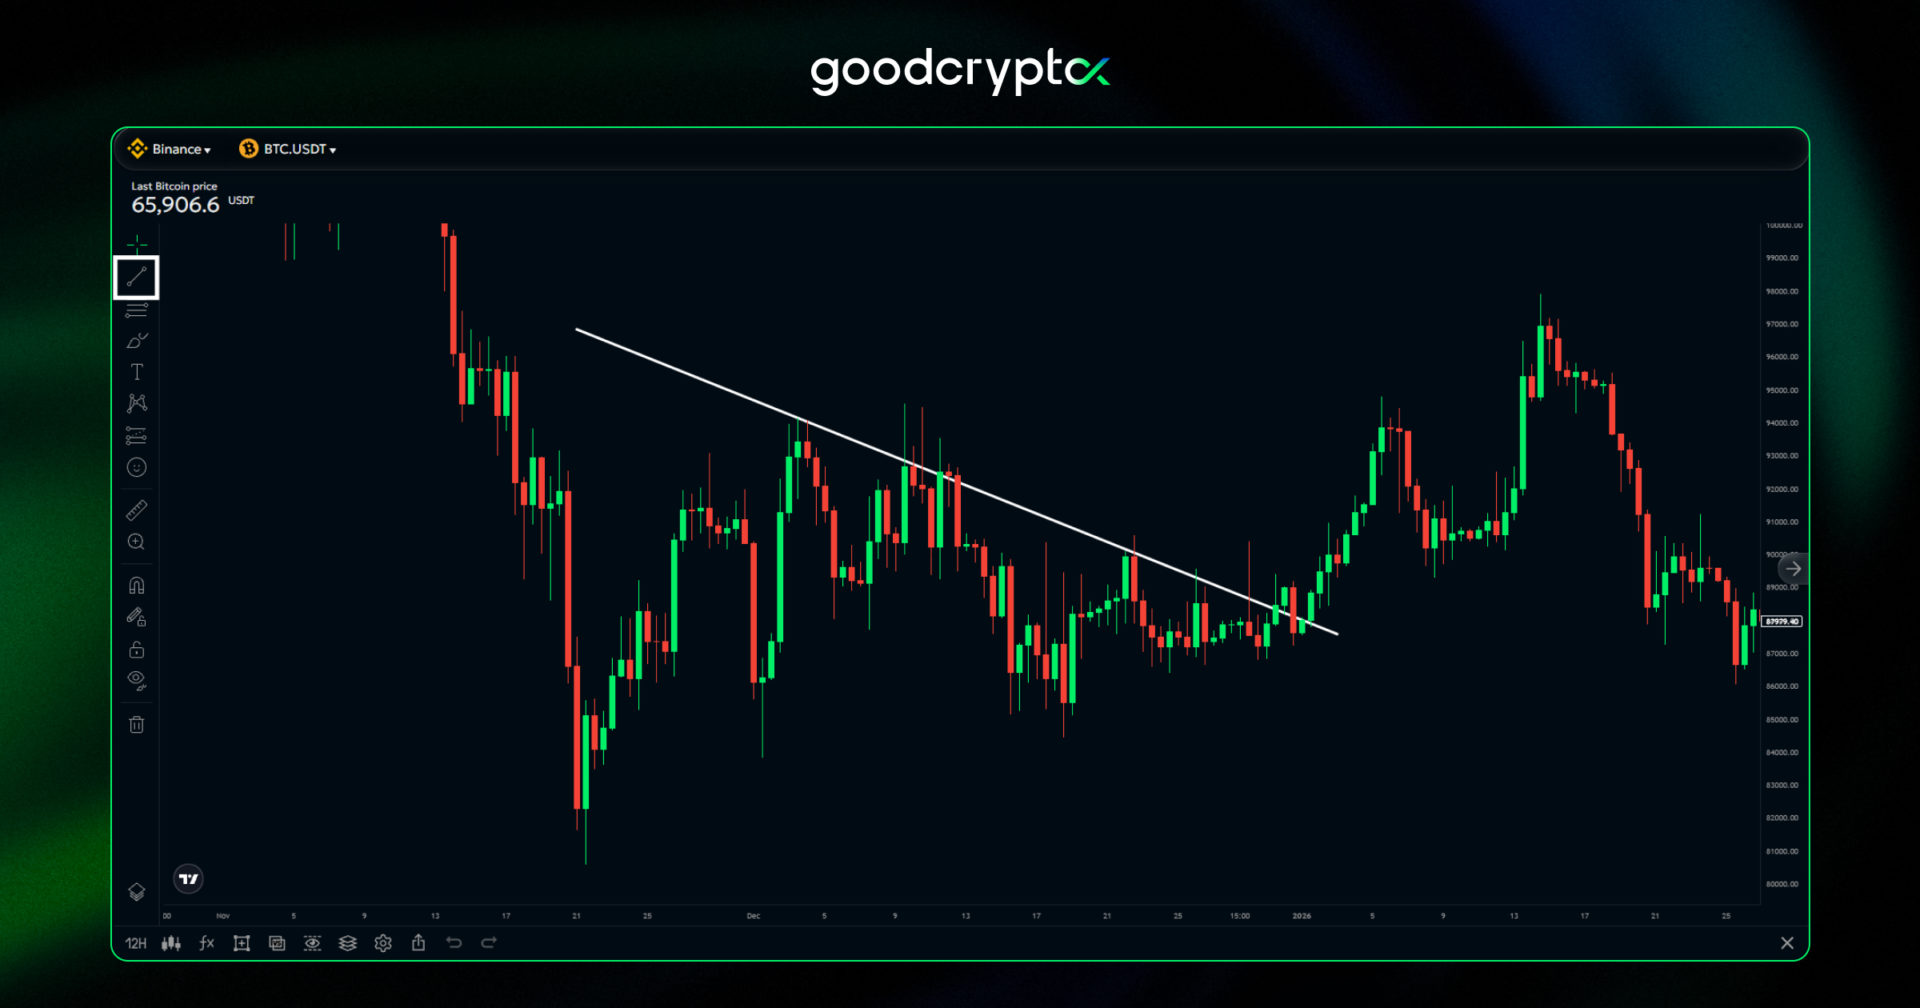
- Repeat the process to form the bottom of your falling wedge trading pattern.
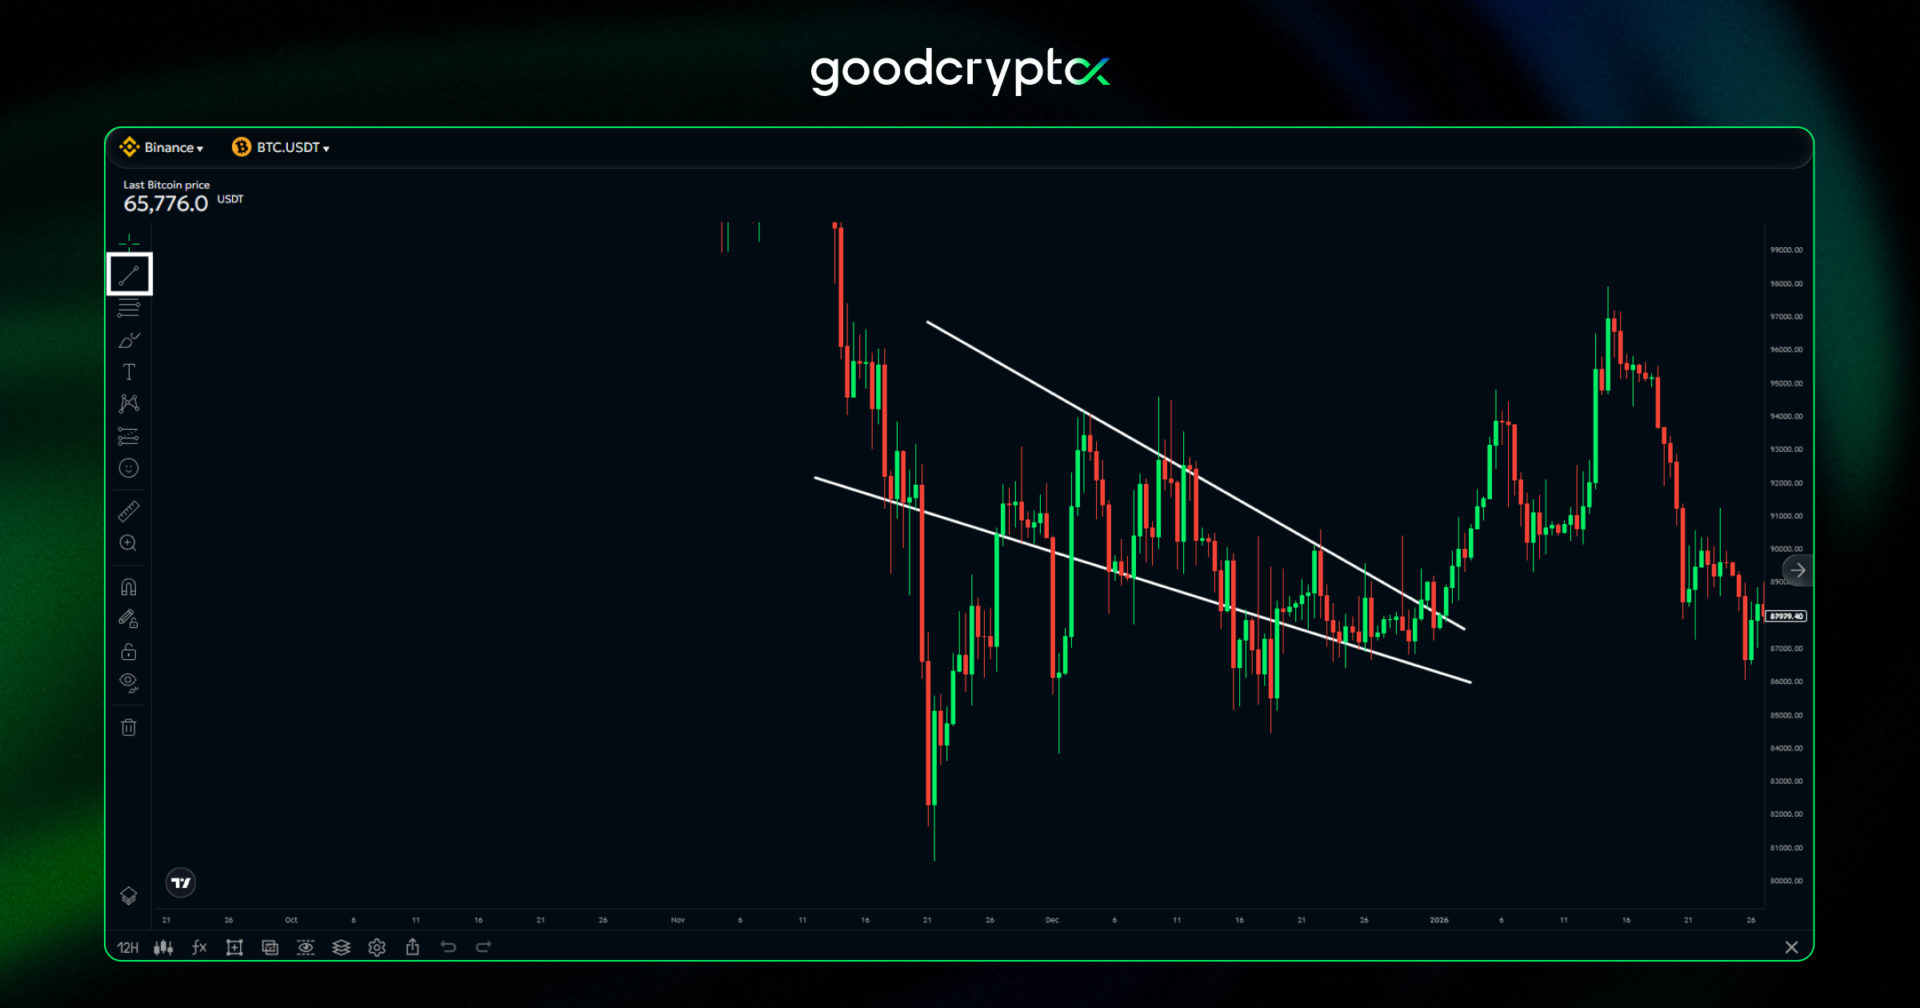
- We can note a breakout to the upside, signaling a buy zone and a bullish continuation of the macro trend.
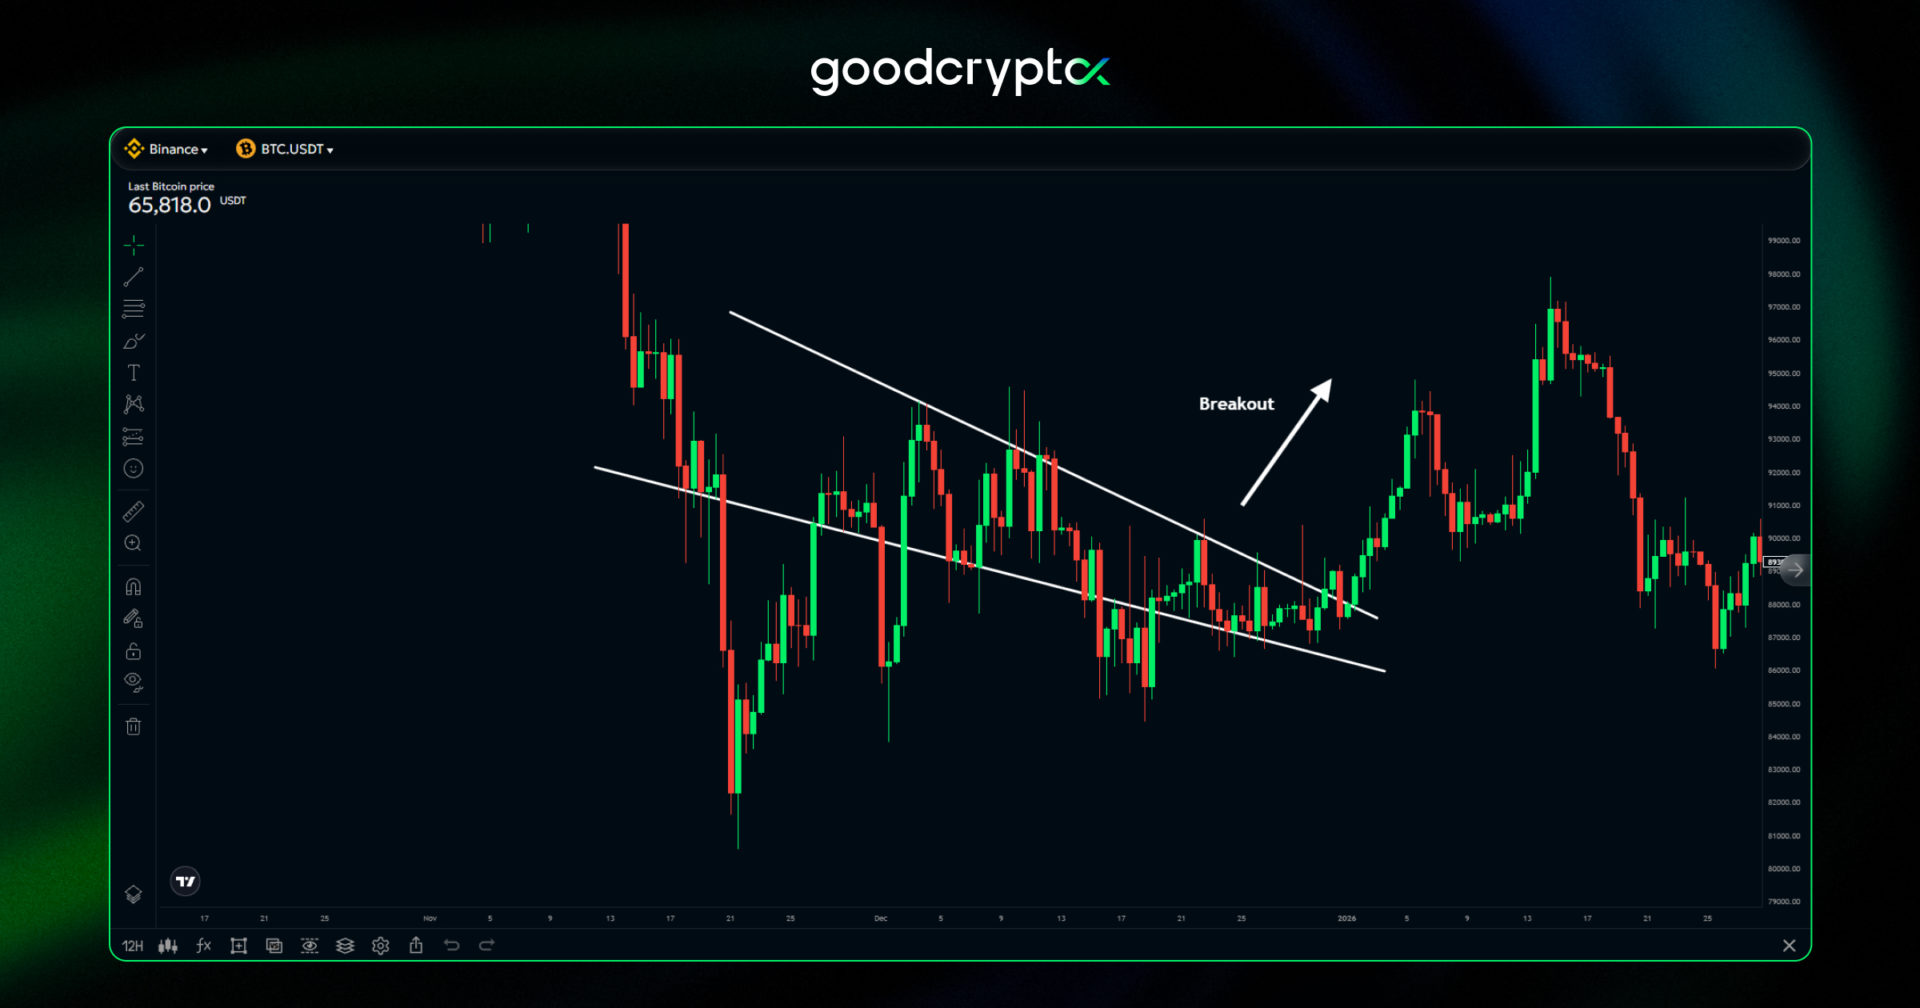
You can use this drawing technique for all of the chart patterns types in this article. With those basics out of the way, let’s take a look at some particular examples of chart patterns that you can use daily. The following chapters will delve into detail on how to predict chart patterns and apply them to your technical analysis.
Crypto Triangle Pattern In Trading Strategy: Use Cases
The first major chart pattern on our list is the triangle pattern. Experts consider triangle chart patterns as continuation patterns that further confirm the bullish or bearish trends. Triangle trading is best used to double down on a short or long position, helping you increase profits considerably.
The triangle chart pattern shows a reduction in price volatility and hints at a possible breakout at its end. When they run their course until the end of the triangle, they signal strong trend continuation.
However, if you are asking yourself how reliable triangle chart patterns are, you should understand that these patterns aren’t set in stone. If they are invalidated before completion (candles break out of the pattern triangle), they can signal a trend reversal, instead of a continuation.
To understand exactly what a triangle chart pattern is and how to use them, let’s familiarize you with the three types of triangle chart patterns: the ascending, descending, and symmetrical triangle patterns.
Ascending Triangle Pattern
The ascending triangle pattern is a continuation pattern that signals a continuation of a bullish trend. The ascending triangle is formed by at least two higher lows and two linear highs and comes from a macro uptrend. Consequently, an ascending triangle breakout means that the general uptrend is resumed, with a considerable increase in price and volume.
In a bullish ascending triangle, the crypto price goes up and meets a resistance level at the top. The resistance levels in the ascending triangle chart are at equal levels, while the lows get higher over time. These higher lows in the triangle ascending pattern suggest that momentum is building and could push the price through the resistance.
Ascending Triangle Pattern Trading Strategy Examples
So, what is a triangle pattern in technical analysis? Let’s answer this question by providing a practical example of an ascending triangle chart pattern in the goodcryptoX app. This should give you a good idea of price targets that will help you with trading ascending triangle strategies.
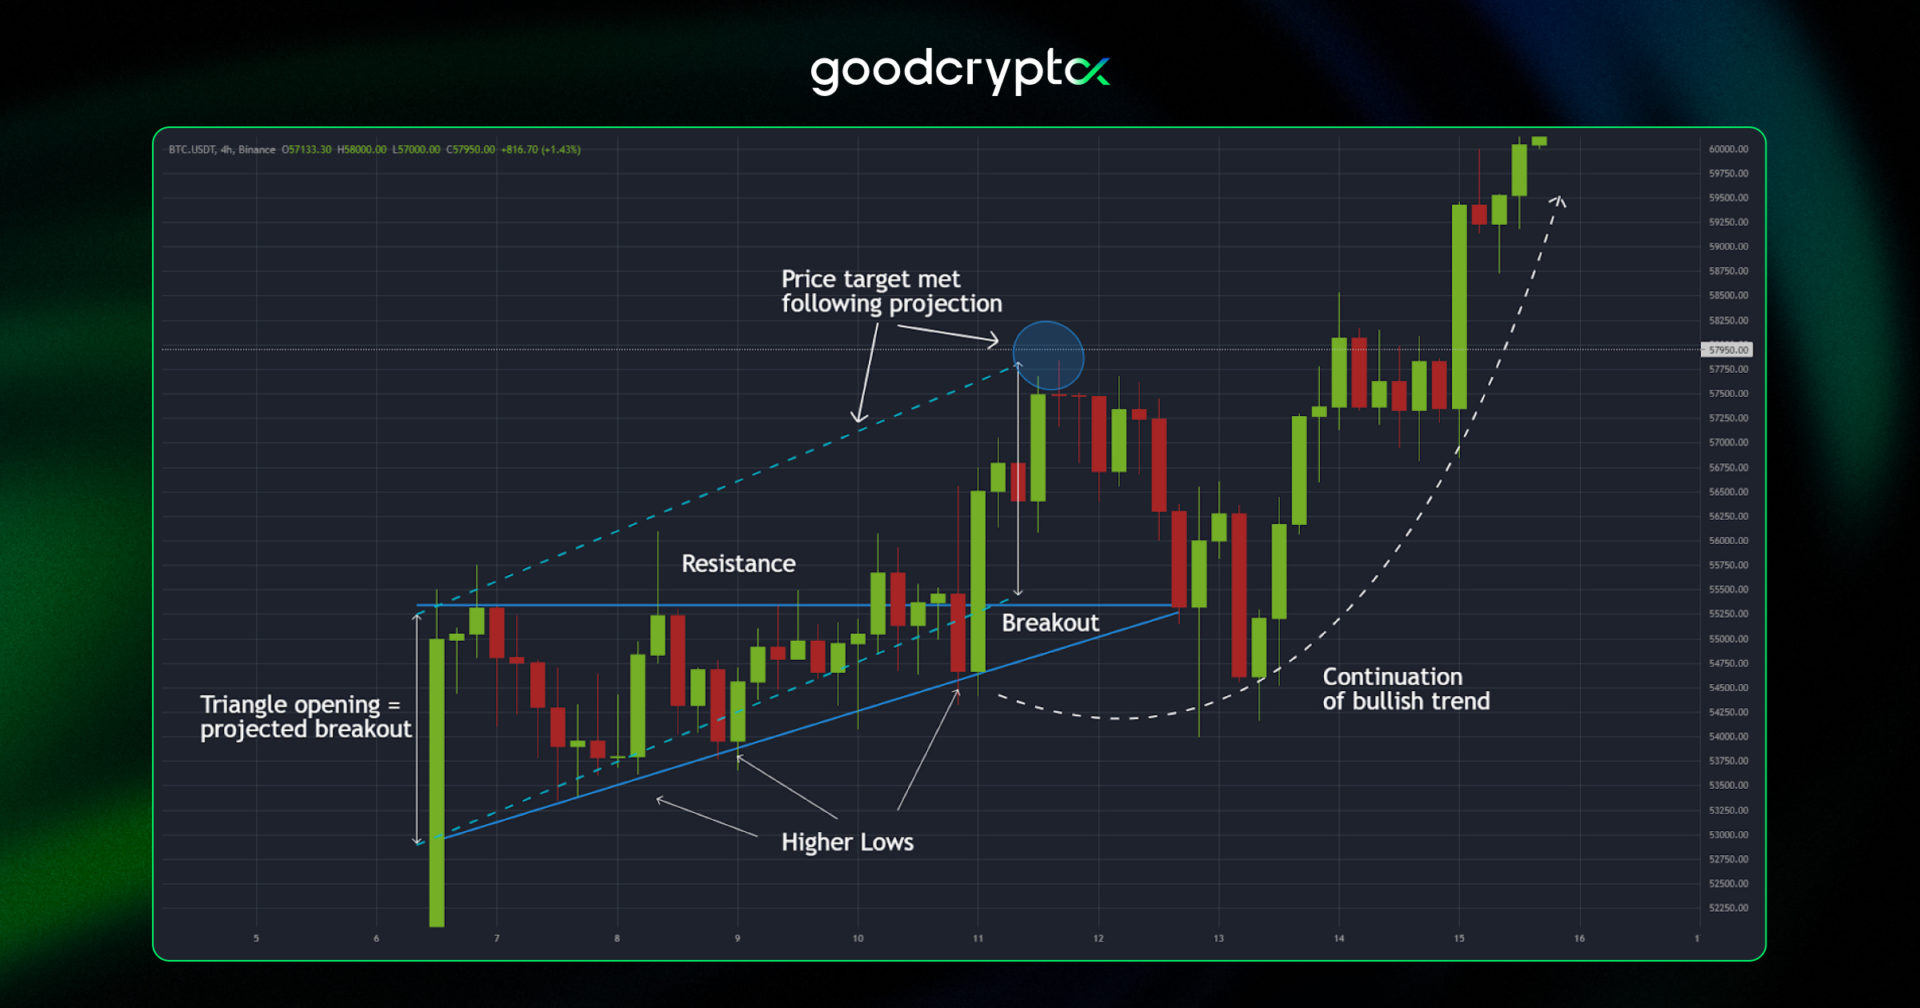
In the example above, we can see the bullish ascending triangle that results in a trend continuation. The candles are making higher lows, while the resistance remains linear.
You can use the opening of the ascending triangle as a projection price target for the breakout. In our example, the price difference at the crypto triangle pattern opening is ~$2000.
Once the price breaks out of the bullish ascending triangle, taking profit at ~$2000 above the breakout ensures maximizing profits before an eventual price downturn. This is the most basic example of ascending triangle trading.
Descending Triangle Pattern: Bullish and Bearish
The descending triangle is the second type of triangle pattern trading that signals a bearish trend continuation. This descending triangle pattern originates from a bearish trend where the price finds linear support and trends horizontally, forming lower highs.
The lower highs slowly build momentum, which leads to the descending triangle breakout and a considerable price decrease at the pattern completion. A bearish descending triangle is almost always resolved in a bearish breakdown and signals that interest in that particular crypto is weakening with traders.
Consequently, you can use the descending triangle chart pattern for shorting targets or finding the next buy zone at the end of the price projection. Let’s see how this is done in practice.
Descending Triangle Pattern Trading Strategy Examples: Bullish and Bearish
The following trading strategy will help you detect a crypto descending triangle and show you how to make money on a descending triangle chart.
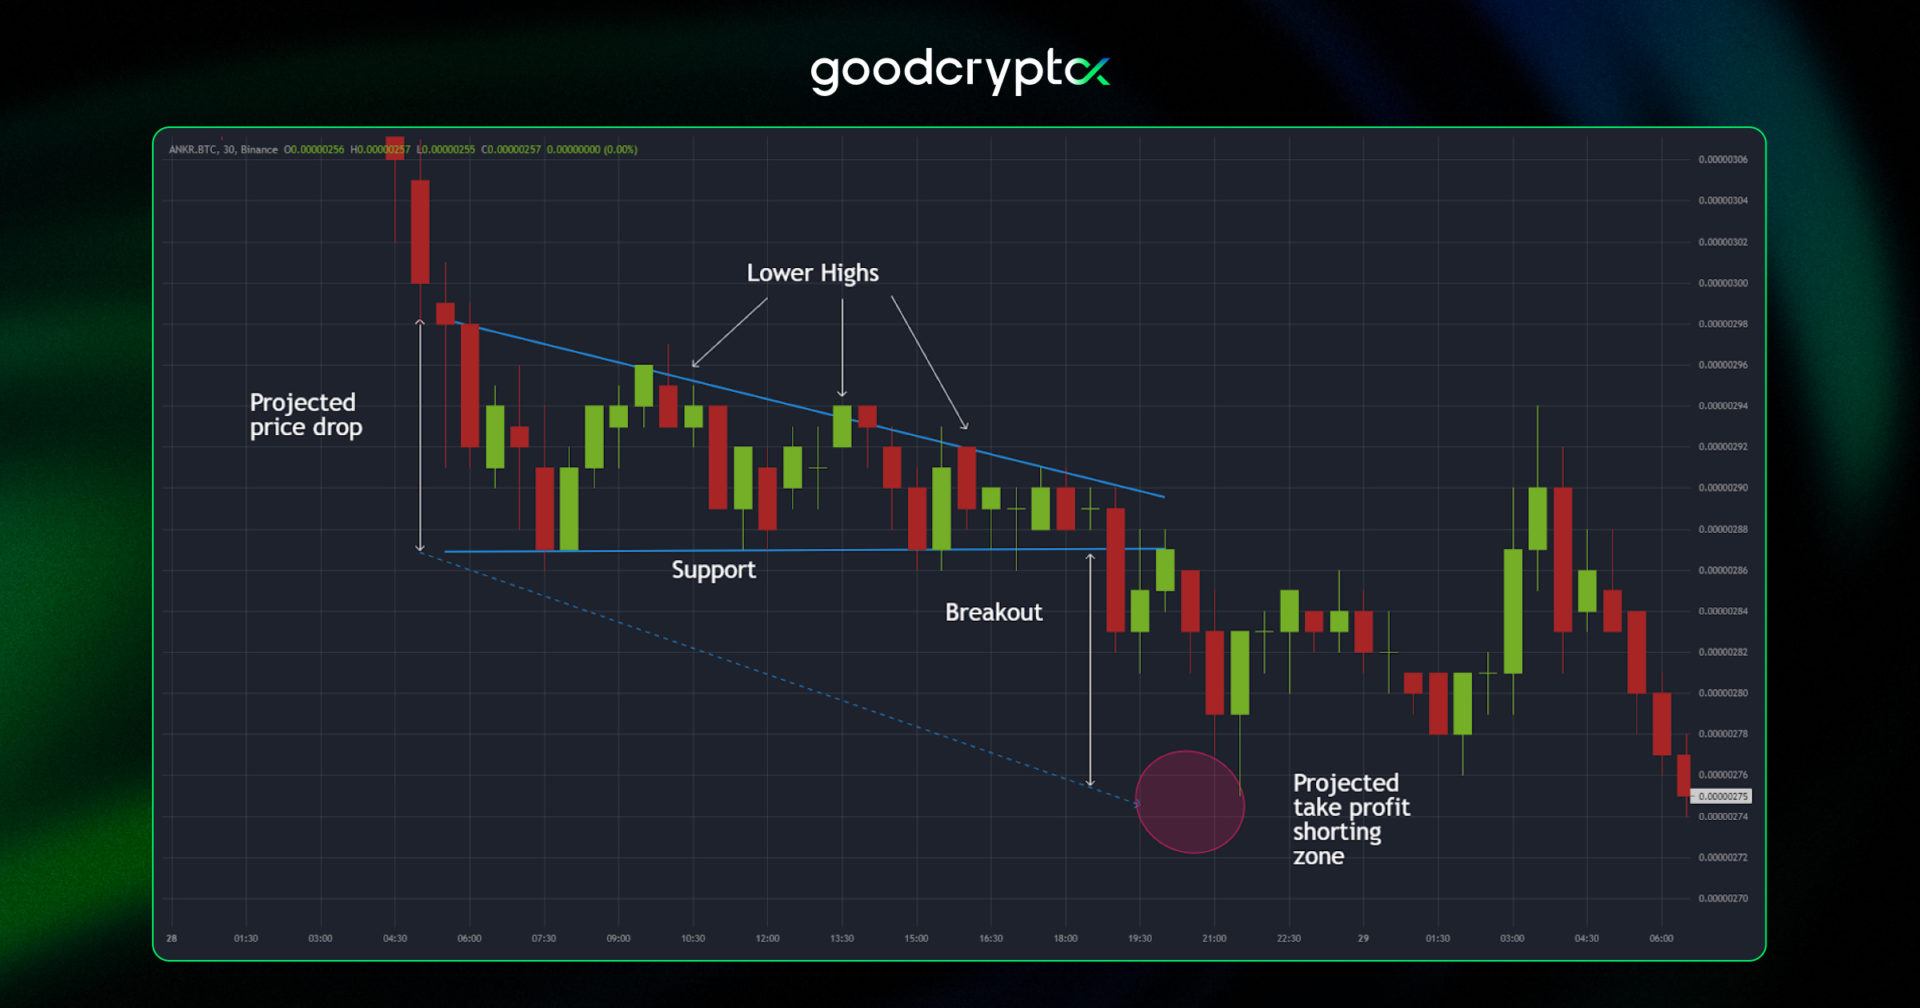
In the chart above, we can see the price action consolidating at the support zone and starting to form a descending triangle with lower highs. Similar to ascending triangle trading, you can use the triangle opening (0.00000298) to predict the depth of the price change, where the breakout happens at a price of 0.00000287. So, on the chart above, the distance from the opening to the breakout is 0.00000011. In this instance, the descending triangle pattern bearish signal gives you a target price on where to take profits on your shorts. It’s 0.00000276.
Symmetrical Triangle Pattern
Finally, we have the symmetrical triangle pattern, which is a bullish or bearish continuation pattern, depending on the trend it is confirming. If it originates from a bullish trend, a symmetrical triangle will most likely give a buy/long signal. If, on the other hand, the symmetrical triangle chart pattern comes from a bearish trend, it will usually give a sell/shorting signal on a breakout.
The bearish or bullish symmetrical triangle pattern builds up momentum with lower highs and higher lows. Once again, the symmetrical triangle breakout will provide a price target following the opening of the triangle.
Symmetrical Triangle Pattern Trading Strategy Example
Let’s illustrate the symmetrical triangle trading strategy with an example.
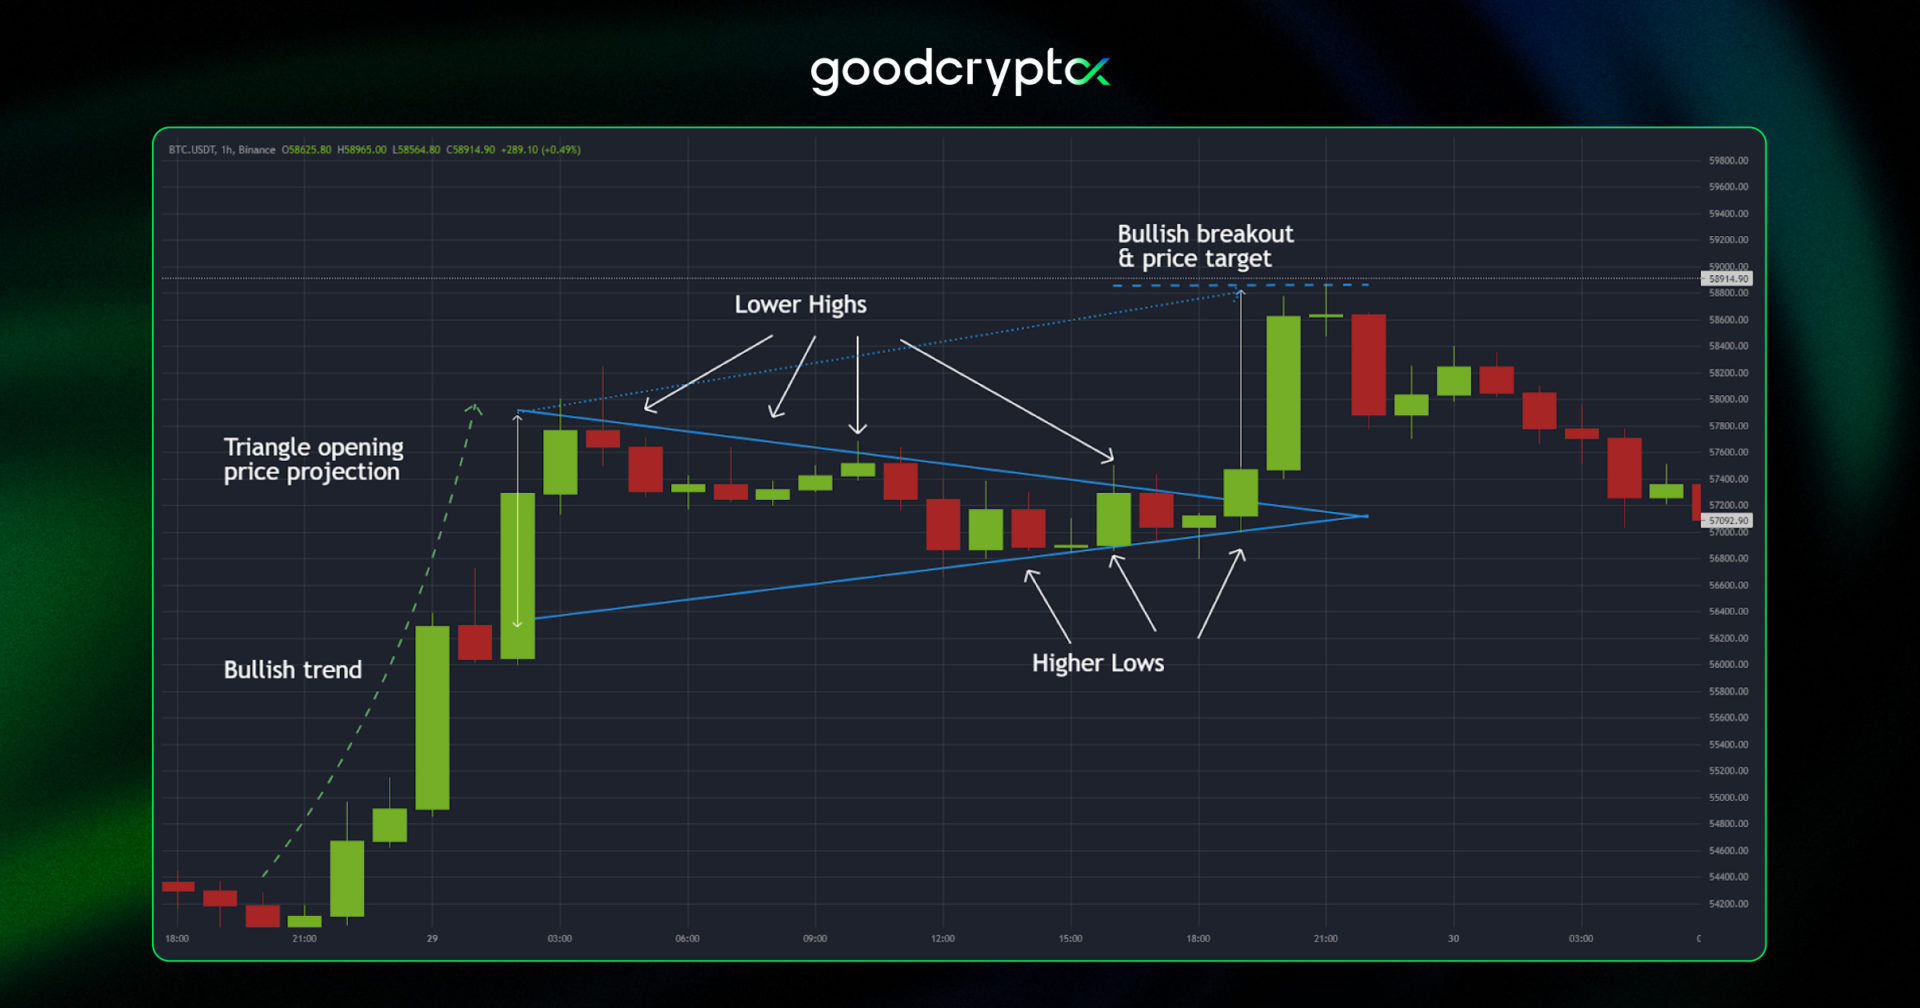
In this chart, you can notice a bullish symmetrical triangle formation. The opening of the triangle once again helps us determine a profit-taking target before another price reversal happens once again. In this example, the distance from the opening to the breakout equals ~$1320. As a result, the profit price target is set at the top of the ~$1600 price upward movement.
Rectangle Pattern
The rectangle pattern is a slight variation of the triangle trading technique. Rectangle pattern trading is done within a trend, where the price remains between two horizontal support and resistance lines. Just like the triangle patterns, the rectangle chart pattern predicts a continuation of the previous trend, bullish or bearish.
Worth noting that the rectangle top pattern generates much less momentum than its triangle counterparts.
Rectangle Pattern Trading Strategy Example
Let’s have a look at an example of a rectangle chart pattern and how to trade it.
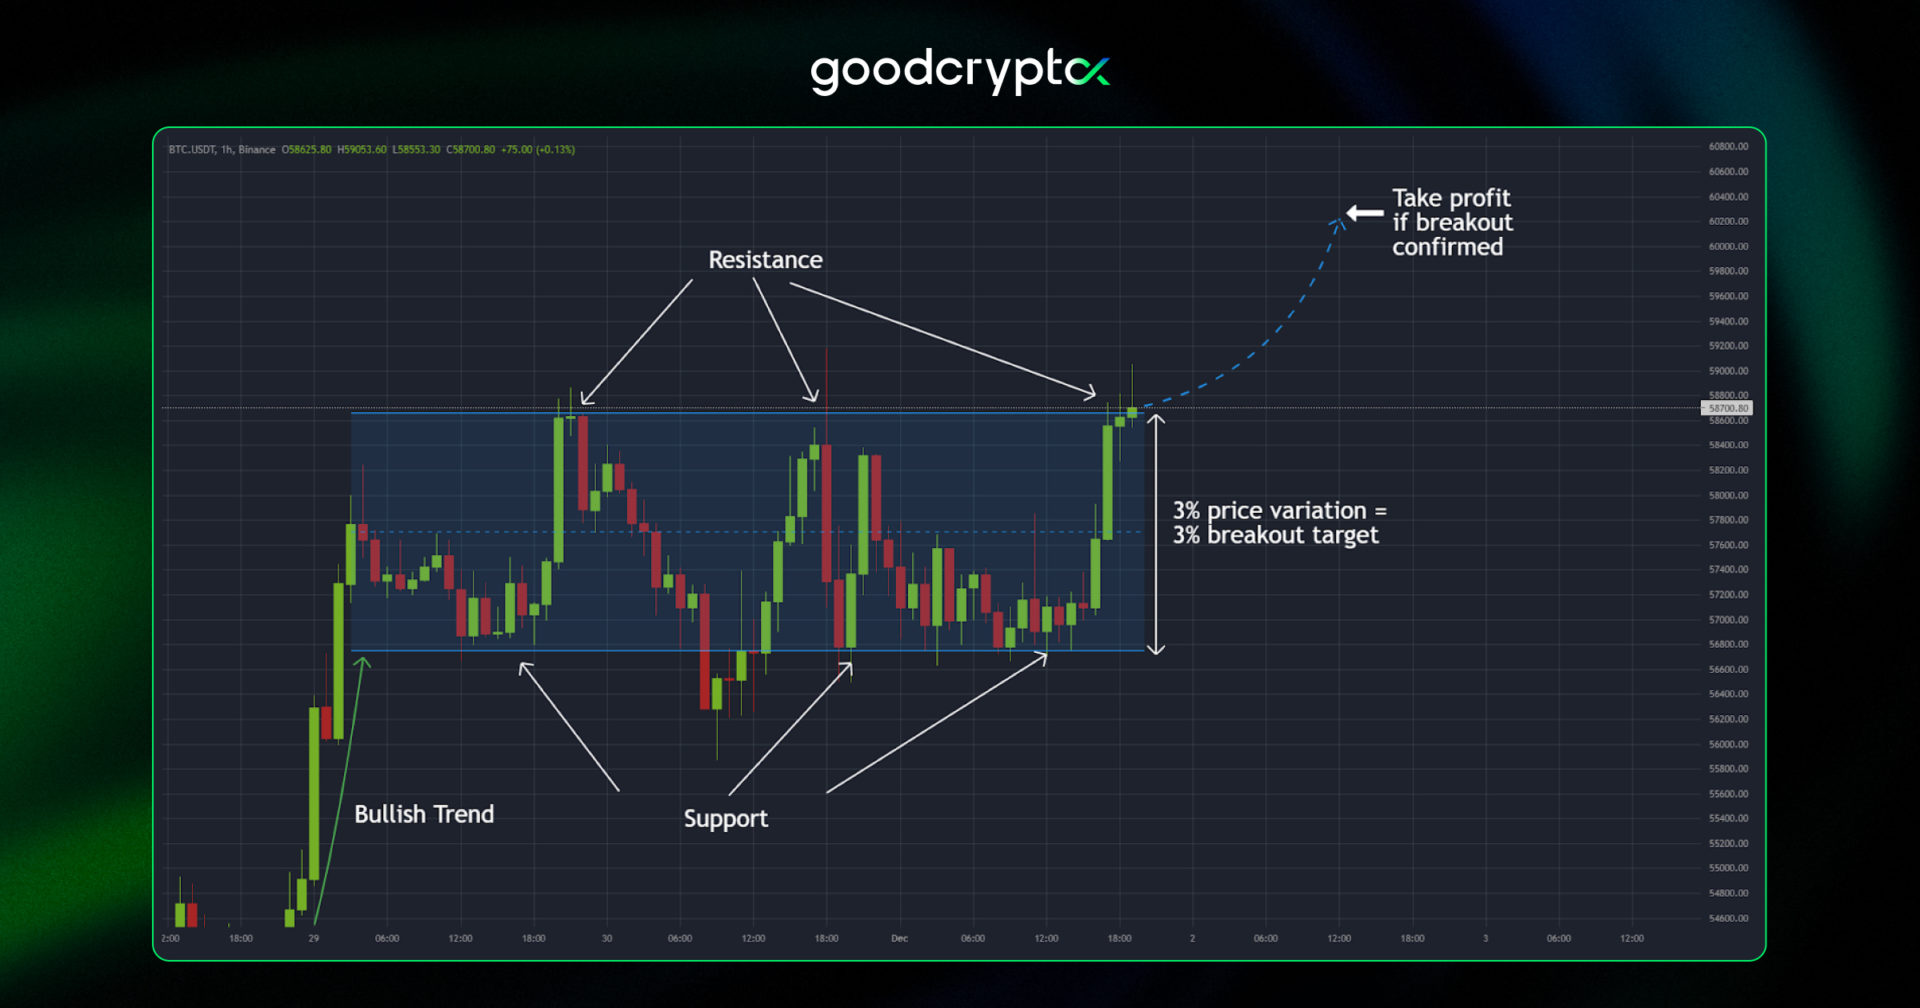
Following a bullish trend, the price encounters resistance and finds support quickly after. The price difference between the two lines is 3%, which is the expected target for taking profit.
The trader can set a buy price at 0.5% above the resistance in case of a breakout, and a 1% stop loss below it, in case the breakout isn’t confirmed.
Diamond Trading Pattern: How To Identify Trend Reversal?
Next on our list of chart patterns for crypto trading is the diamond pattern. The diamond chart pattern signals a reversal in the general trend of the asset. So is the diamond chart pattern bullish or bearish? Well, the answer is – it’s both, as the crypto diamond pattern can occur on either market tops or bottoms. That said, the bearish diamond pattern is much more common and should be used as follows.
Diamond Trading Pattern Trading Strategy Example
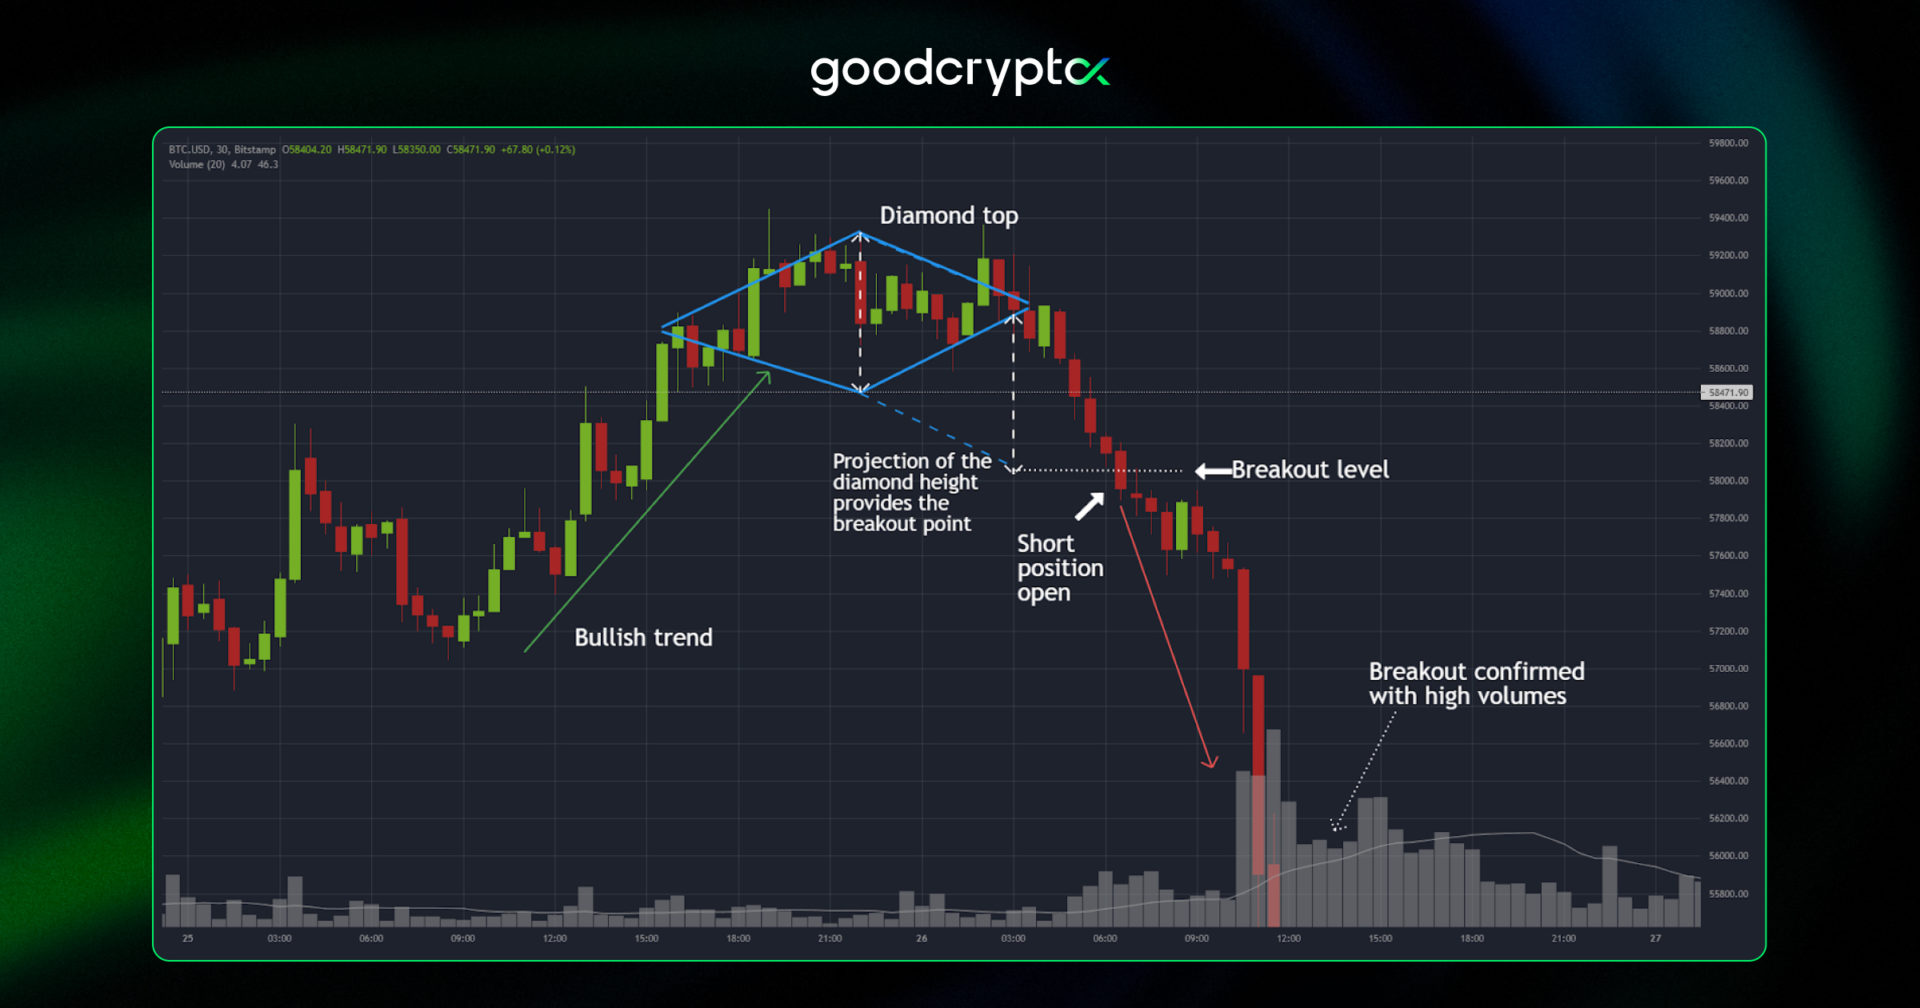
In our example, the diamond pattern occurs on a market top. In diamond pattern trading, the breakout isn’t considered at the moment the candles break the line. Instead, to calculate the breakout level, you should take the height of the diamond and project it under the spot where the price breaks the diamond.
Only once the price goes under this breakout level, you can consider placing a short order. A confirmation through high volume should give additional confidence that the price will continue declining.
How to Find Double Top, Double Bottom, and Rounded Bottom Patterns: Use Cases
Next in our article, we cover four reversal patterns, the double top pattern, the double bottom, the cup-and-handle, and the rounding bottom pattern.
Double Top and Double Bottom Line
The double top and double bottom are trend reversal patterns. They are also fairly easy to spot, as they only rely on resistance and support lines for viability:
- The double top chart pattern is a bearish reversal pattern. On a double top, the price tests the resistance twice, before breaking down support.
- The double bottom pattern, on the other hand, is a bullish reversal pattern. When in a downtrend, the price encounters oversold conditions and tests the bottom twice. It then breaks away from the resistance, registering a considerable price increase.
Let’s check these out with a couple of practical examples.
Double Top Pattern Trading Strategy Example
The bearish double top pattern in our example occurs after a long bullish trend.
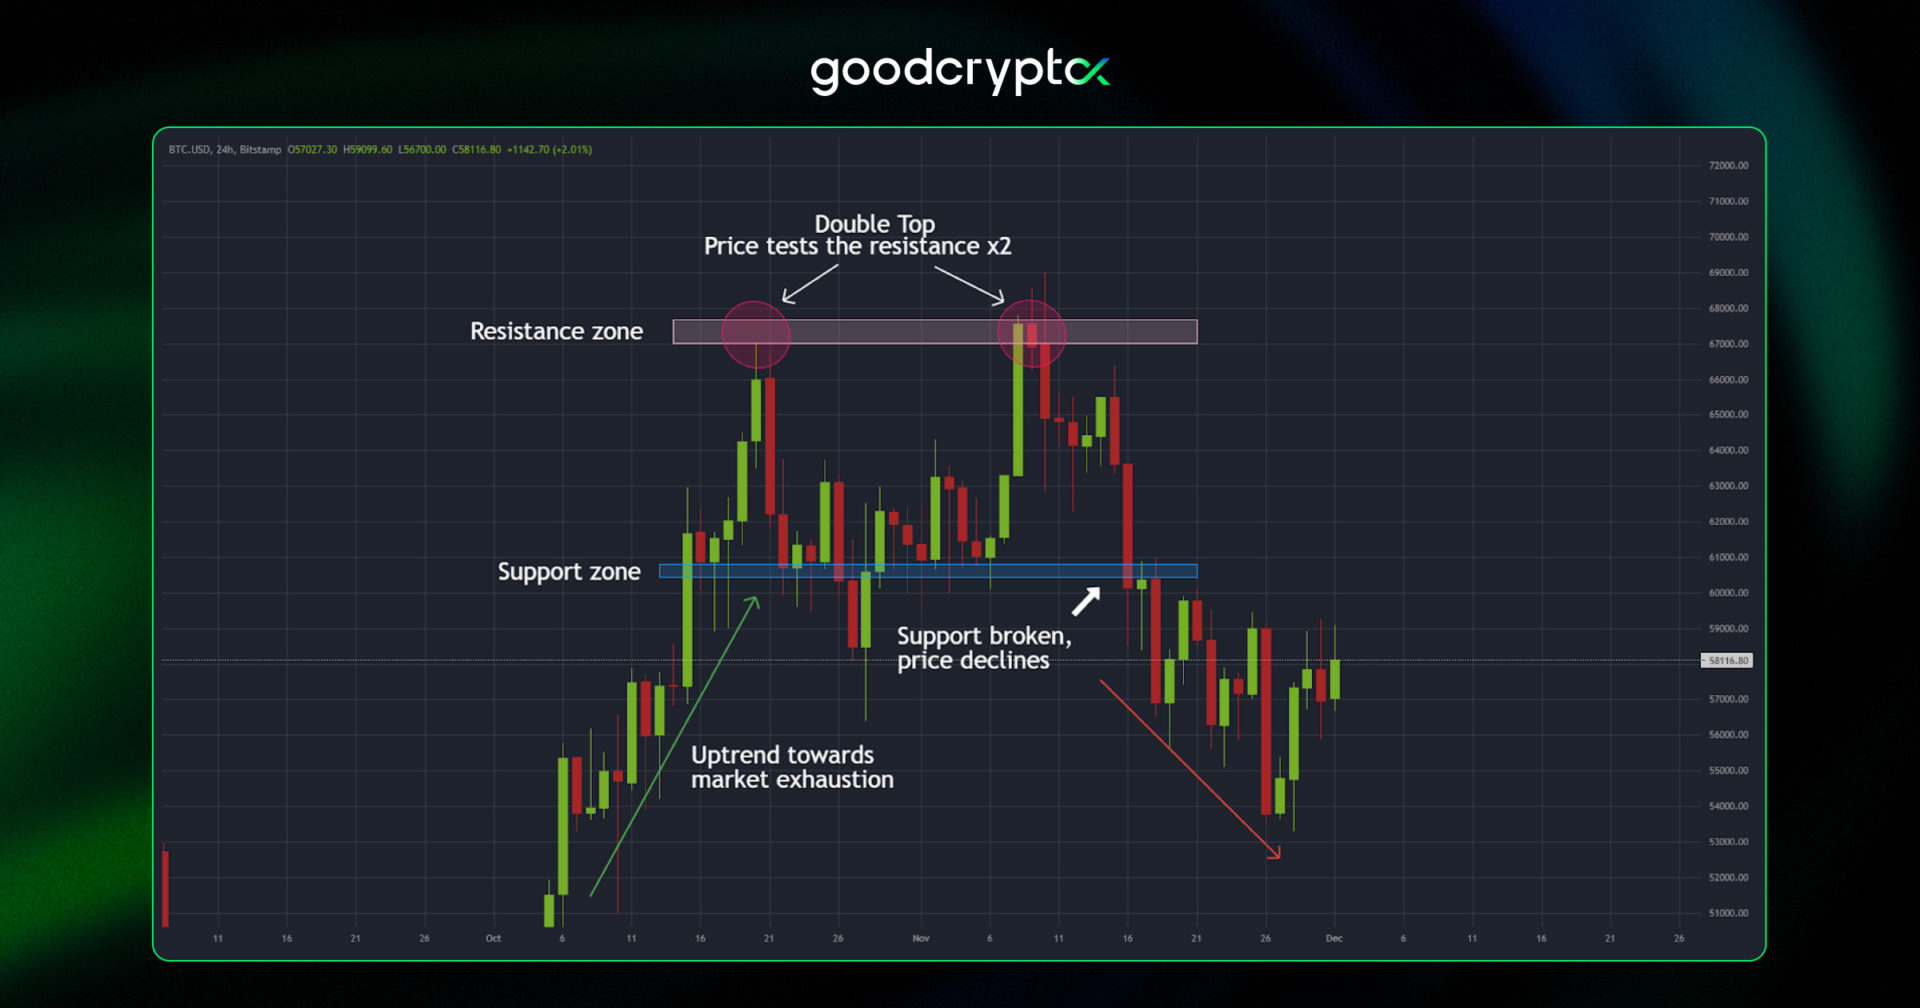
The price encounters overbought conditions and tests the resistance zone twice. After the second rejection, a double top trading pattern is formed. The price breaks support and gives way to a sell signal. Your short target price will be the difference from the support to the resistance. In this case, it equates to ~$5000, so your price target would be around ~$53.000 after the support is broken at ~$58.000.
Double Bottom Pattern Trading Strategy Example
To help you understand what a double bottom is, let’s find a double bottom reversal example in our goodcryptoX app.
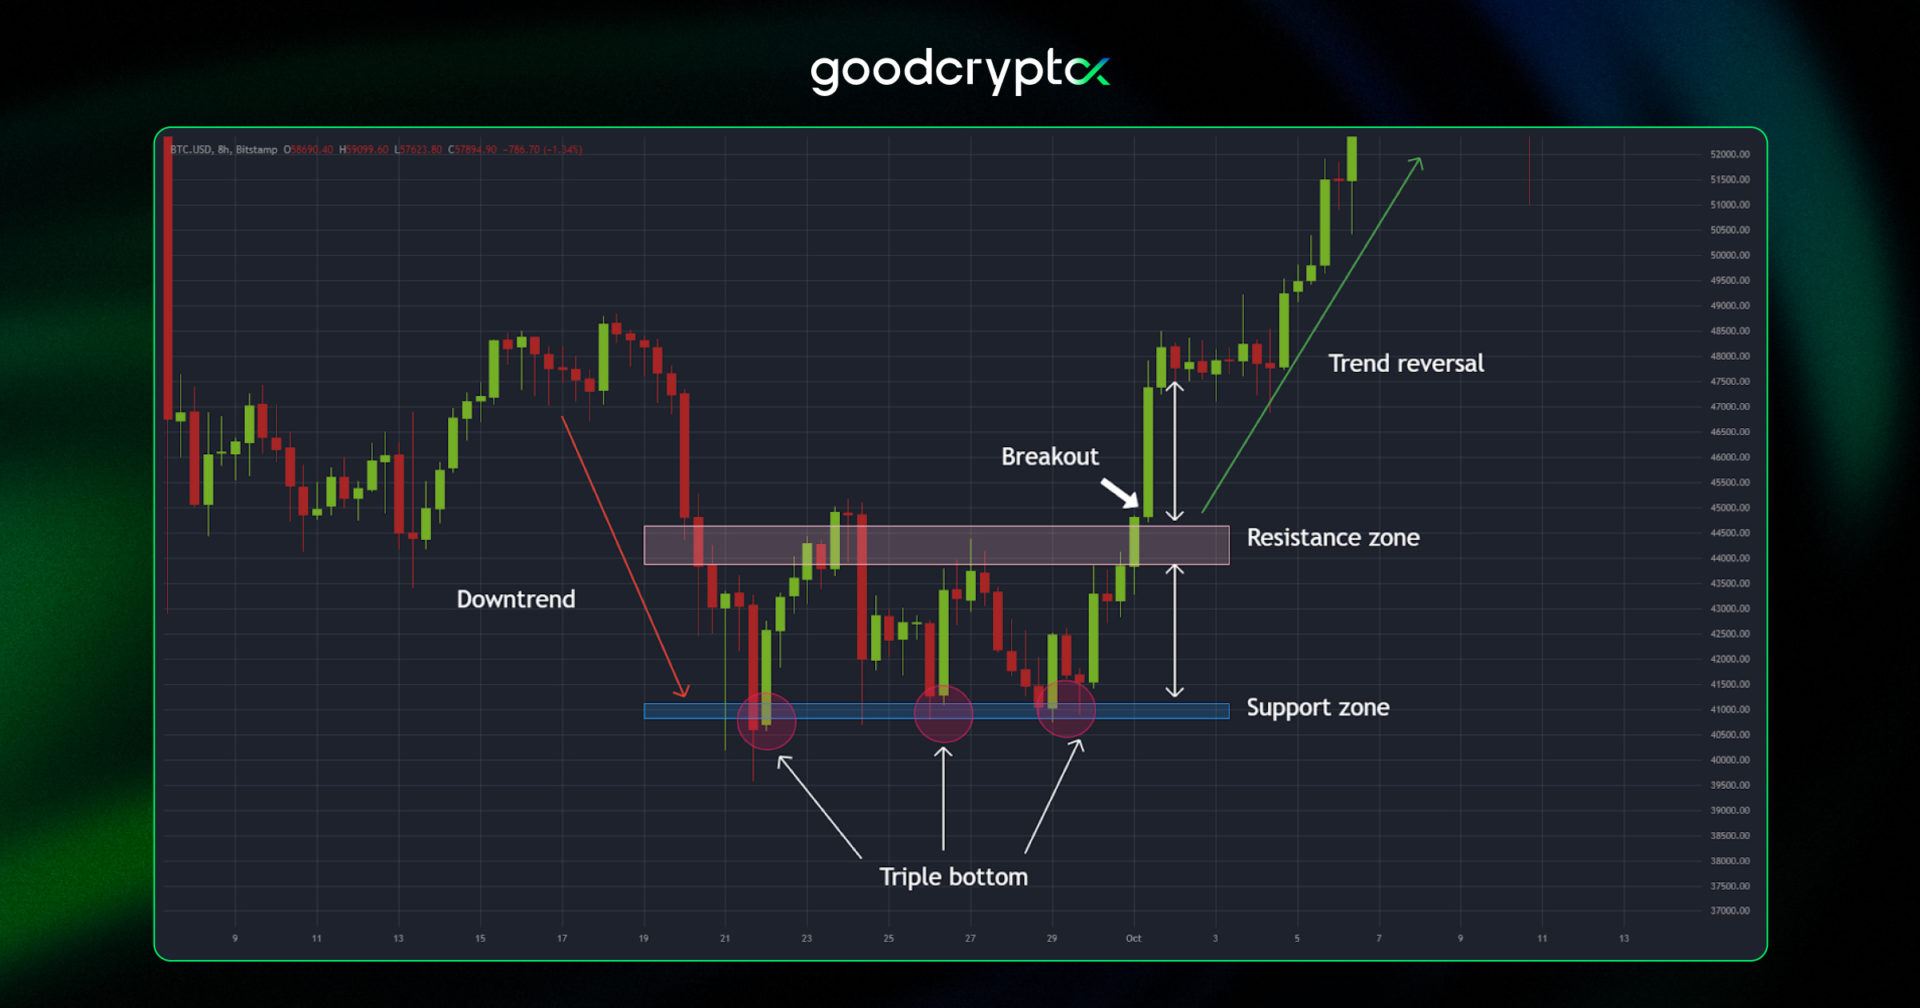
In the chart, we can see the price following a downtrend and finding support. The price tests this support 2 more times, forming the double bottom chart pattern. Actually, in our case, it’s a triple bottom, which works exactly like the double bottom pattern. A significant bounce allows the price to break out of the resistance and reverse the trend. The first take profit target should be of the same height as the distance between the support and resistance. Just like with the double top, the double bottom price target is provided by the distance between the support and resistance zones. In our case, ~$3500.
Cup and Handle Pattern
The cup and handle is a rounded bottom pattern with a twist. It forms a U shape that resembles a cup and is accompanied by a short downward trend that makes up the handle. It’s considered a bullish reversal pattern and can be used for placing long positions right above the handle breakout.
There’s also an inverted cup and handle pattern, which works as the bearish mirror image of the standard formation. Here, the price forms an upside-down U shape, followed by a small upward-sloping handle, before breaking down to continue a bearish trend. Traders use the inverted cup and handle the same way as its bullish counterpart, just flipped: the depth of the inverted cup serves as the basis for projecting a downside price target once the handle breaks to the downside.
Cup and Handle Pattern Trading Strategy Example
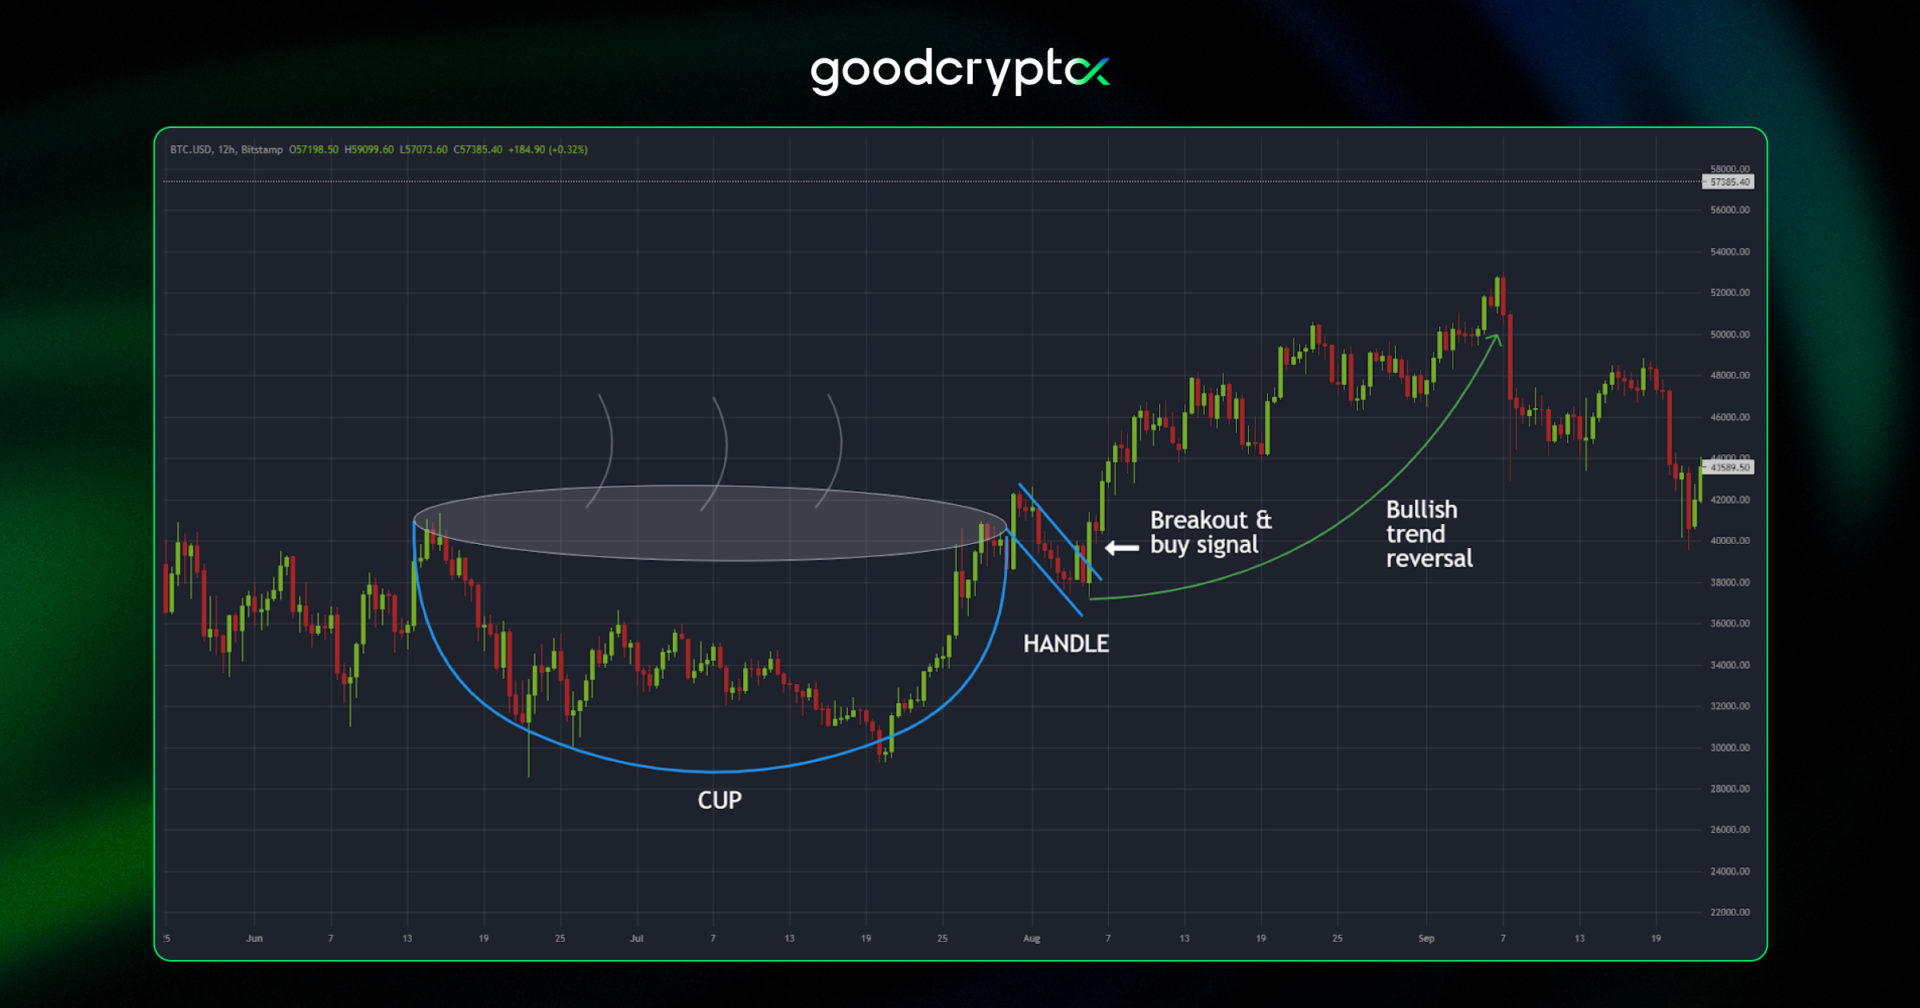
In the example above, we can see the pattern forming a U-shape at the end of a bearish trend. A small downtrend forms the handle, and the subsequent breakout confirms the trend reversal. Traders usually place their long positions at the exit of the handle pattern. Your long price target should be the depth of the cup, which in this case equates to ~$9000.
Rounded Bottom Pattern
Similar to the cup and handle, the rounded bottom pattern forms a U shape. However, it doesn’t present a “handle” to signal the breakout. Instead, the rounded bottom breakout is simply projected from the neckline resistance. This pattern is used to confirm trend reversals for long-term bearish trends.
Rounded Bottom Pattern Trading Strategy Example
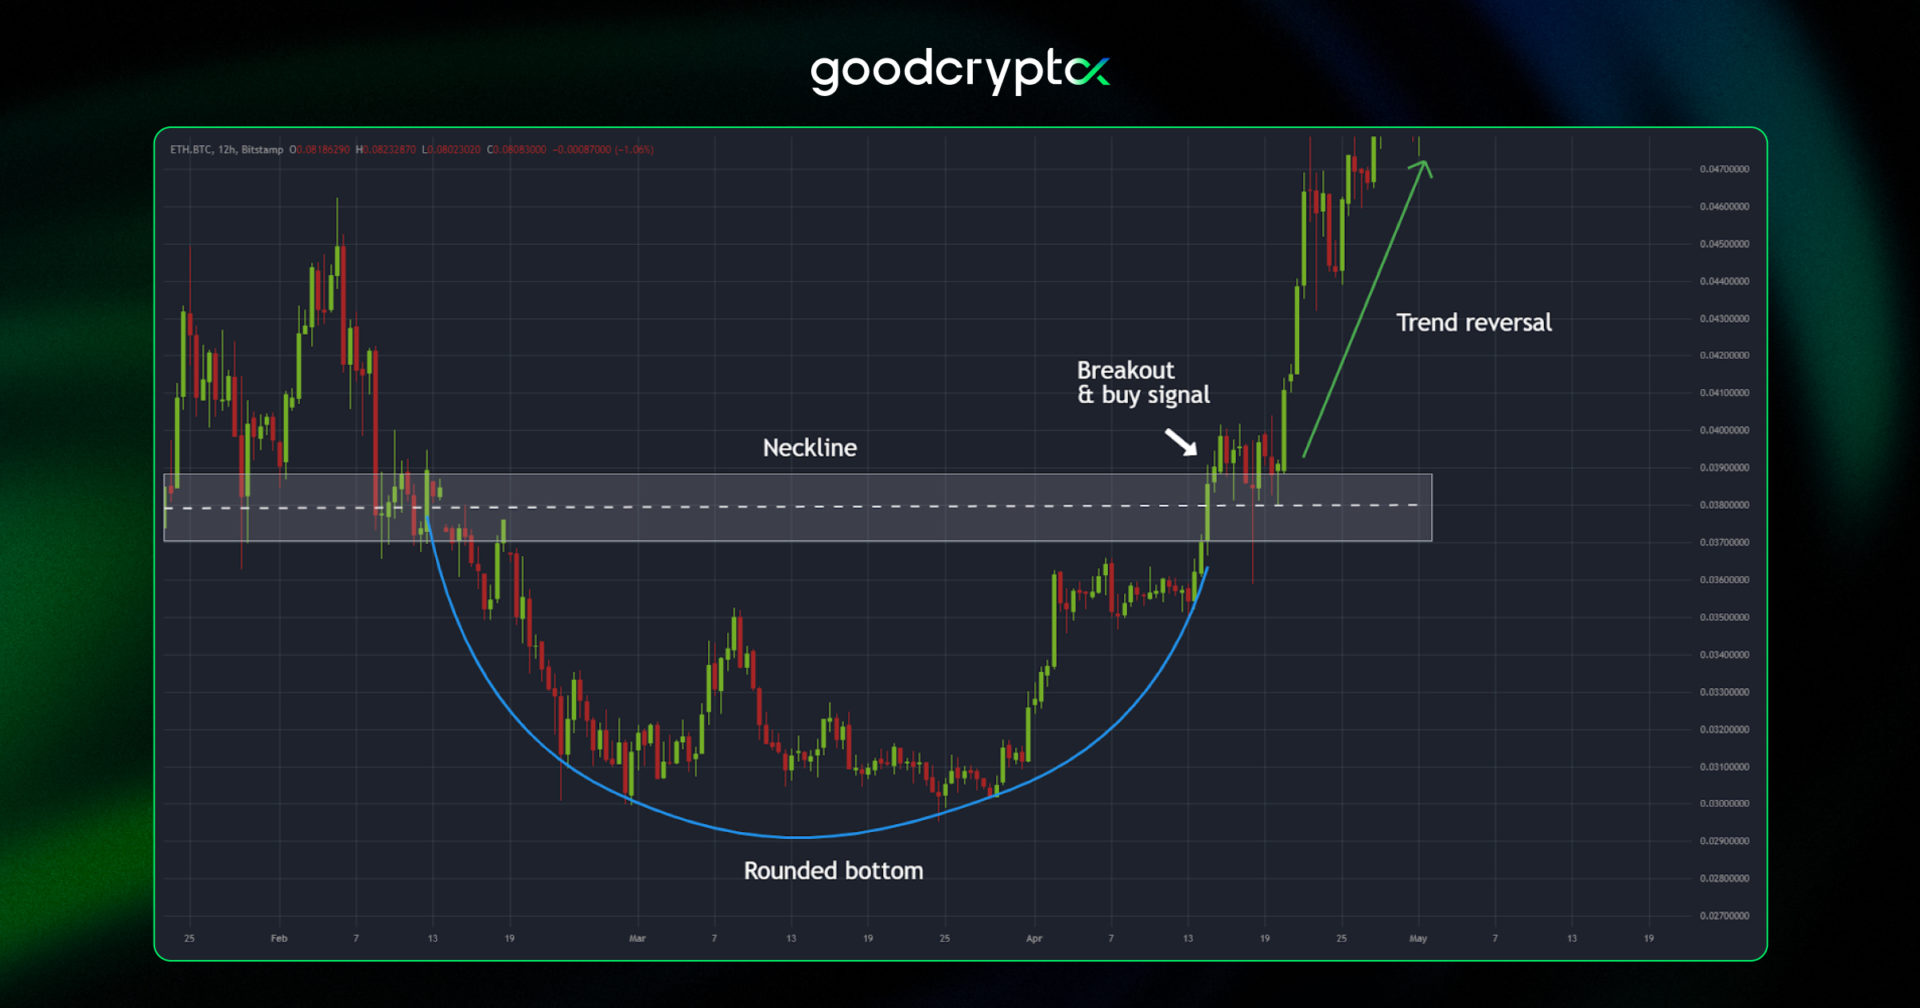
Trading the rounded bottom chart pattern is quite simple, although it’s not the most accurate of patterns. You need to rely on a breakout above the neckline resistance for your buy signals. That said, this line is open to the trader’s interpretation and can produce uneven results. Just like with the cup and handle, your first profit target should be the depth of the rounded bottom pattern, in this case, around 0.06 sats.
Wedge Pattern Trading Strategy With Use Cases from goodcryptoX
To conclude our small encyclopedia of chart patterns, let’s analyze the wedge pattern and its two variations, the rising wedge, and the falling wedge. The wedge chart pattern can be either a reversal or continuation pattern, depending on the trend it is in.
Rising Wedge Chart Pattern
The bearish rising wedge is formed by prices registering at least two higher highs and two higher lows. This rising wedge pattern is considered extremely bearish because it can signify one of two things:
- A continuation of a bearish trend.
- A reversal of a bullish trend.
In either case, a rising wedge breakout usually results in a bear market.
Rising Wedge Chart Pattern Trading Strategy Example
So, what are the rising wedge pattern rules for trading? Well, similar to triangle patterns, you should project the opening of the edge as your target price on exit, regardless of the direction.
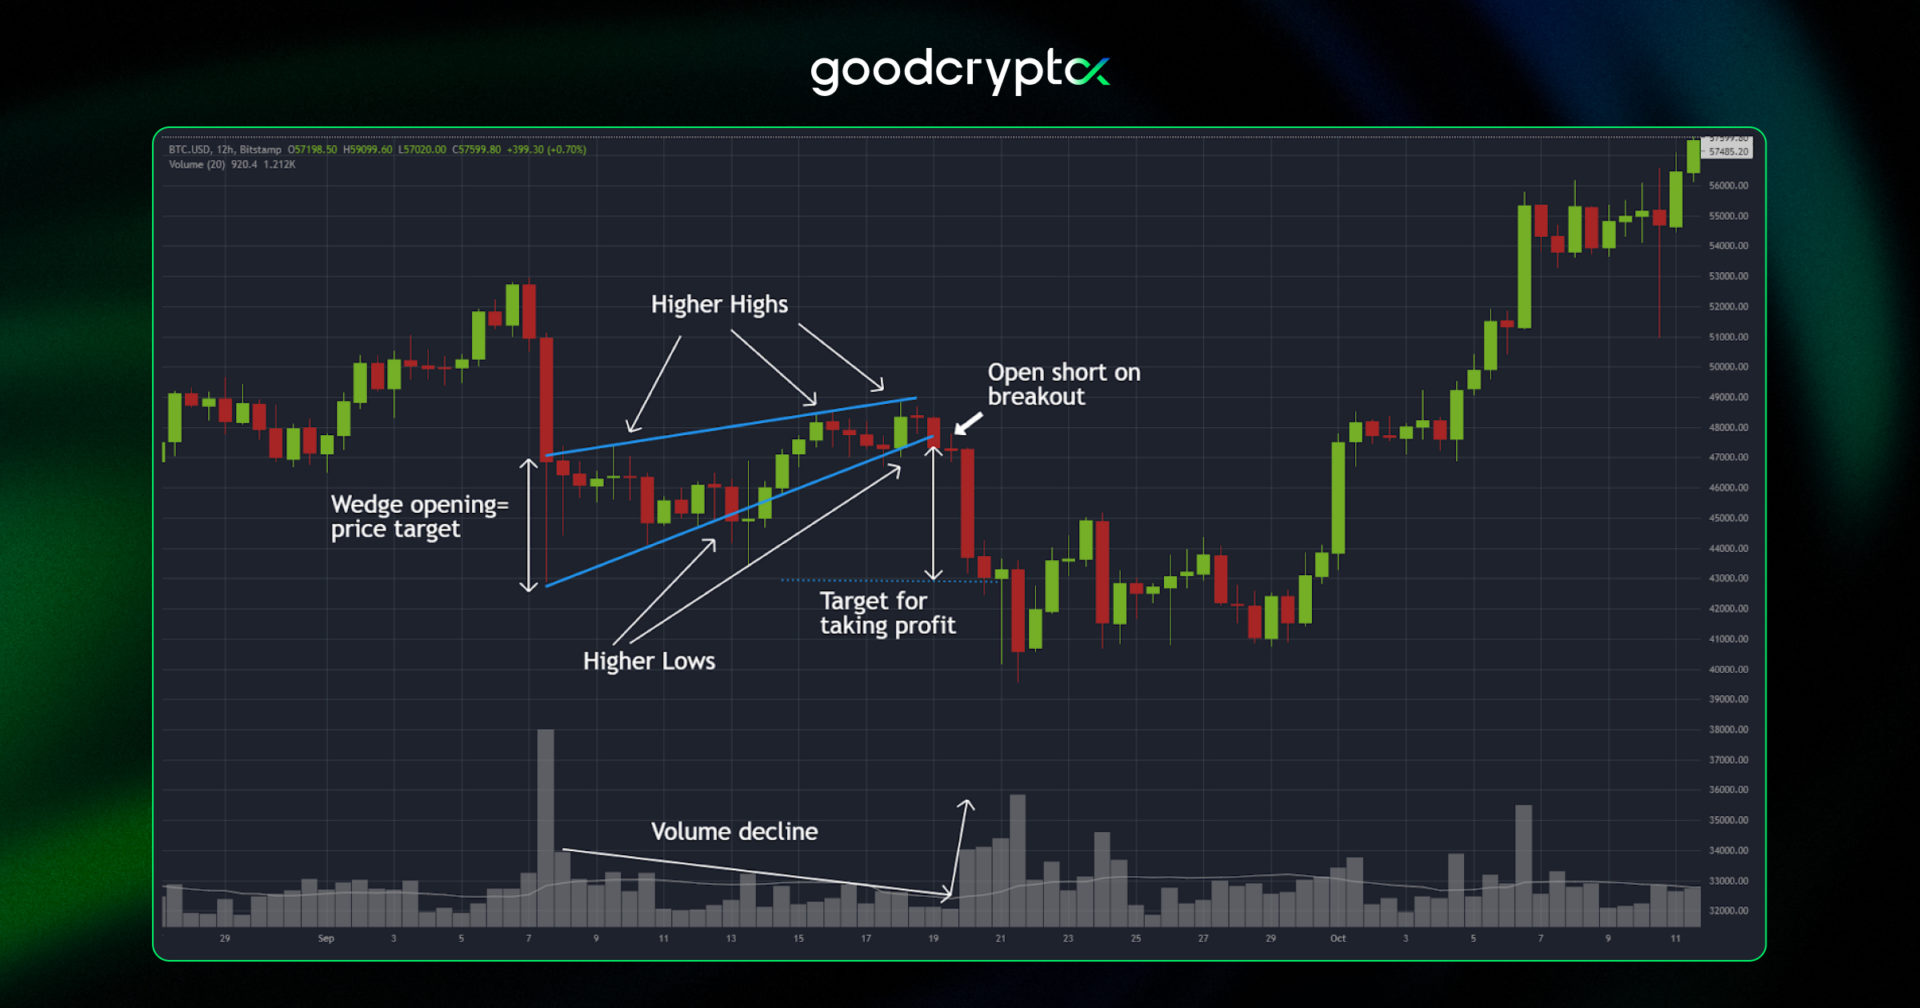
In the example above, you can see a rising wedge continuation pattern, where the short bullish uptrend forms a wedge with higher highs and higher lows. The volume decline shows momentum buildup towards a bearish breakout. Shorts are to be placed under the wedge breakout zone, with the target equating to the opening of the wedge ($46.000-$42.000=$4000).
Falling Wedge Chart Pattern
As you might have guessed by now, the falling wedge pattern is the bullish version of the wedge pattern chart patterns. The descending wedge pattern is made up of at least two lower highs and two lower lows. The descending wedge pattern is considered bullish, as it can signal:
- A continuation of a bullish trend.
- A reversal of a bearish trend.
So, regardless of the trend, the falling wedge breakout will signify an entry into a bull market.
Falling Wedge Chart Pattern Trading Strategy Example
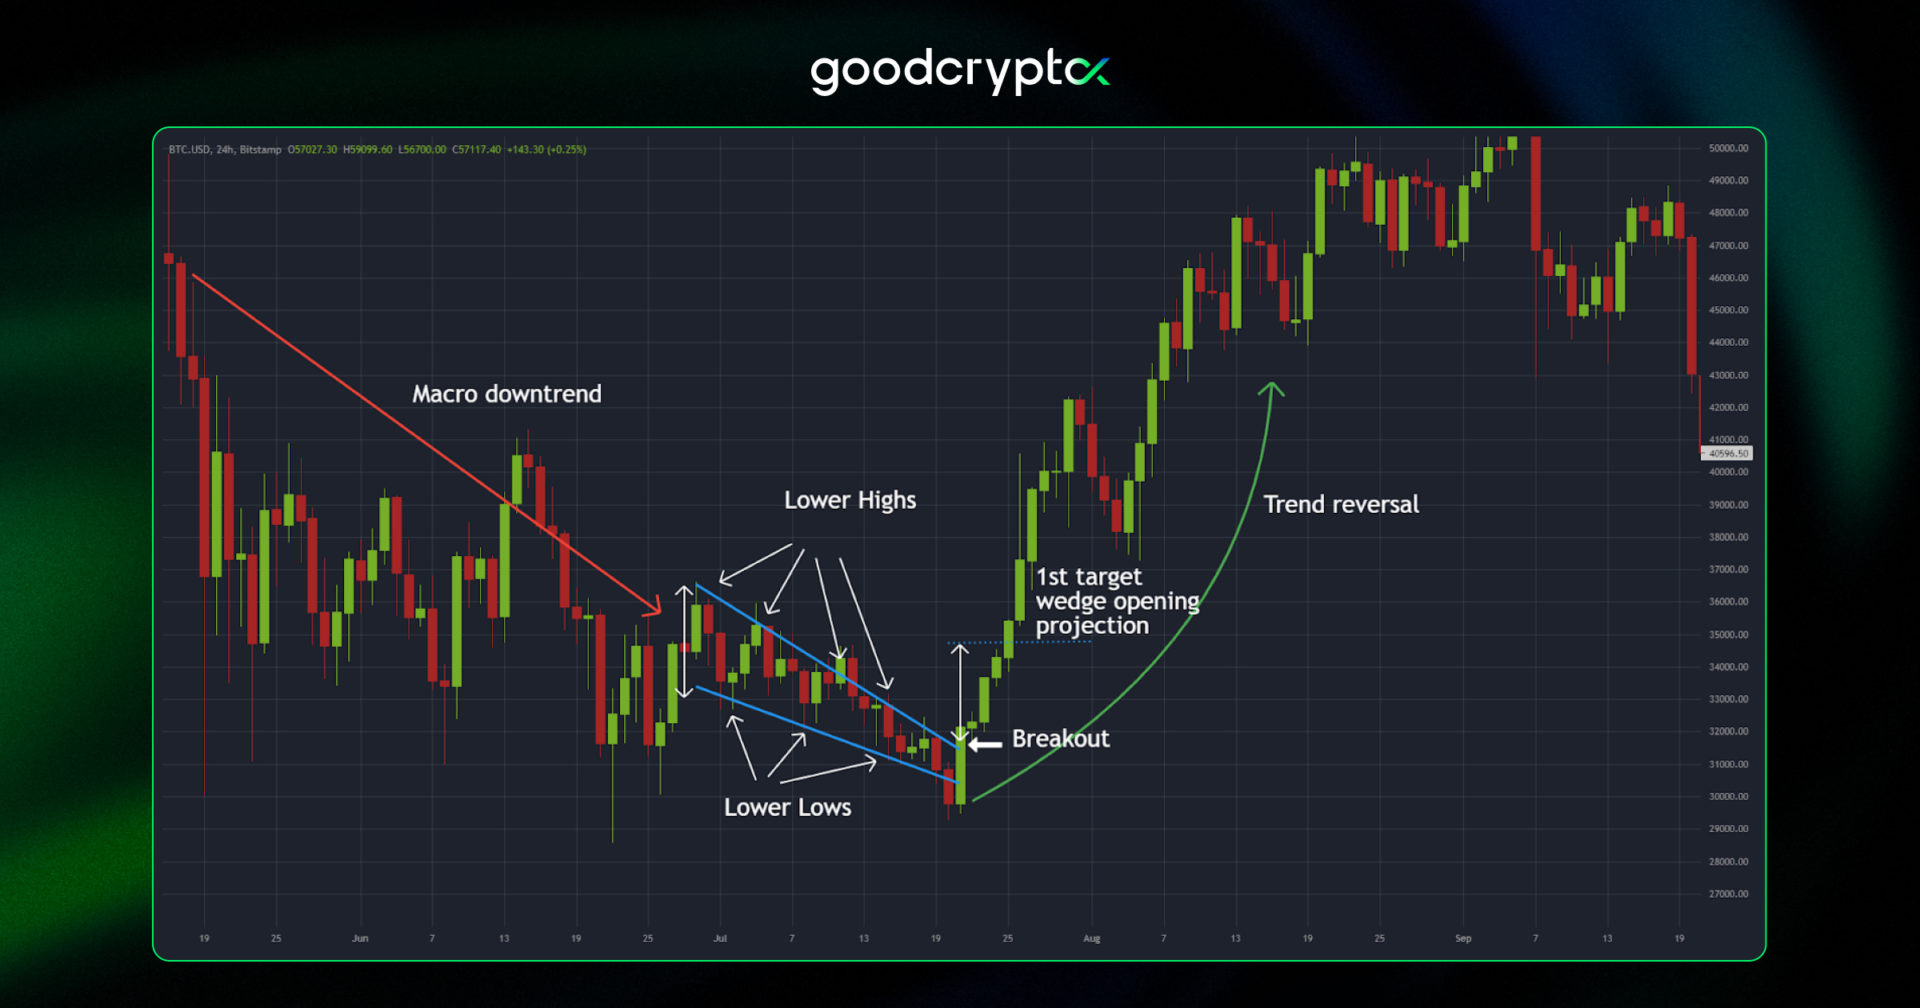
In our example, you can spot a falling wedge reversal of a bearish trend. To proceed with a falling wedge technical analysis, try identifying a pattern of lower highs and lower lows. The opening of the wedge will give you the price distance for safely taking profits on the breakout ($35.500-$33.000=$2.500).
Quick Overview of the goodcryptoX App
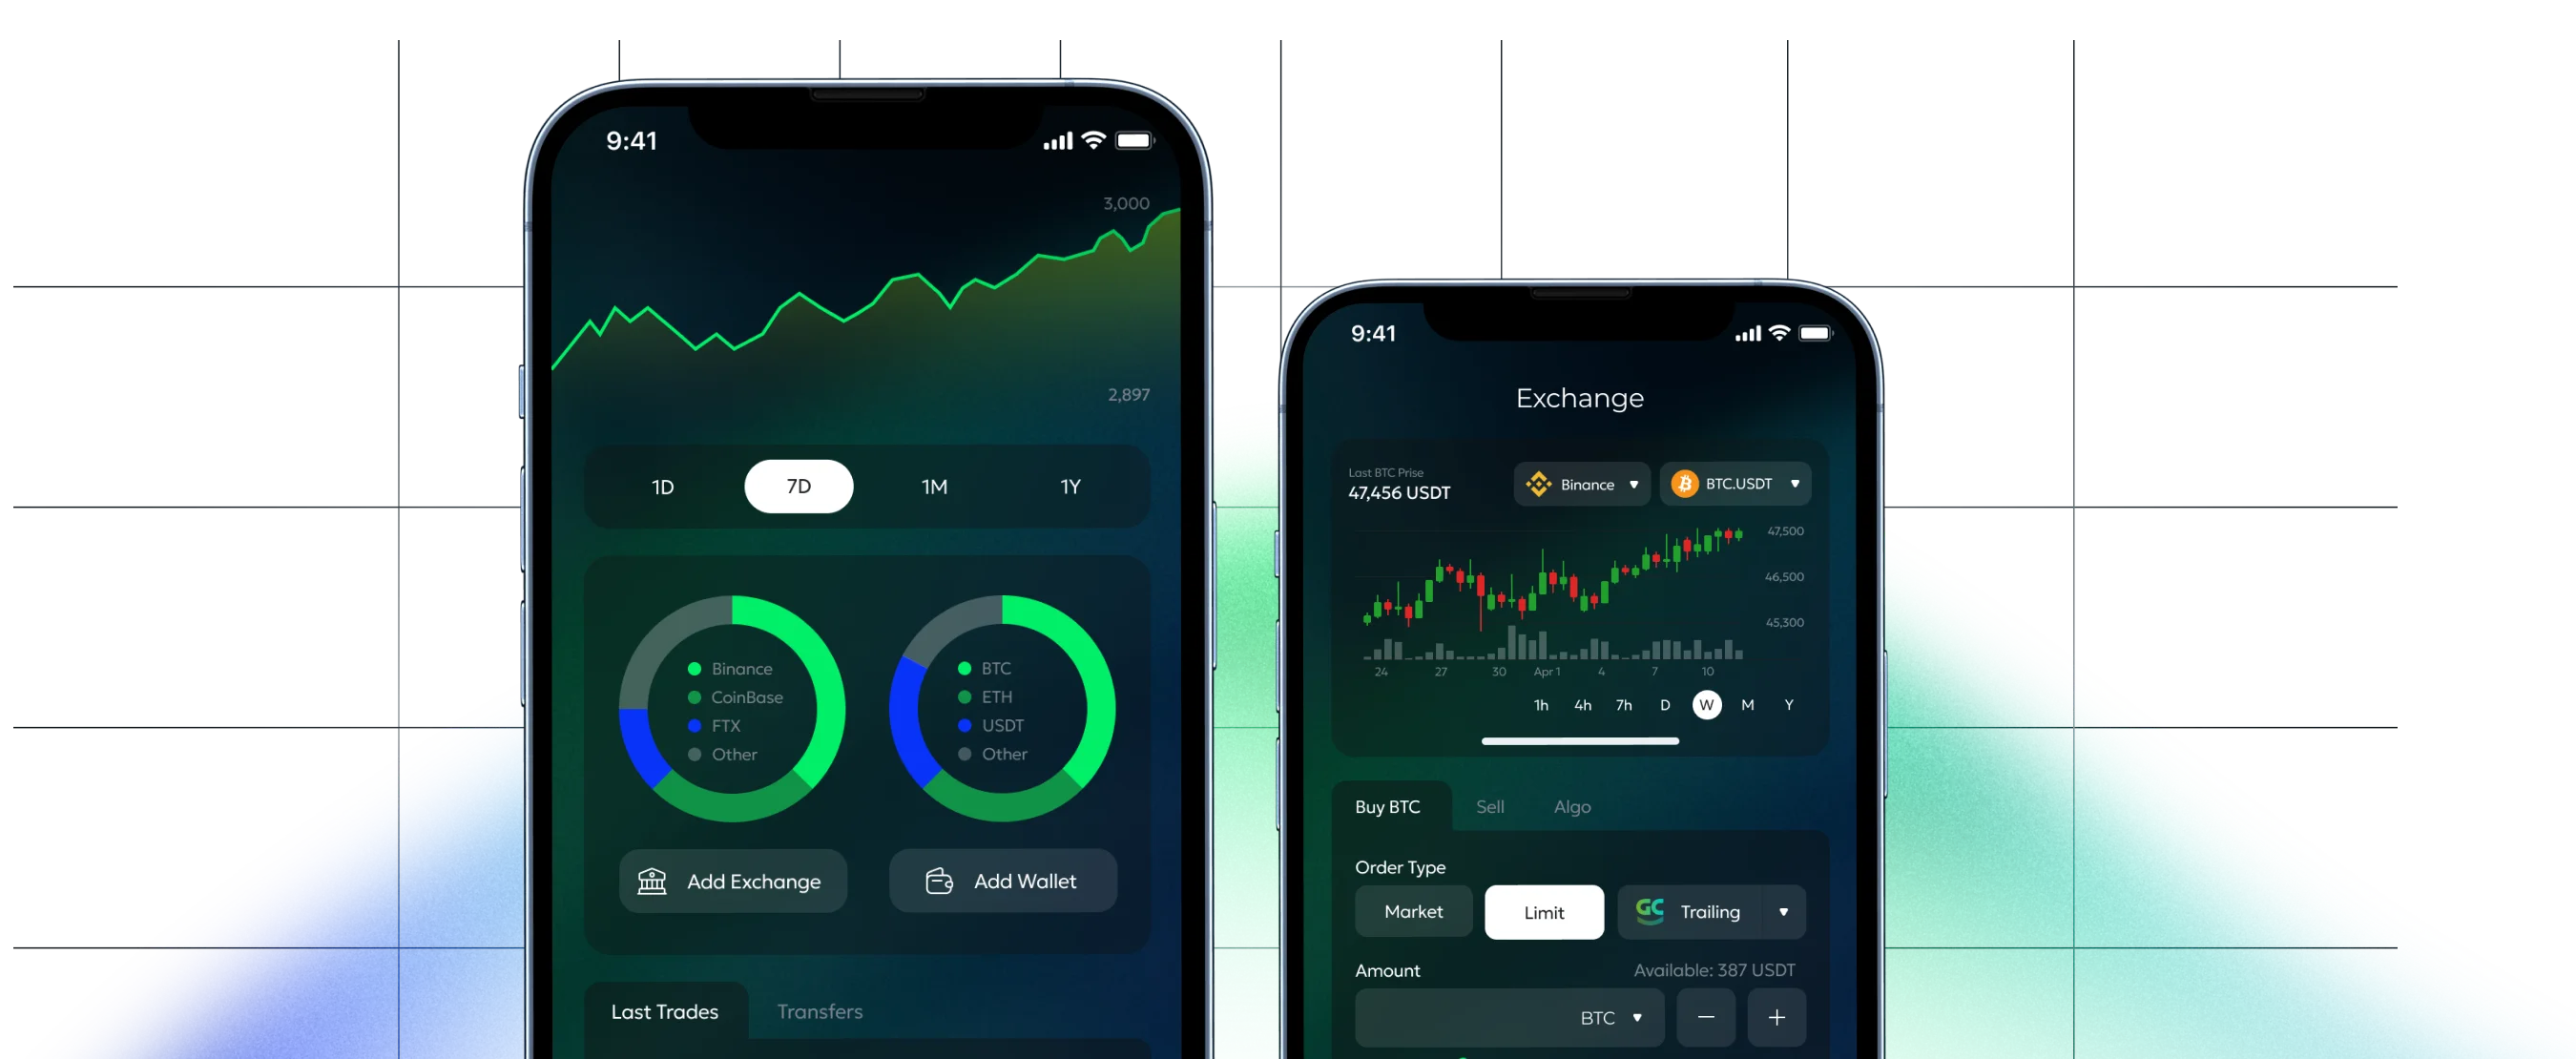
One thing that we would like to point out is that everything we explored in this article, we did with the help of our goodcryptoX app. That said, our app is more than just a simple charting tool. In addition to providing you with everything you would even need for drawing chart patterns and setting up your strategy, you will be able to:
- Track your portfolio across every major crypto exchange and blockchain network with an easy-to-understand overview of all your holdings & distribution by assets, exchanges, and wallets breakdown.
- Follow the price charts of 30+ CEXs, Hyperliquid and DEXs across 5 main chain networks – Solana, BSC, Base, Abitrum and Ethereum.
- Set up automatic trading signals following your chart trading patterns strategies.
- Trade across more than 30 exchanges, with advanced order types, regardless of the offering on the exchanges themselves.
- Use advanced algorithmic automation in your trades with no less than three different methods – infinity trailing, TradingView Strategy, Grid, and DCA bots.
- Set trailing stops and maximize your profits in the highly volatile crypto market.
- Receive alerts for sudden movements of the top currencies, DeFi hyped projects, newly listed currencies, and advanced alerts based on technical indicators.
- Futures and leverage trading are possible on the most liquid markets like Binance, Bybit, Hyperliquid, OKX, KuCoin Futures, and more.
- Trade on iOS, Android, and Web with a single account.
All in all, our goodcryptoX app is the perfect package deal that will give you an edge in this highly competitive market. With powerful charting tools, multi-exchange trading, advanced automation, and our FREE Crypto Chart Patterns PDF guide as a handy reference, you’ll have everything you need to identify patterns, build trading setups, and execute your strategy with confidence.
Conclusion
This concludes our guide on how to read crypto charts, patterns, and apply them yourself in your daily technical analysis. The general pattern day trading rule is that you shouldn’t rely 100% on these patterns as your sole indicator for trading. They can be invalidated mid-way and produce the opposite result.
However, combining these patterns together with candlestick chart patterns, indicators such as trend lines, Moving Averages, and MACD, should give you sufficient insight into the market. With time and experience, they can become an efficient tool to maximize your profits and avoid market traps. Of course, downloading the goodcryptoX app for Android or iOS will make all of this a bit easier!