
We’re proud to be the first to launch a DCA bot for DEXs! Enjoy the same DCA trading experience you’re used to on CEXs but with no technical limitations.
July 2, 2025
The Good Crypto app comes with a wide range of technical indicators. Moving Averages are one of the most important additions to the price chart, and understanding them will give you a great advantage in the market. Good Crypto provides over 8 different Moving Averages. This guide will explain a less common group of MA’s so you can understand and trade them.
Find the article about the Simple Moving Average, Weighted Moving Average, and Exponential Moving Average here!
Moving Averages represent the average closing price over a certain period. A period is represented by several candles. This means that a 100 MA will represent the average closing price of the last 100 candles.
The indicator is also called a “lagging indicator” because it will respond after the price movement happened. Moving Averages are calculated in different ways, some will react faster to the more recent price changes and others are smoothened.
These differences in Moving Averages create a wide field for traders to experiment with. It is up to you as a trader to decide which one you prefer.
Moving Averages are commonly used as a support and resistance, and indicate buy or sell signals when crossing over each other. Combining MA’s is very common, and when using more than 2, they create a band or a ribbon.
As explained in the Moving Averages article, every one of these indicators is calculated on the previous closing prices. The number of candles included in the calculation is going to define if the Moving Average is strong or weak. What does this mean?
A strong Moving Average uses a lot of information, a lot of previous data. When you use 100 previous candles to calculate the MA, it will give stronger indications than when using a 10 period, or 10 candles MA.
The most common periods used for a Moving Average calculation are 10, 20, 50, 100, and 200.
Advanced and special Moving Averages come with adaptations and advanced calculations, usually, they aim to achieve a result of being more responsive, reduce the lagging effect, and follow the price movements faster, so a trader can respond quicker.
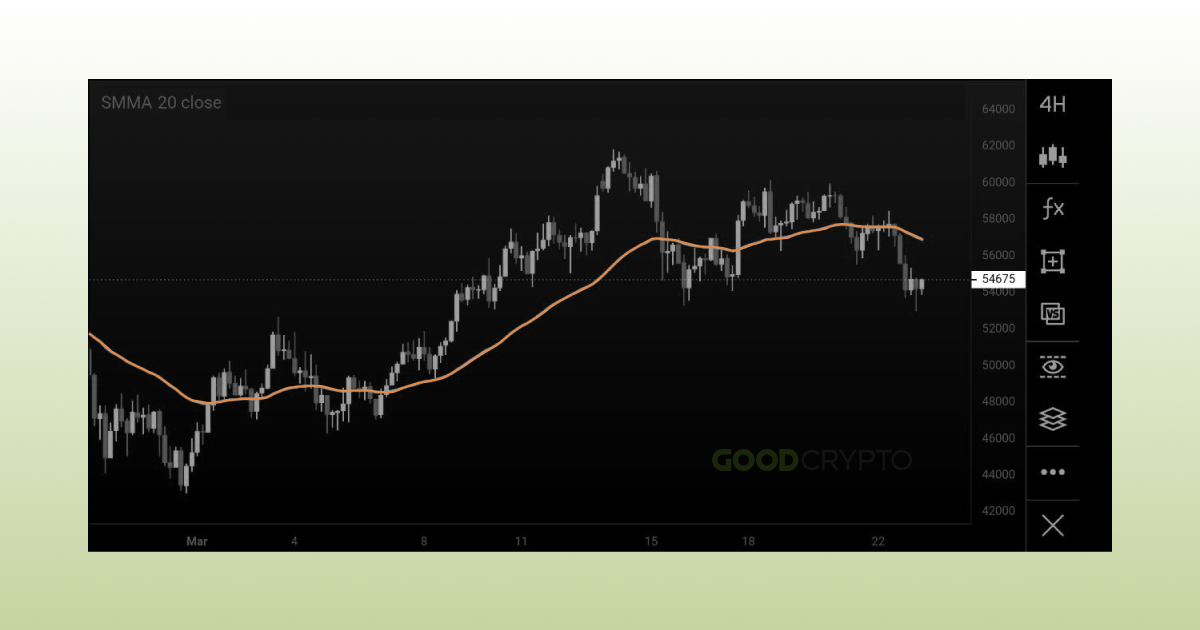
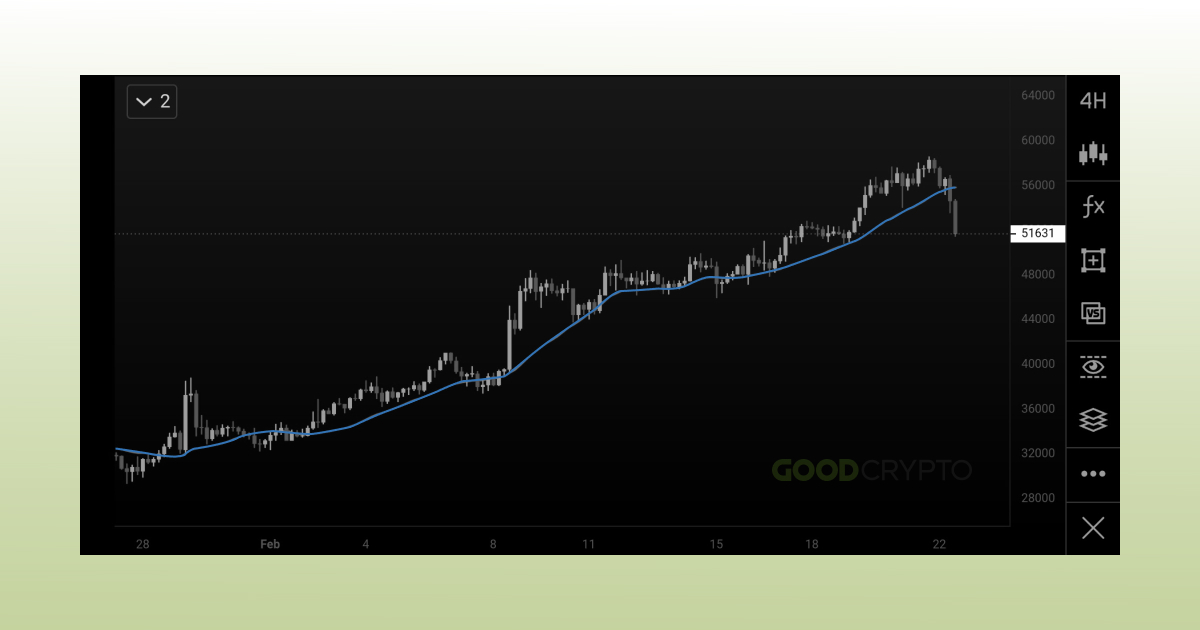
The SMMA is shown on the BTCUSD 4H chart.
The SMMA is a combination of the SMA and the EMA and superimposes all the available history related to data shown by these two indicators. Please read the article covering the SMA and EMA if you haven’t to get a better understanding of both of these common indicators. Compared to the SMA and the EMA, the SMMA is mostly used by traders that trade short term, for example, swing traders and intraday traders.
SMMA = (SMMA# – SMMA* + close) / N
SMMA#: Previous bar’s smoothed sum
SMMA*: The previous bar’s Smoothed Moving Average
Close: Presenting the closing price
N = period of smoothing
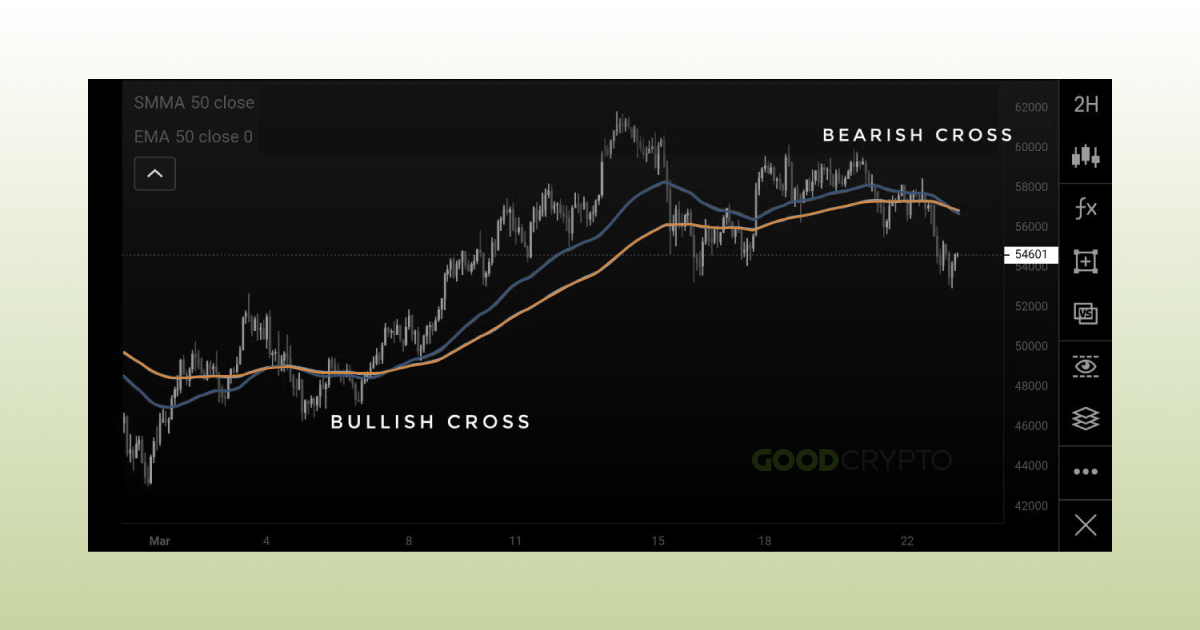
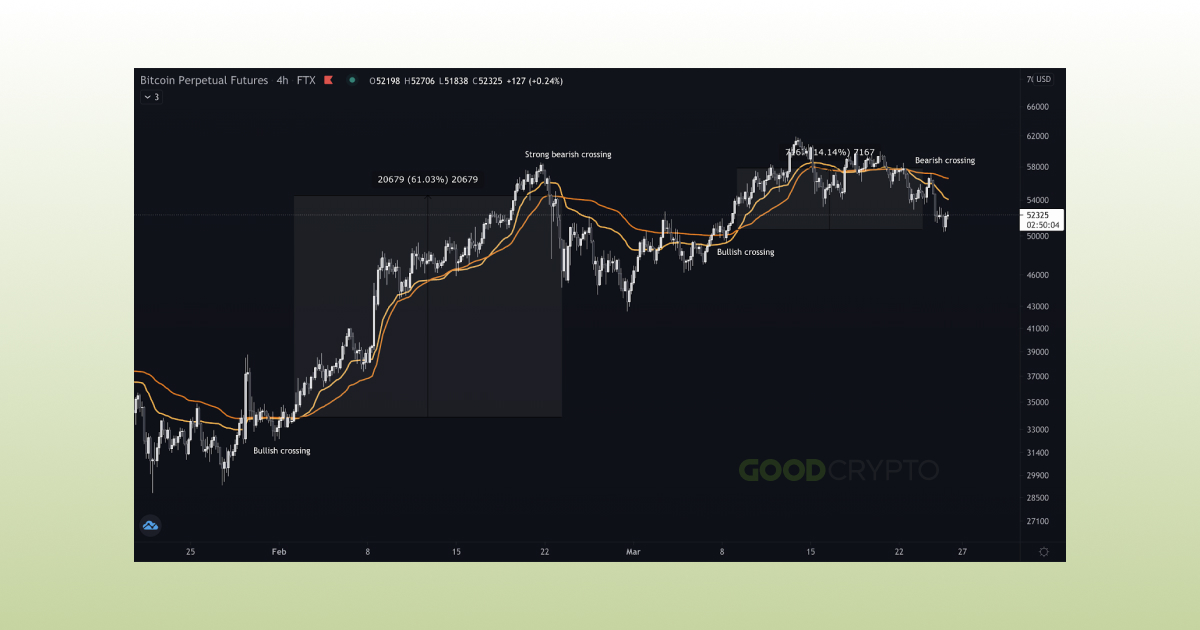
The SMMA is a combination of the SMA and the EMA, which means it will run between both of the latter when set at the same settings. The EMA will move slightly closer to the price as the SMA and the SMMA. Using the SMMA and the EMA together can give interesting signals when both lines cross. The SMMA moves closer to the price than the EMA, and when the SMMA crosses below the EMA it will indicate a potential bearish reversal. Likewise, if the SMMA crosses above the EMA it will indicate a potential bullish reversal.
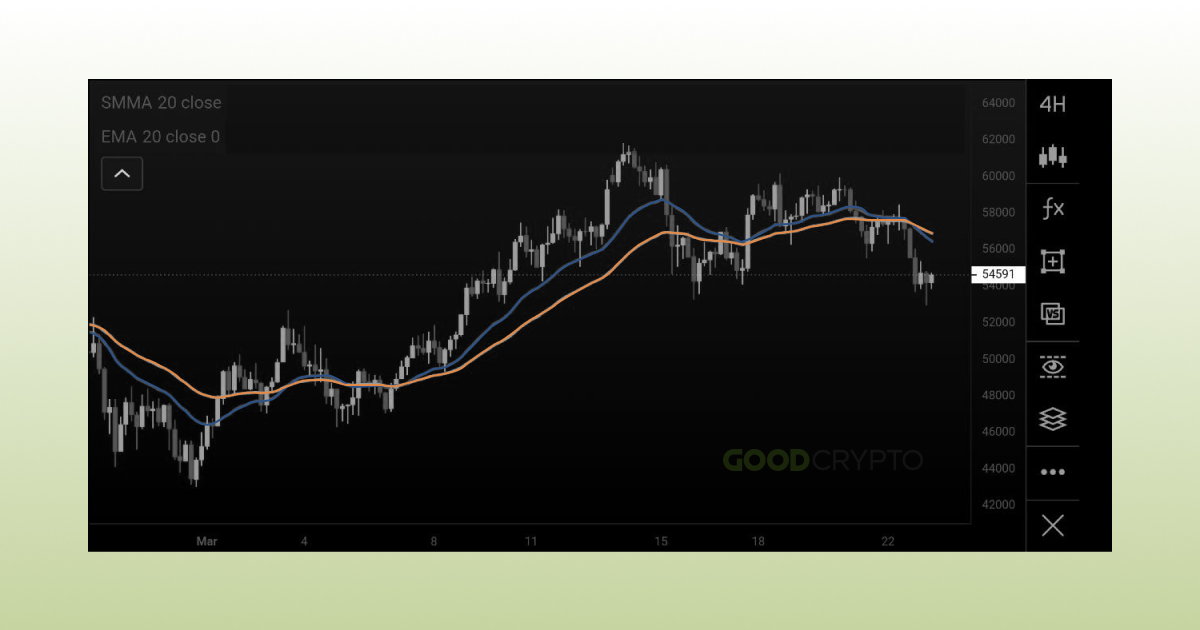
The SMMA (orange) and the EMA (blue) combined.
When using the SMMA as support and resistance, it’s important to know that the price can often flirt around the line when in consolidation. Over time, you will identify clear support or resistance signals more often. Practice will help you a lot along the way, and even with practice, you cannot create a trading system without losing trades. For this reason, it’s important to protect your portfolio and place Stop Loss orders that limit your total loss to 1% or less.
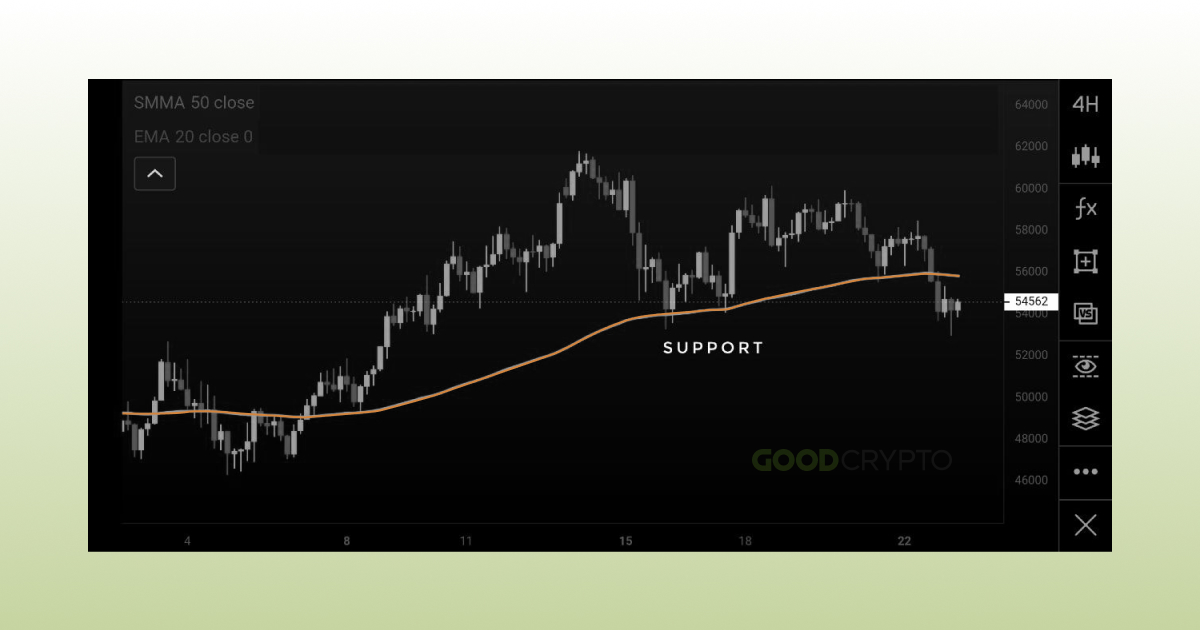
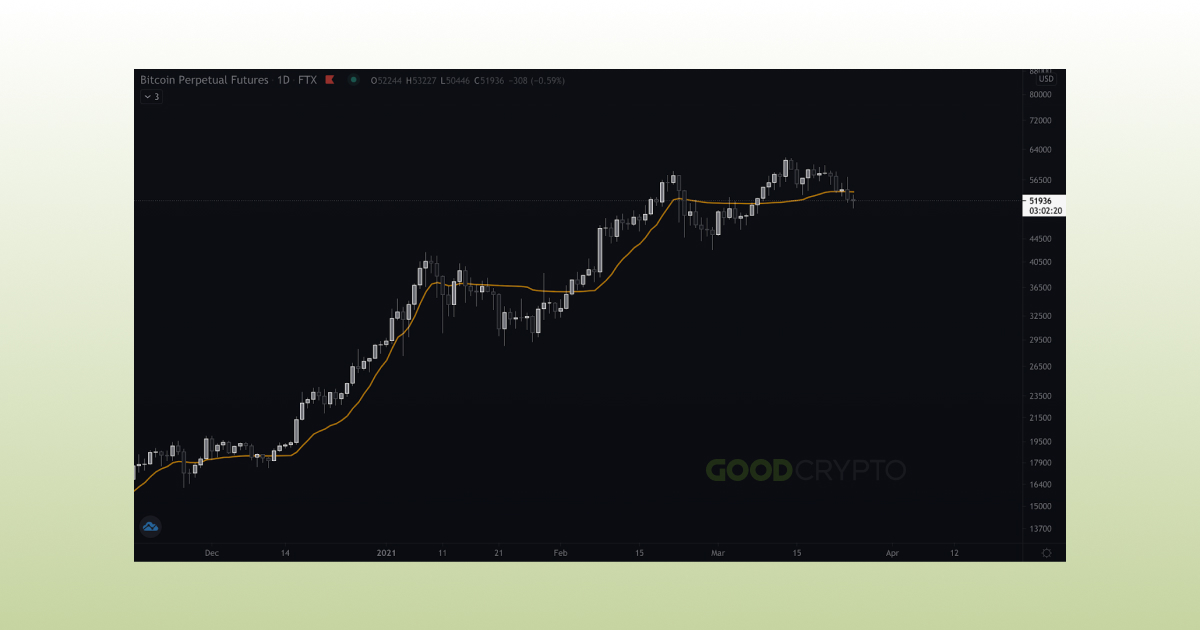
An example where the SMMA has acted as strong support, and you can place your Stop Loss order below the line. Once broken, the line will act as resistance.
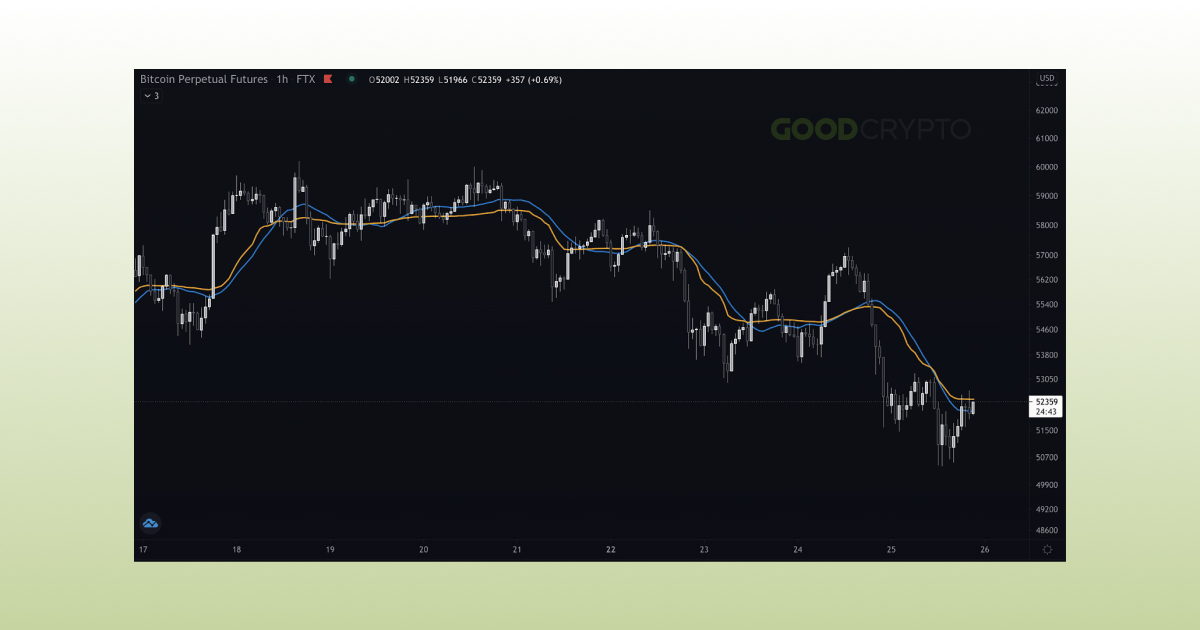
Many traders improve the SMMA trading strategy by combining it with other Moving Averages, like the EMA. Crossover signals will help you to validate if positive or negative price movement will be sustained.
Using the combination of MA’s to identify a reversal of the trend can be very effective.
Designed by Perry Kaufman, the AMA is created to act as a MA but also to measure the degree of noise and reduce it. Originally, it was meant to replace the MA, but they can still be used alongside each other. Based on the EMA, Kaufman has adapted its smoothness and adaptability with another algorithm so it moves based on reducing both the volatility and still respecting direction.
The AMA moves more stable than other MA’s and can therefore give better signals.
Trading the KAMA indicator is similar to trading the SMMA and any other MA. To use them successfully, you should understand what exactly is shown by the indicator and what this information means for you as a trader.
In the case of KAMA, it depicts the same data as AMA but as an addition, it takes volatility and noise into account. So Kaufman Moving Average can give more clarity and provide you with better trade signals because of its stable character. Cryptocurrency is extremely volatile, opening the possibility for high profits during swing trading.
The 20 KAMA shown on the daily chart of Bitcoin. It shows how noise or “ranging” of the price is being reduced in the indicator and flattened out.
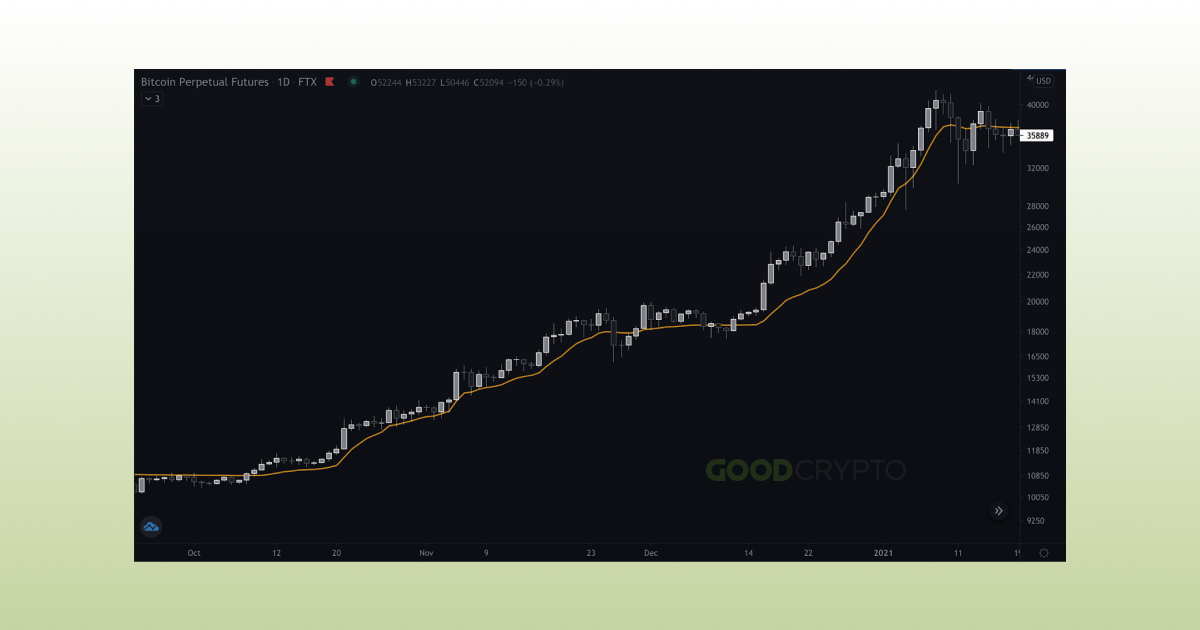
An example of how closely the 20 KAMA is following the price and acting as a support in the meantime.
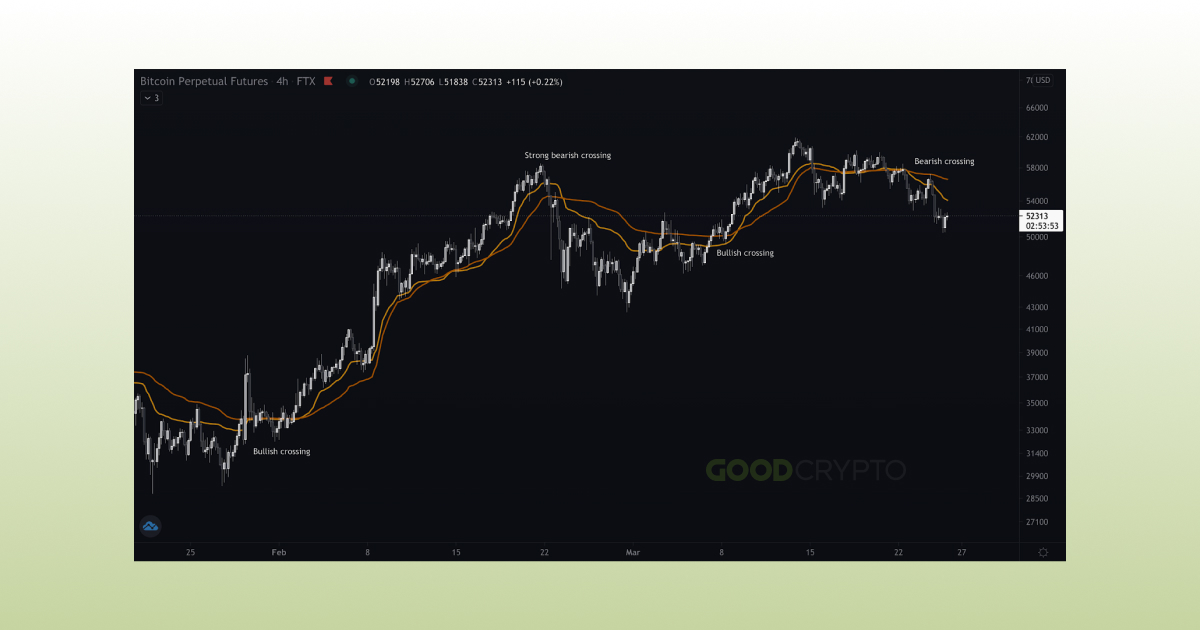
An example of how a combination of different KAMA’s can give signals. This is a 20 KAMA (yellow) and 50 KAMA (orange) on the 4H Bitcoin chart.
The signals given were profitable. When looking for a signal, you should always wait for a candle to fully close. Only when a candle closes below or above a level, it is confirmed, not before.
The blue indicator represents the traditional 20 MA, moving slower and less stable than the 20 KAMA.
The Linear Weighted Moving Average is a MA that reacts faster to recent price action by putting more weight on the most recent candle closing prices. It does this, as the name suggests, in a linear way, compared to for example the EMA that does this in an exponential way. This linear element is a difference in the calculation of the indicator, which is too technical to go into in this article.
The faster reaction to price action is what makes this indicator different from other Moving Averages. It makes for a great companion since combining it with traditional Moving Averages will show fast reactions and provide traders with signals to trade.
You can use the indicator by itself, but it will be even stronger when combined with other MA’s or oscillators like the RSI. If you want to learn how to use the RSI, please read our guide here.
The LWMA is used in the same way as any other Moving Average. It can be used as Support and Resistance, or it can be used to indicate trend reversal by crossovers.
Using the LWMA happens with the same settings as other MAs, where 10 and 20 will move closer to the price than the 50, 100, or 200 settings. These settings represent the number of previous candles used. When using the 100 or 200 settings, you can see that the price will often move further away from the indicator. This makes a crossing of the price with the indicator more significant. On the other hand, if the price is supported or rejected by the indicator, it will also mean that it is either stronger support or a stronger resistance than for example the 10 or 20 sets.
The LWMA shows a different color based on its direction.
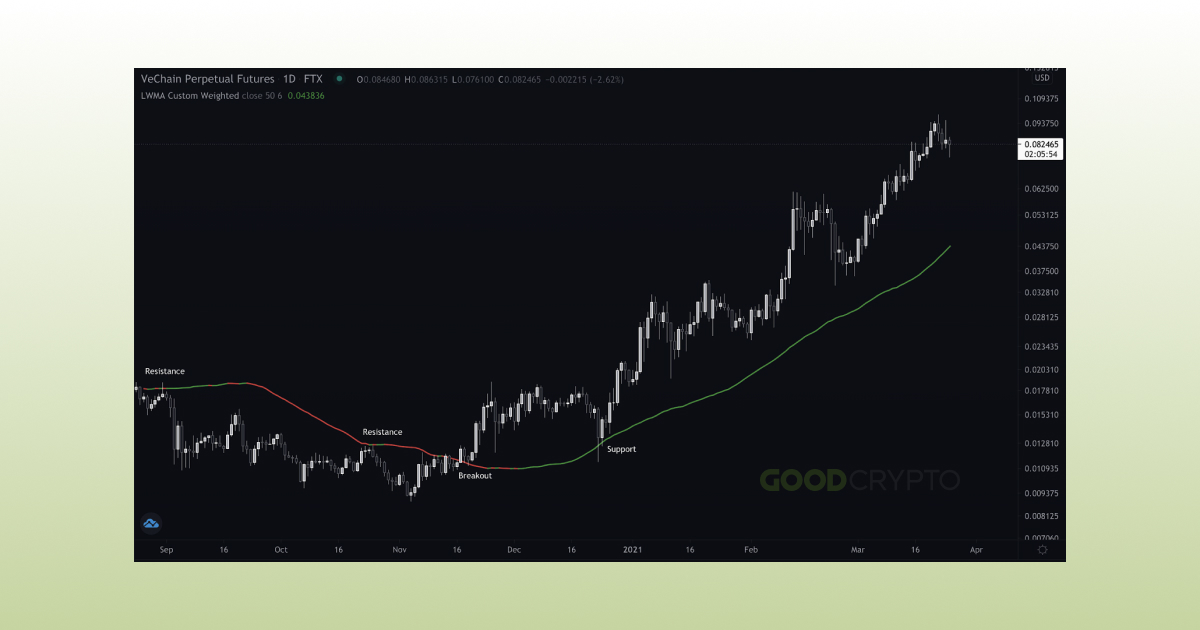
The 50 LWMA is showing its strength by being a resistance and support indicator on the daily chart of VET/USD.
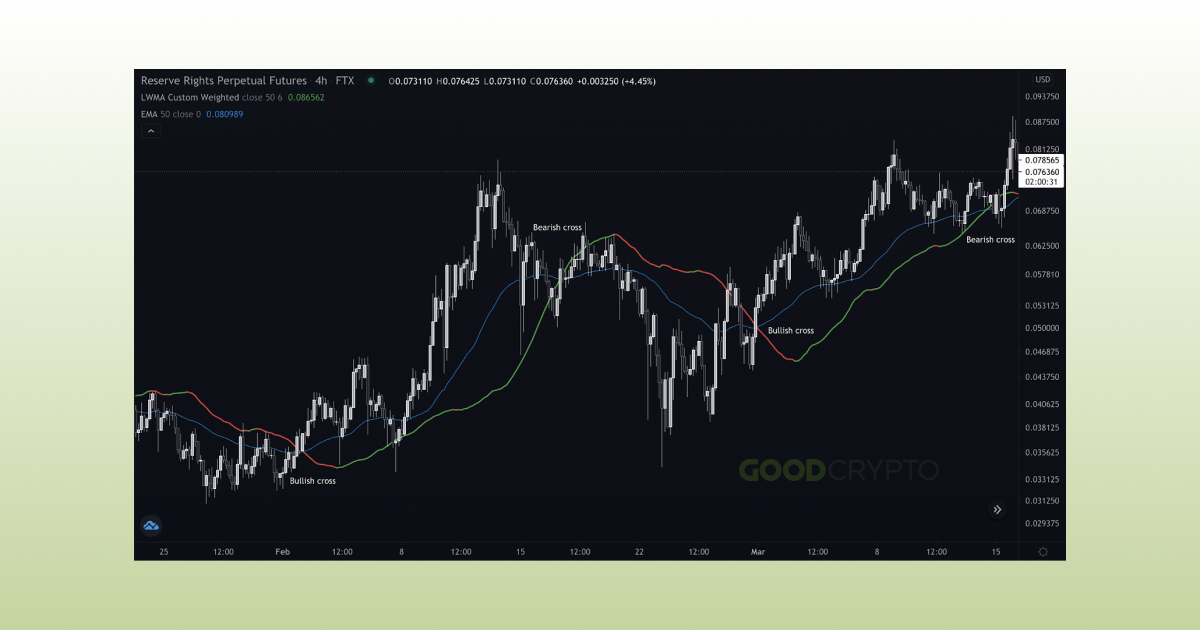
The combination of the 50 EMA and 50 LWMA provides profitable signals.
The DEMA is yet another calculation that will respond faster to price movement than the SMA or the EMA. It will be significantly faster when using the lower settings (for example 10 or 20) and it will be smoother but stronger on the higher settings (for example 100 or 200). To get a deeper understanding of what does DEMA stands for, let’s take a look at its formula. Reminder, it’s important to know how the EMA is calculated, described in our previous article.
The DEMA is calculated by doubling the EMA, making it double as fast.
DEMA = 2×EMAN − EMA of EMAN
Where: N = Look-back period, for example 10, 20, 50, 100, or 200.
The DEMA responds much more immediately to price movements, which makes the indicator more useful when swing trading and intraday trading. It will support short-term price movements seen on the 1-hour chart or anything below, like the 5 minutes, 15 minute, or 30-minute chart.
In the same way, as other MA’s, when the price is above the DEMA, it is positively trending and the indicator will act as support. When the price moves below the DEMA, it will become a resistance indicator.
Using multiple DEMA’s with different lookback periods (the candles included in the calculation, for example, 10, 20, 50, 100, or 200), can give crossover signals and point to a potential reversal in trend.
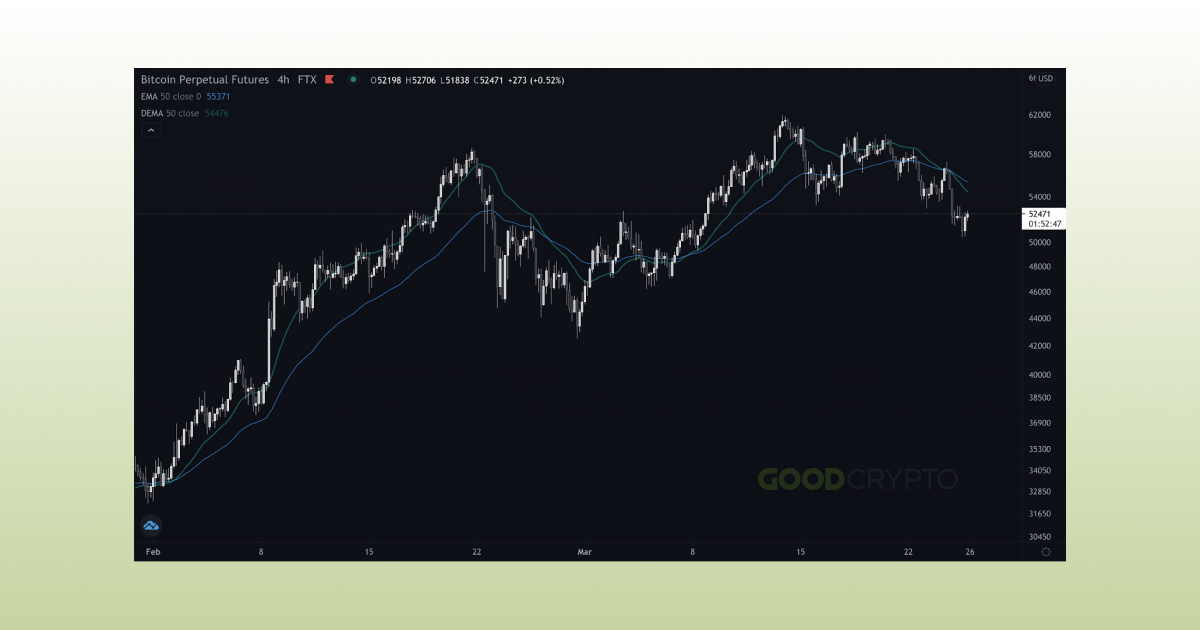
The 50 DEMA (green) showing to move closer to the price movements than the 50 EMA (blue).
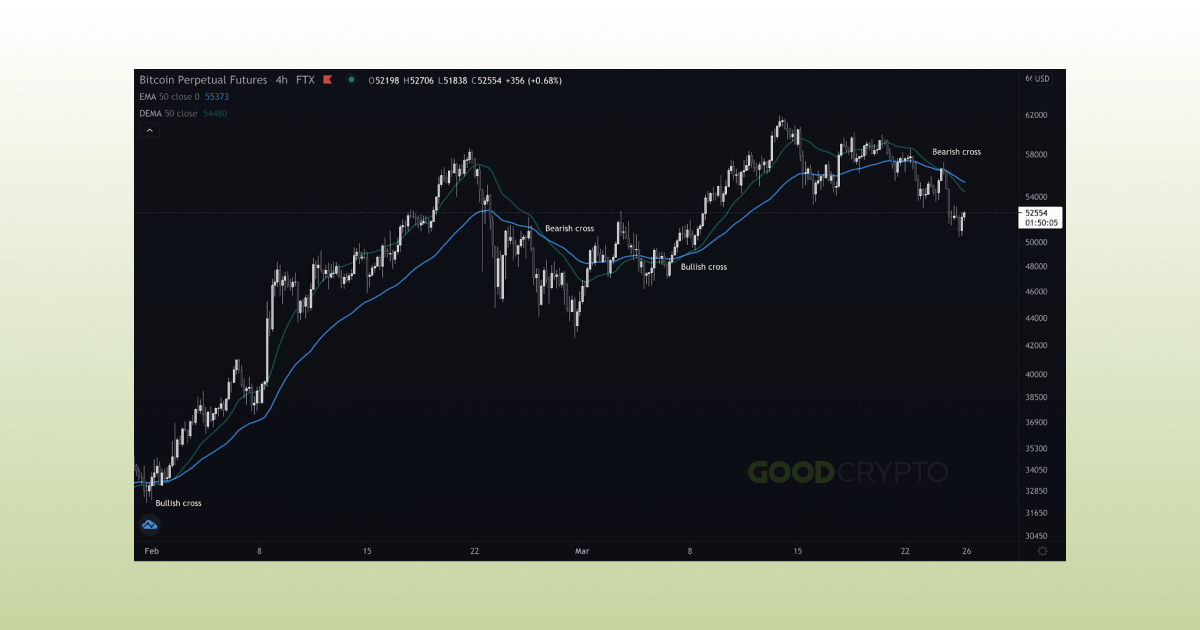
The crossovers of both these indicators create strong signals, where a bullish signal can be bought and a bearish cross can be sold.
The Triple Moving Average can be compared with the DEMA but aims to be even more responsive. This is also seen in the complex calculation, as it triples instead of doubles the calculation.
TEMA = (3∗EMA1) − (3∗EMA2) + EMA3
where: EMA1 = Exponential Moving Average (EMA)
EMA2 = EMA of EMA1
EMA3 = EMA of EMA2
The TEMA is moving even faster than the DEMA, and will also be ideal for short-term swing trading or intraday trading. It takes caution to trade based on the TEMA, since its movements are moving so closely with the price, it can give many false signals. The price will more often cross the indicator than the DEMA, and especially more often than the EMA or SMA.
Using the TEMA with a shorter lookback period like 10, 20, or 50 settings will make it very responsive to price movements. This responsiveness will be less when using the 100 or 200 settings. Combining these different lookback periods can give interesting Triple Moving Average crossovers, as seen with all Moving Averages.
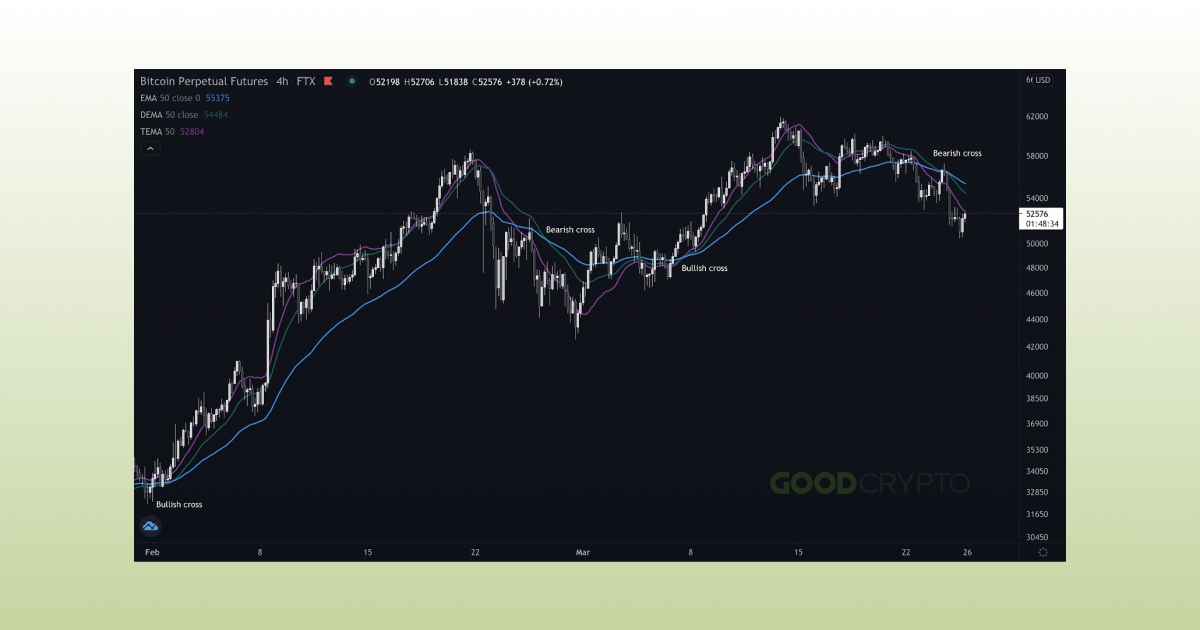
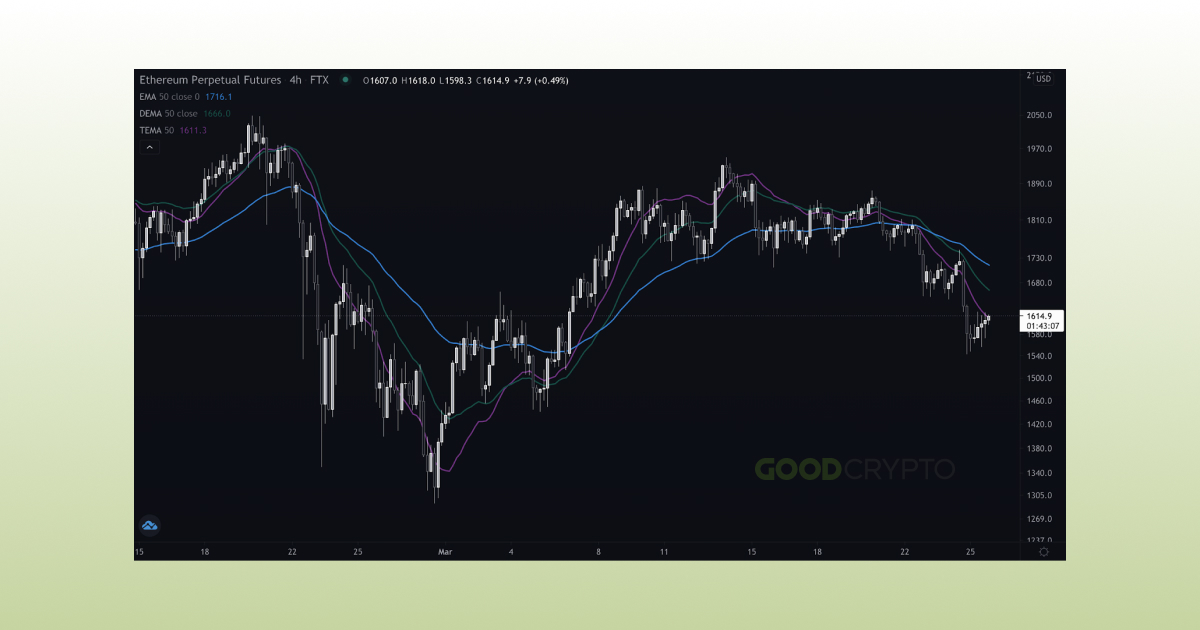
Adding the 50 TEMA (pink) to the 50 DEMA and 50 EMA, shows immediately to move faster and closer to the price movements. As a result, crossovers are faster, too.
When using three indicators at once, they become even stronger of a buy or sell signal when they all cross over each other.
The best Moving Average strategy will always depend on the preference of every trader individually. The wide range of indicators that exist can create many different signals and potential trades. It’s important to find your own strategy that works for you.
But Good Crypto is dedicated to getting you started!
That’s why a Simple Moving Average trading strategy here is presented, together with the Linear Weighted Moving Average and the Relative Strength Indicator. Learn how to use the RSI here. This is an ideal Moving Average crypto trading strategy, and specifically, it’s the best Moving Average strategy for intraday trading.
Traditional Moving Averages have a lagging effect because of being calculated based on past price movements. The wide range of special Moving Averages covered in this article is often trying to reduce this lagging effect to give traders a faster signal.
However, signals can never be completely correct, and should always be considered as possibly false. If one system would be 100% waterproof, everybody would use it.
But the more indicators are being developed and created, the more chance as a trader that you find a system that works your trading strategy, or can help you create one. It’s important to explore indicators and experiment with them. Some traders fall in love with the simplicity of Moving Averages, while others prefer other indicators.
When using tools to trade with, you want to be convinced of the platform you use. Good Crypto is a dedicated team that follows market movements closely and listens to its users. It gives you all the reason to be convinced they provide you with the absolute best advantage you can get as a cryptocurrency trader and investor.
The application combines all your exchange accounts into one place and allows you to trade anywhere you go. All your trades and cryptocurrency transactions are presented in a beautiful portfolio overview, allowing you to closely follow your performance.
Exploring over 20,000 markets on 30 exchanges, finding your next successful trade or investment becomes much easier. Price alerts and market updates will give you another way of staying up to date, and Good Crypto even keeps you informed about DeFi markets, as well as their movements specifically.
Trading itself is both simple and advanced. Without freezing your balance, an unlimited amount of orders can be placed. Programmable orders allow triggering both a Stop Loss order and a Take Profit order at the same time of opening a trade. Trailing Stop orders open up the window to have a trade run freely, and follow the trend as long as possible. Trading algos automate your trading routine and allow you to trade 24/7. Finally, the basic functionality of Good Crypto is completely free.
Find Good Crypto on both the iOS App Store and the Android Play Store and discover the most advanced cryptocurrency application on the market!
Do you have questions?
Connect with the public chat room in Telegram and ask anything, 24/7.


Share this post:
March 6, 2022

We’re proud to be the first to launch a DCA bot for DEXs! Enjoy the same DCA trading experience you’re used to on CEXs but with no technical limitations.

Discover the power of MEXC with GoodCrypto! Advanced tools like bots, trailing stops, and smart TA signals and TradingView webhooks at your fingertips.

Dollar Cost Averaging (DCA) bot has become an increasingly popular trading tool due to its convenience, the versatility of its modes, and trading efficiency....

Dollar Cost Averaging (DCA) bot has become an increasingly popular trading tool due to its convenience, the versatility of its modes, and trading efficiency....