
There are people in the trading world whose success cannot be explained by mere talent. Bill M. Williams – the creator of the Awesome Oscillator and several other indicators – is one of those people call a phenomenon, a miracle, and a genius.
In this article, we will break down what is Awesome Oscillator, figure out how it works, and try to understand strategies, including the AO indicator in action.
However, considering what a unique and insightful approach Bill Williams has been employing throughout his trading career, it is paramount to comprehend the trading philosophy that led to the creation of the Awesome Oscillator.
Williams’ trading style revolves around the idea that markets are unpredictable and that individual traders should focus on trading patterns and trends rather than attempting to predict future market movements. He believes that trading is a chaotic process and that chaos theory can be used to gain an edge in the markets.
So, now that we know the mindset of the person developing the Awesome Oscillator let’s jump into the indicator itself!
What Is the Awesome Oscillator Indicator?
The Awesome Oscillator (AO) is a momentum indicator that generates reversal signals for the current trend.
The loud name “Amazing Oscillator” does not fully convey the admiration the author tirelessly expresses to his offspring. He says this is the best-ever momentum indicator for the futures and stock markets. Note that the Awesome Oscillator is a universal technical indicator that works equally well in the currency, stock, indices, and crypto markets.
What does the Awesome Oscillator measure? The AO indicator was initially designed to measure market momentum. However, many traders apply it to identify trend directions.
The Awesome Oscillator Formula
Even though you will probably never have to calculate the Awesome Oscillator manually, the mathematical approach behind the indicator may help you see the big picture.
The Awesome Oscillator calculation is quite straightforward: the 34-period SMA is subtracted from the 5-period SMA.
Our comprehensive guide on Moving Averages mentioned that “the SMA line is calculated based on the closing price of a period.” Indeed, the equation of the SMA derived from the closing price of a candle is one of the most common approaches. Still, in the case of the AO indicator, the used 34-bar and 5-bar SMAs are measured by the arithmetic average of highs and lows for the selected timeframe – a median price in short.
MEDIAN PRICE = (HIGH+LOW)/2
Now the Awesome indicator formula goes as follows:
AO = SMA(Median Price, 5) – SMA(Median Price, 34)
How to Read Awesome Oscillator?
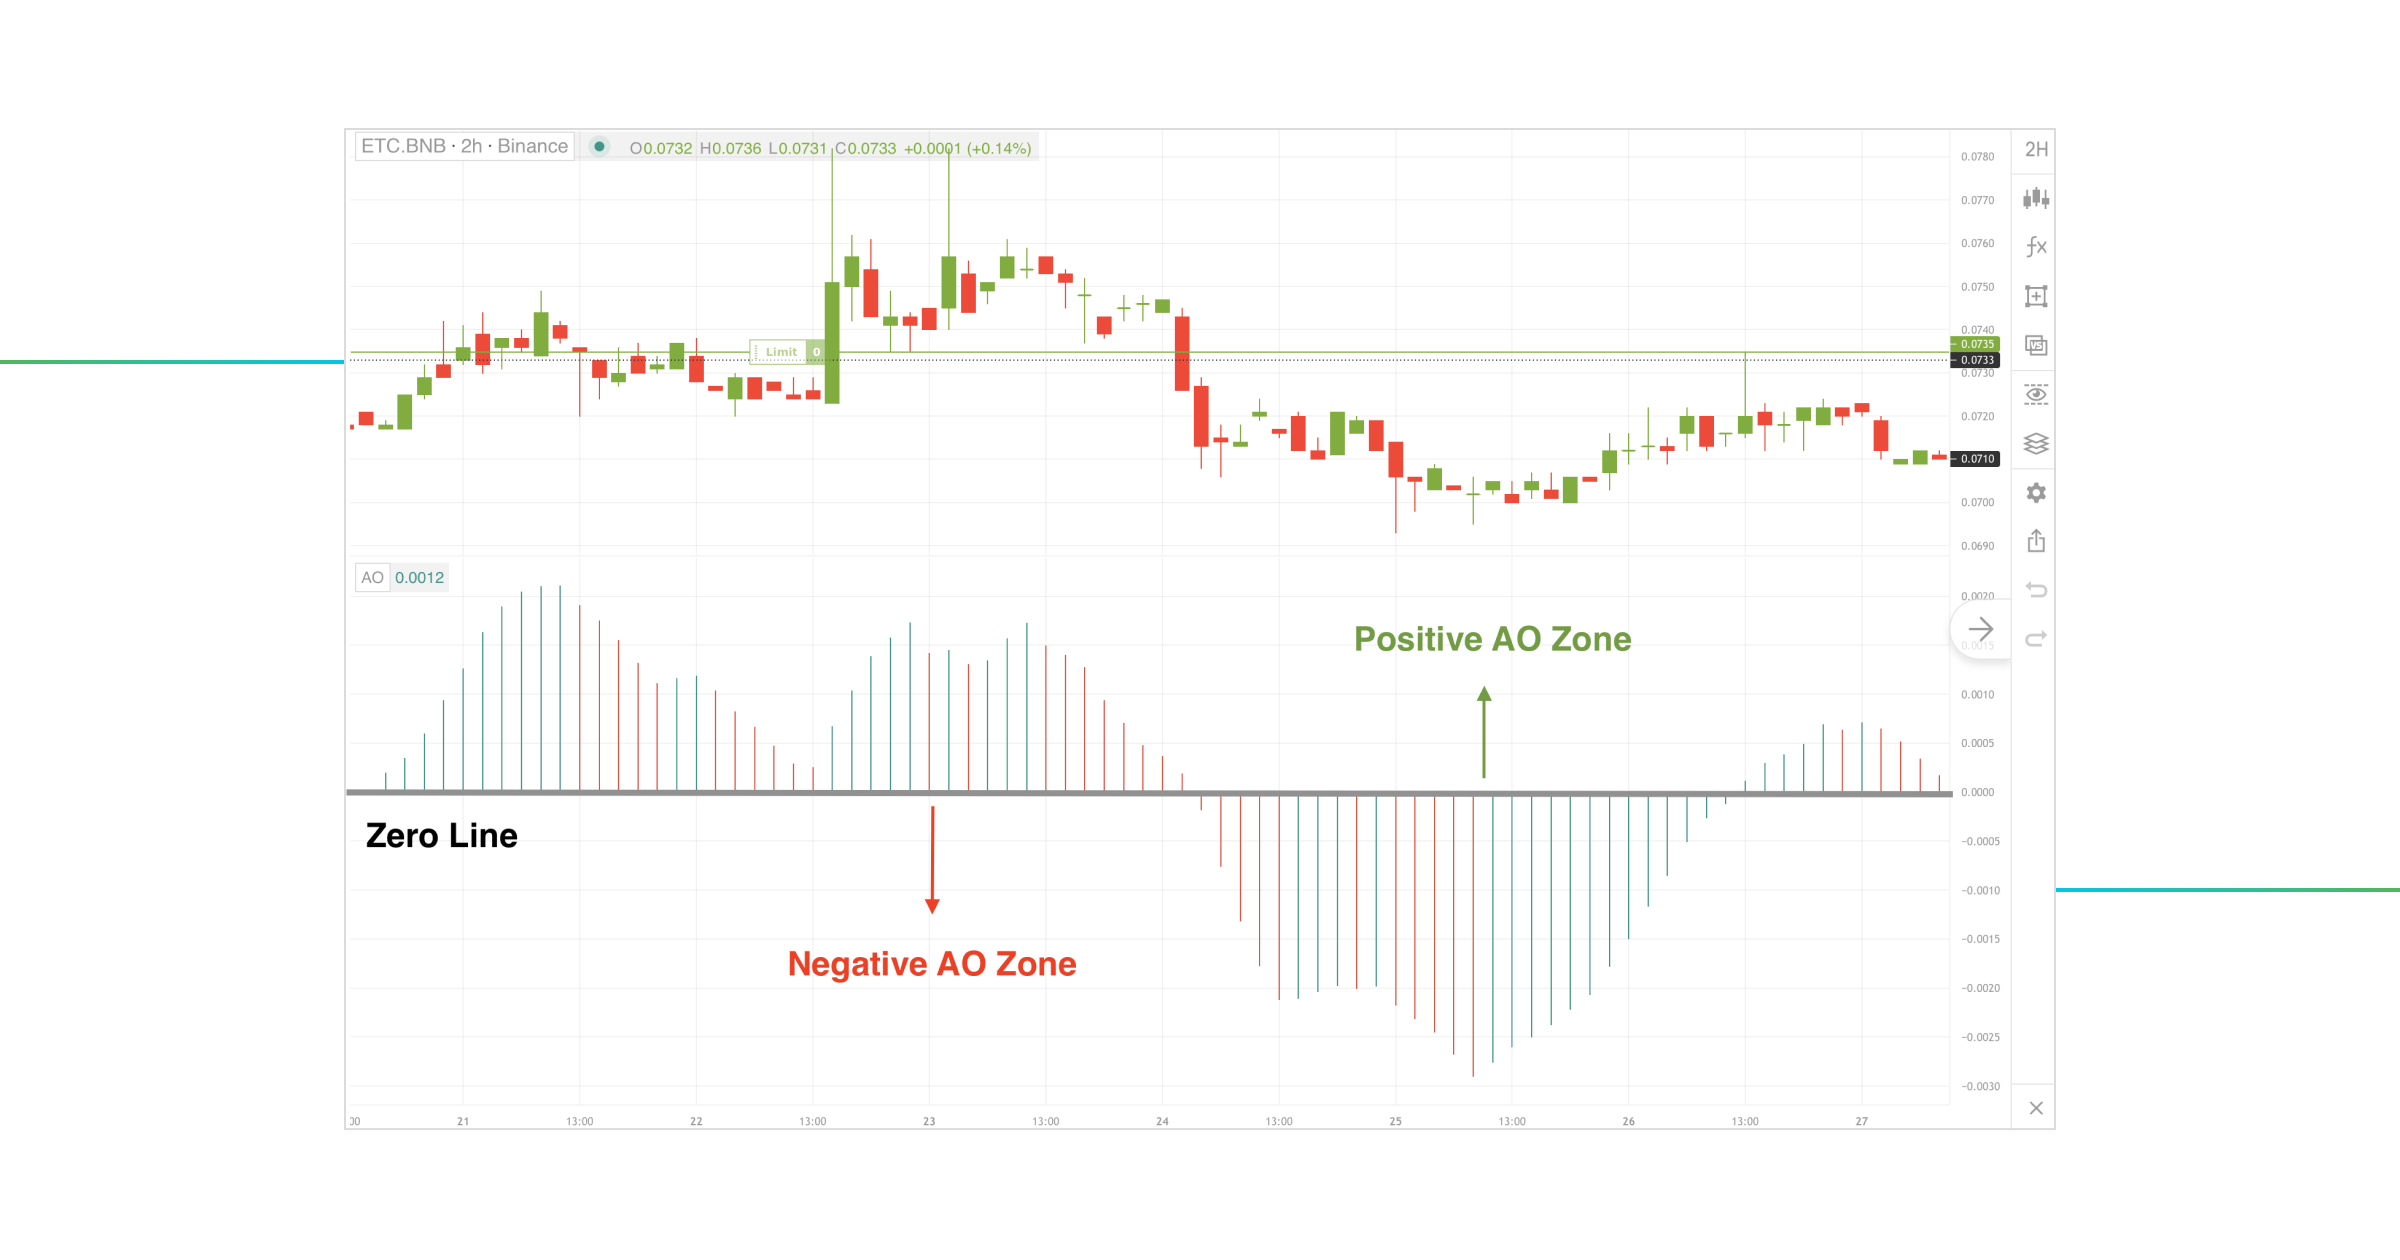
Depending on your trading platform, the variation between the two Simple Moving Averages is generally plotted in a colored histogram, which a Zero Line separates.
From now on, to observe the AO indicator, we will be using the GoodCrypto trading platform, which is available in both desktop and mobile (Android & iOS) versions.
Now, back to the AO histogram. When using the indicator with standard settings, the bars that increase in value are green; when they decrease, they turn red. You can adjust the colors easily in the AO settings. Our trading app is pretty simple and requires no explanation:
The histogram bars can oscillate above or below the zero value, depending on whether the fast SMA (5 bars) is above or below the slow SMA (34 bars). The AO will be positive in the first situation since its bars are above the 0 level. The AO indicator will be negative in the second scenario since the bars are below the 0 level. As the trend increases, the moving averages shift more from each other, which triggers the histogram bars to stretch further up or down (suggesting bullish and bearish trends, respectively).
The Awesome oscillator is boundless, unlike the Stochastic Oscillator, which oscillates between 0 to 100.
Awesome Oscillator Settings
It may surprise you, but the AO indicator has fixed parameters (5 SMA & 34 SMA) that cannot be changed. Why so? – No particular reason that we know of. This Awesome Oscillator secret Bill Williams decided to keep to himself.
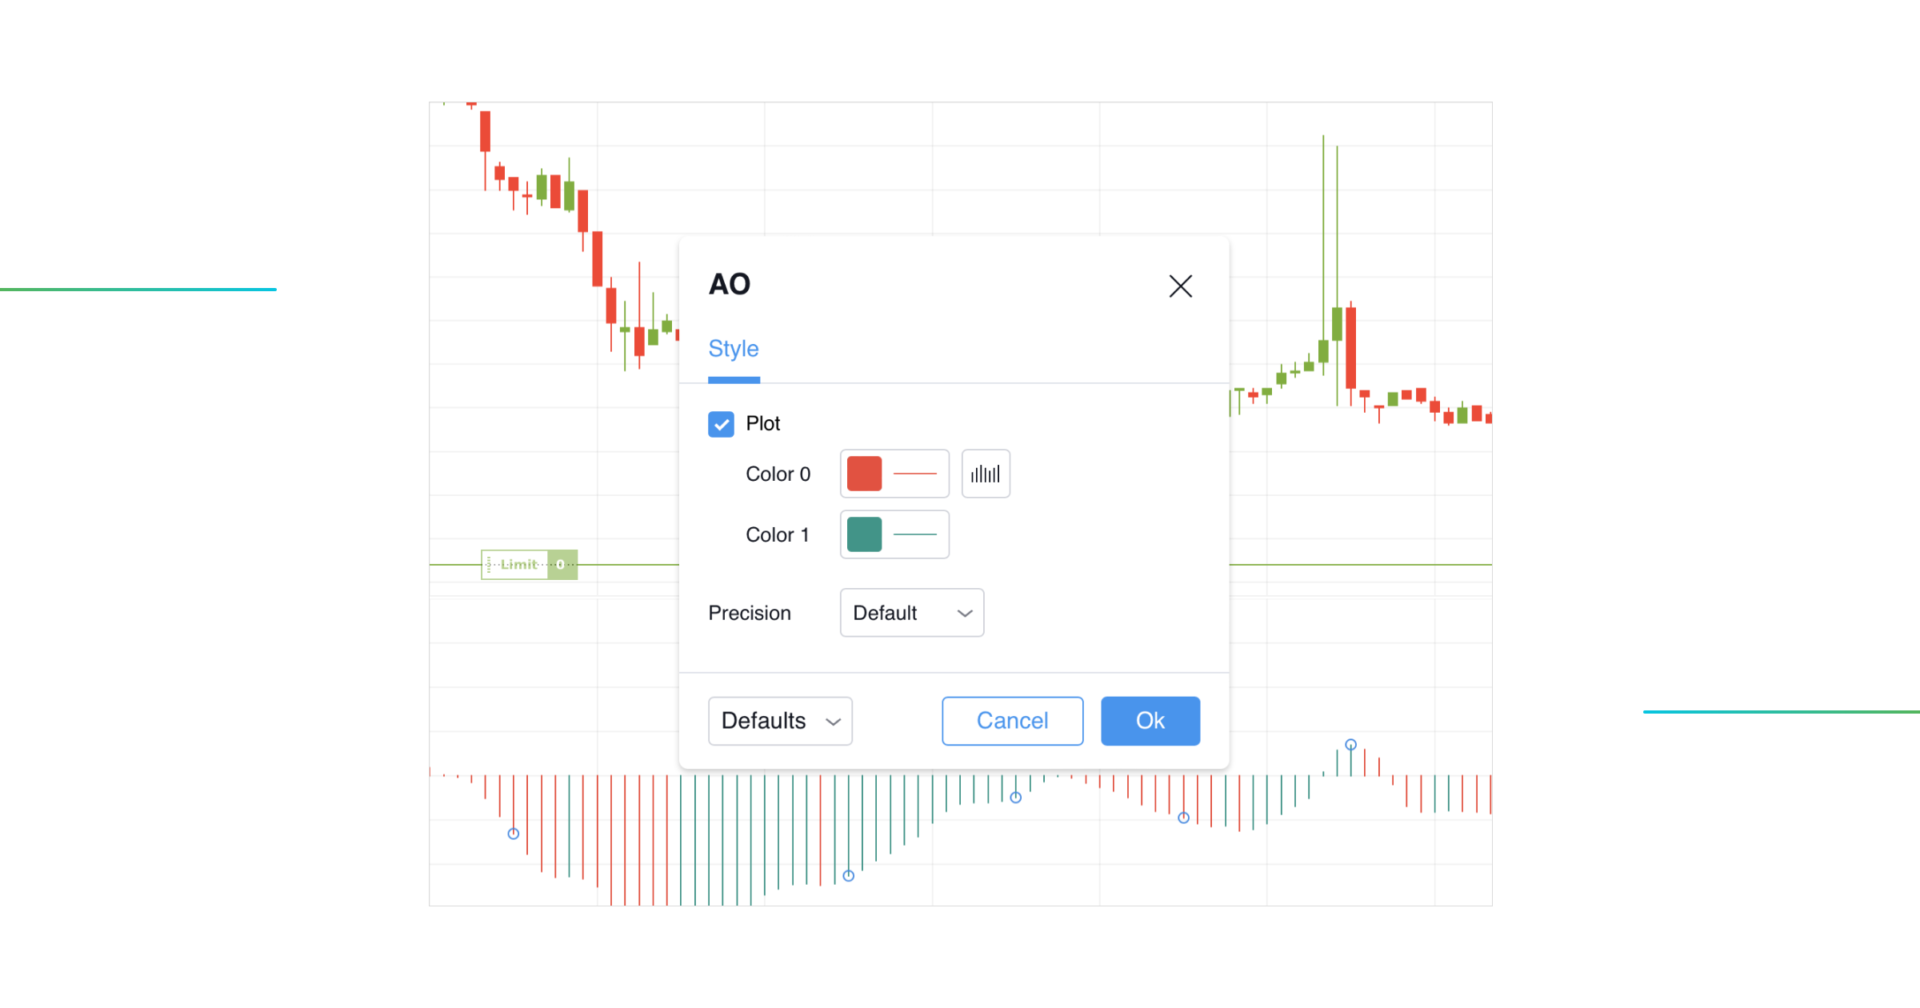
The GoodCrypto trading toolbox allows you only to change the colors used in the histogram and a precision (a setting that helps you adjust the number of decimal digits in the script’s plotted values).
Moreover, TradingView – one of the most widely utilized trading platforms among traders and investors – has a built-in AO indicator, the key parameters of which can not be adjusted in any way except the time frame.
So, if you were wondering what the Awesome Oscillator’s best settings were, the answer is straightforward – the default ones, for sure!
How to Use Awesome Oscillator? Top 5 Trading Strategies Explained
The Awesome Oscillator is a promising addition to your technical analysis based on the info above. The only thing we still need to cover is how to use the Awesome Oscillator.
Now that we have all the fundamentals of the Awesome Oscillator explained, let’s move on to the five most profitable strategies you can test out using the AO indicator alone.
Awesome Oscillator Strategy #1: Zero Line Crossover
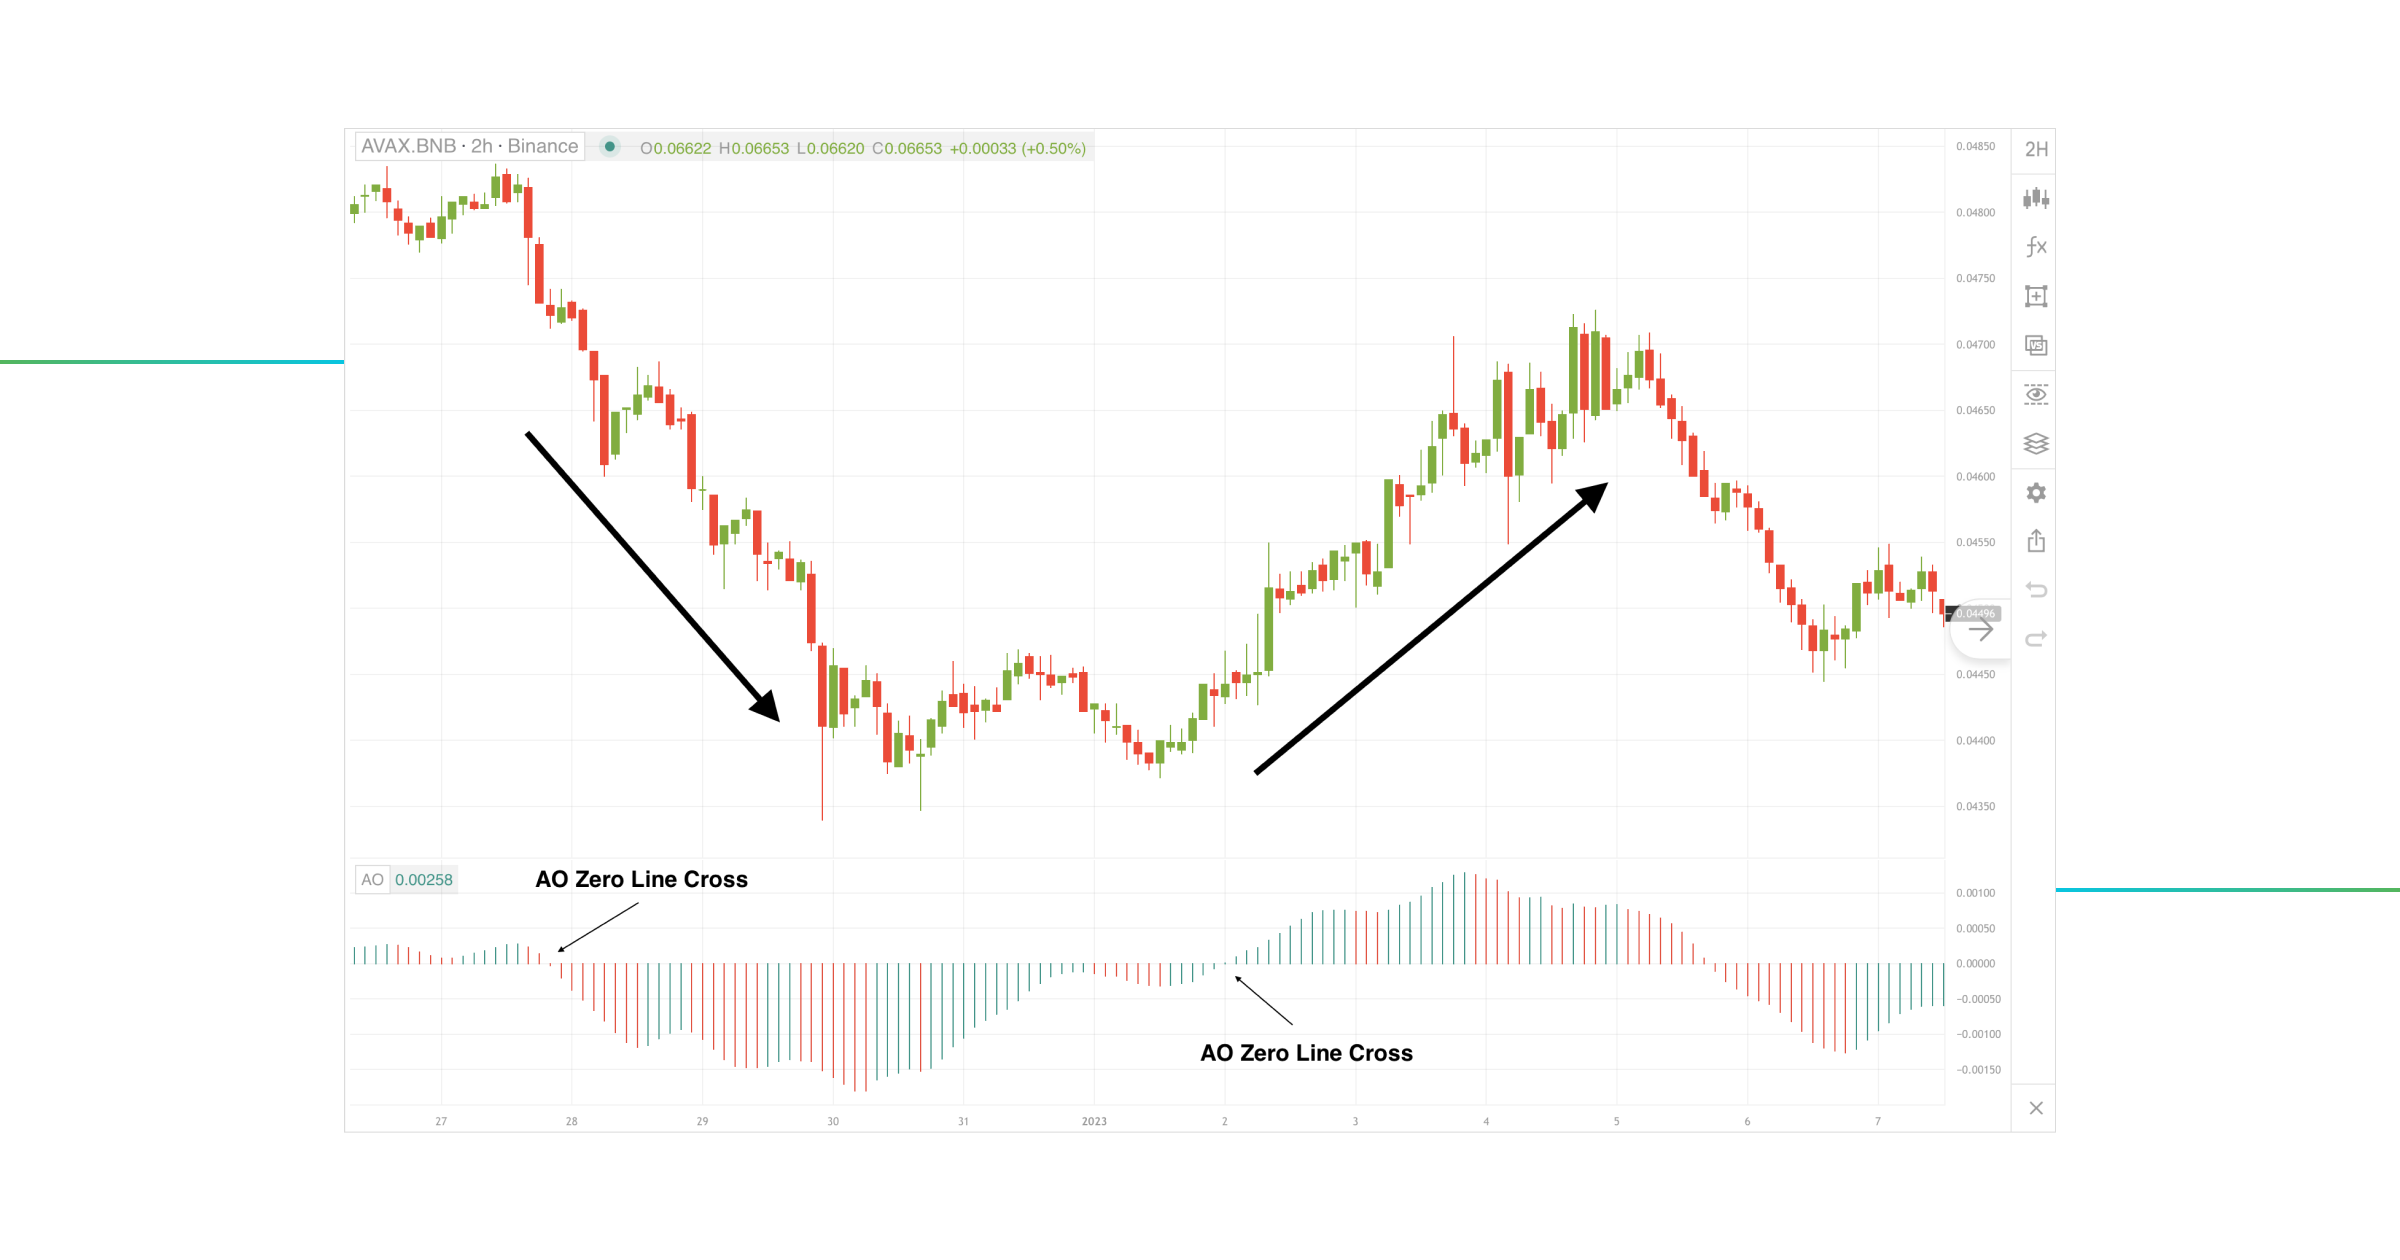
The easiest way of using the Awesome Oscillator is the Zero Line Crossover strategy. This signal is the simplest and least trustworthy of the five techniques discussed in this article.
A Zero Line Crossover demonstrates a shift in the market momentum. A Buy Signal is stated when the AO histogram breaks the zero line from the negative zone (below 0) to the positive zone (above 0). Whereas a Sell Signal is stated when the histogram breaks the zero line from above Zero Line and moves on to the negative zone (below 0).
Some of you might think it can be profitable to buy every time it breaks above and sell every time it drops below. In theory, it is, but you should not trust any single AO indicator without confirmation.
Awesome Oscillator Strategy #2: Awesome Oscillator Saucer
A “saucer” is the title of the second Awesome Oscillator method we will cover. The pattern consists of three continuous bars: extremes almost the same height but taller than the one in between.
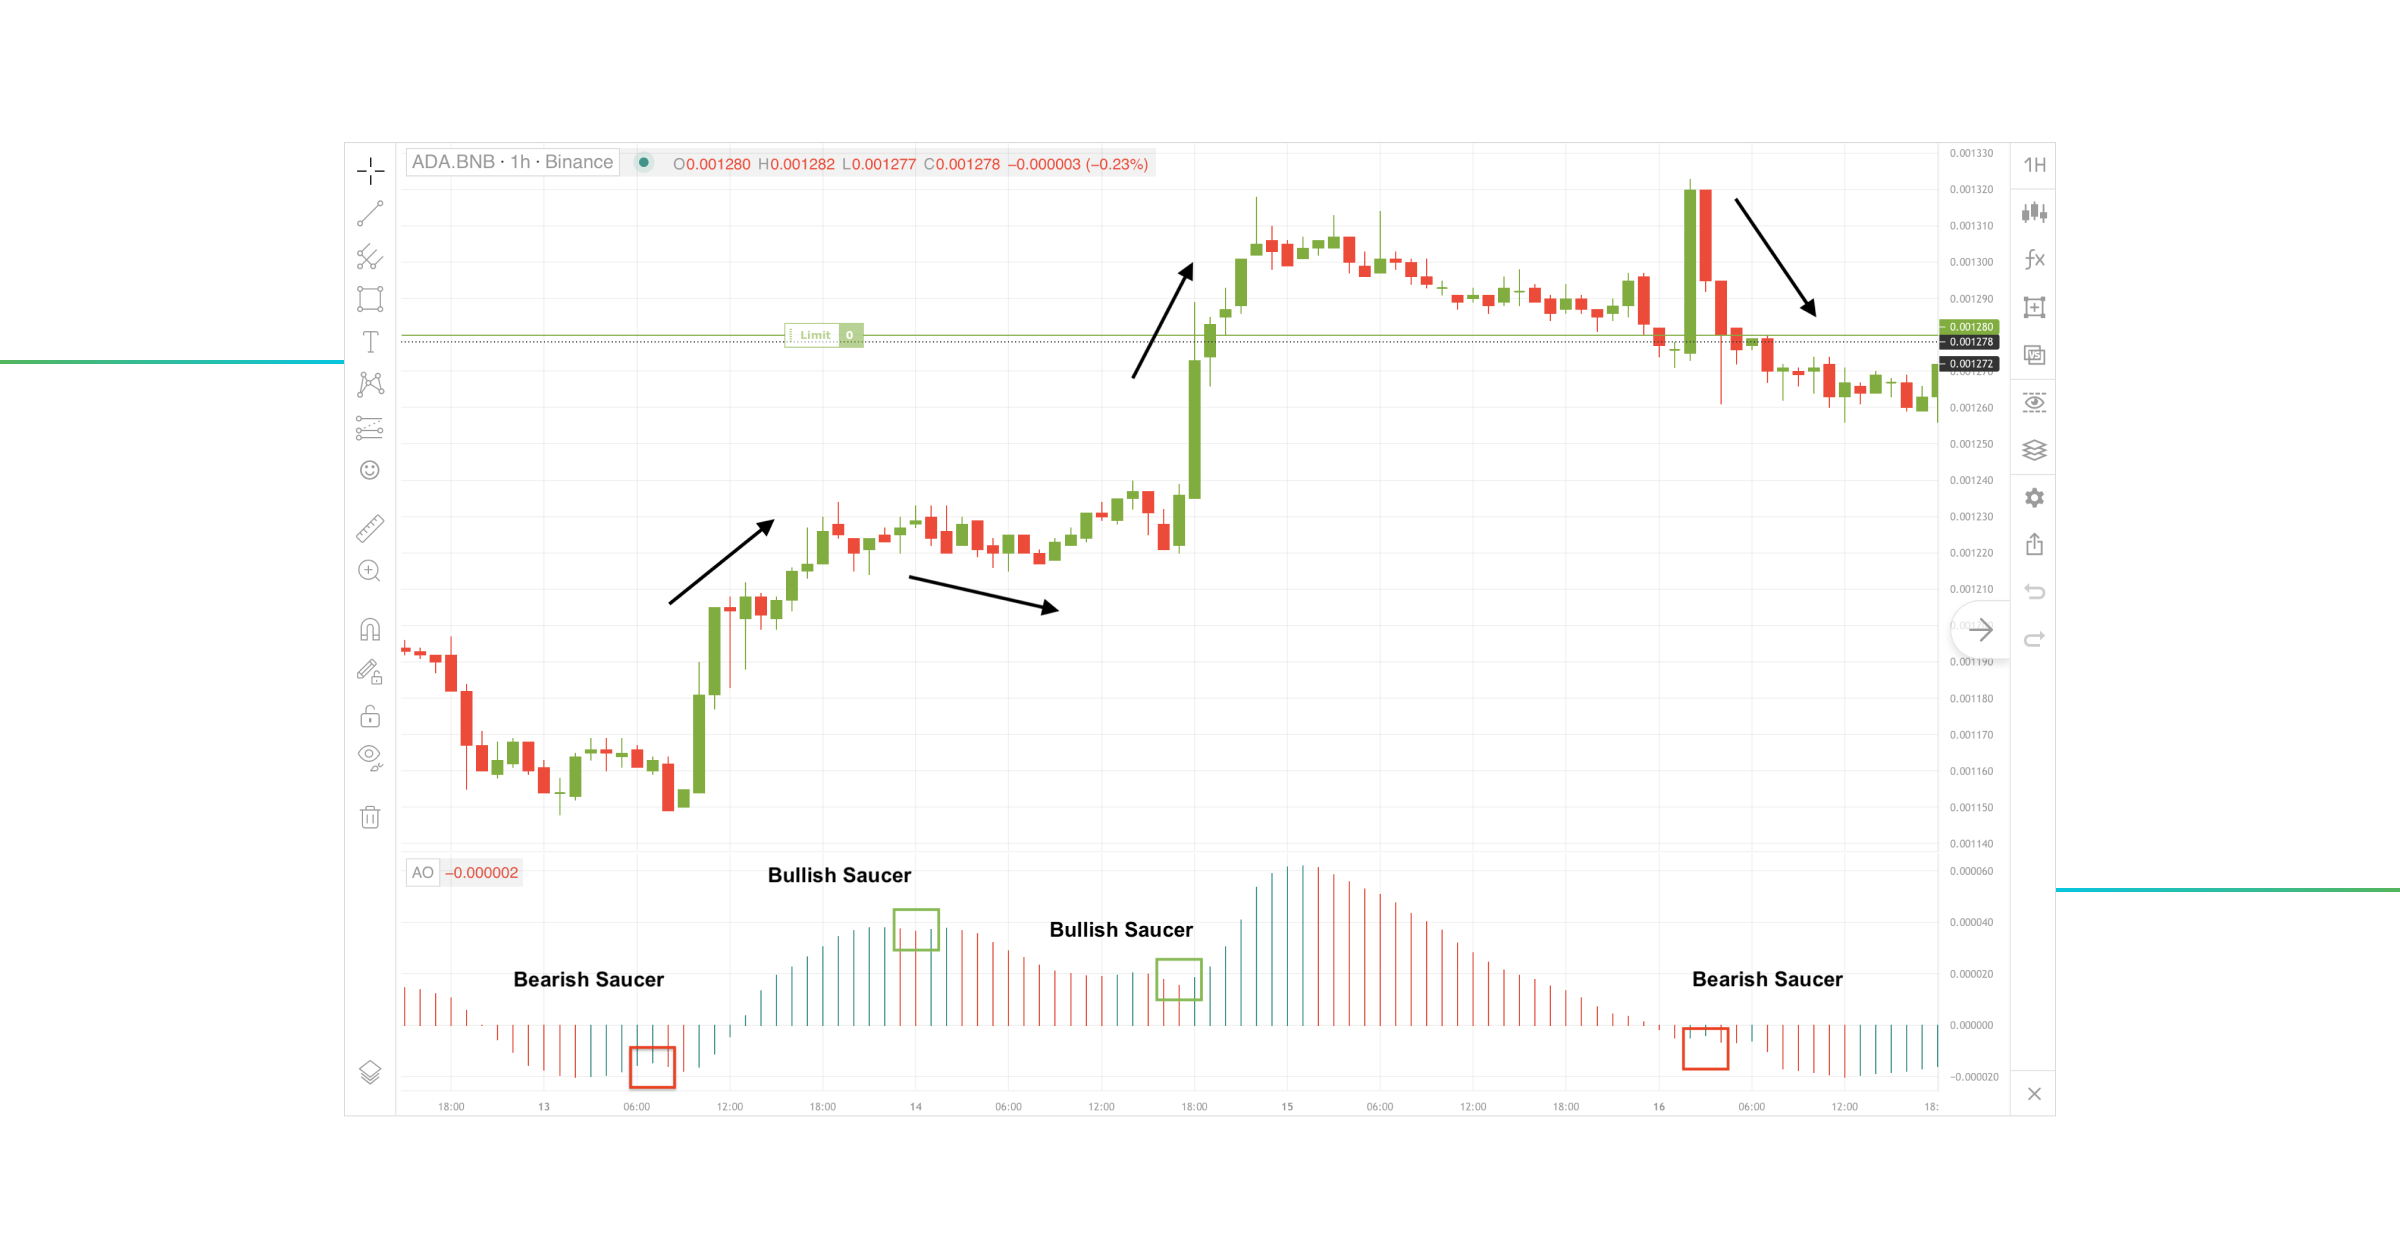
Bullish saucer conditions (Buy Signal):
- AO above zero line
- 2 consecutive red bars followed by a green bar
- the order is placed on the open of the 4th bar of AO
The bearish saucer formation implies that the price momentum will shift and that position can be entered.
Bearish saucer conditions (Sell Signal):
- AO below zero line
- 2 consecutive green bars followed by a red bar
- the order is placed on the open of the 4th bar of AO
The bullish saucer pattern, also known as the “inverted saucer,” suggests that the market’s downturn will likely last and is a solid sell signal.
Awesome Oscillator Trading Strategy #3: Twin Peaks
Awesome Oscillator Twin Peaks is the second strategy that should absolutely be tried out by any trader getting to know the indicator.
Two consecutive highs or lows form the Double Awesome Oscillator strategy on the price chart, and the second must be closer to the Zero Line than the first. This histogram pattern demonstrates actual divergence and can only be achieved when both peaks and the trench between them reside in the same zone of the zero level, either positive or negative.
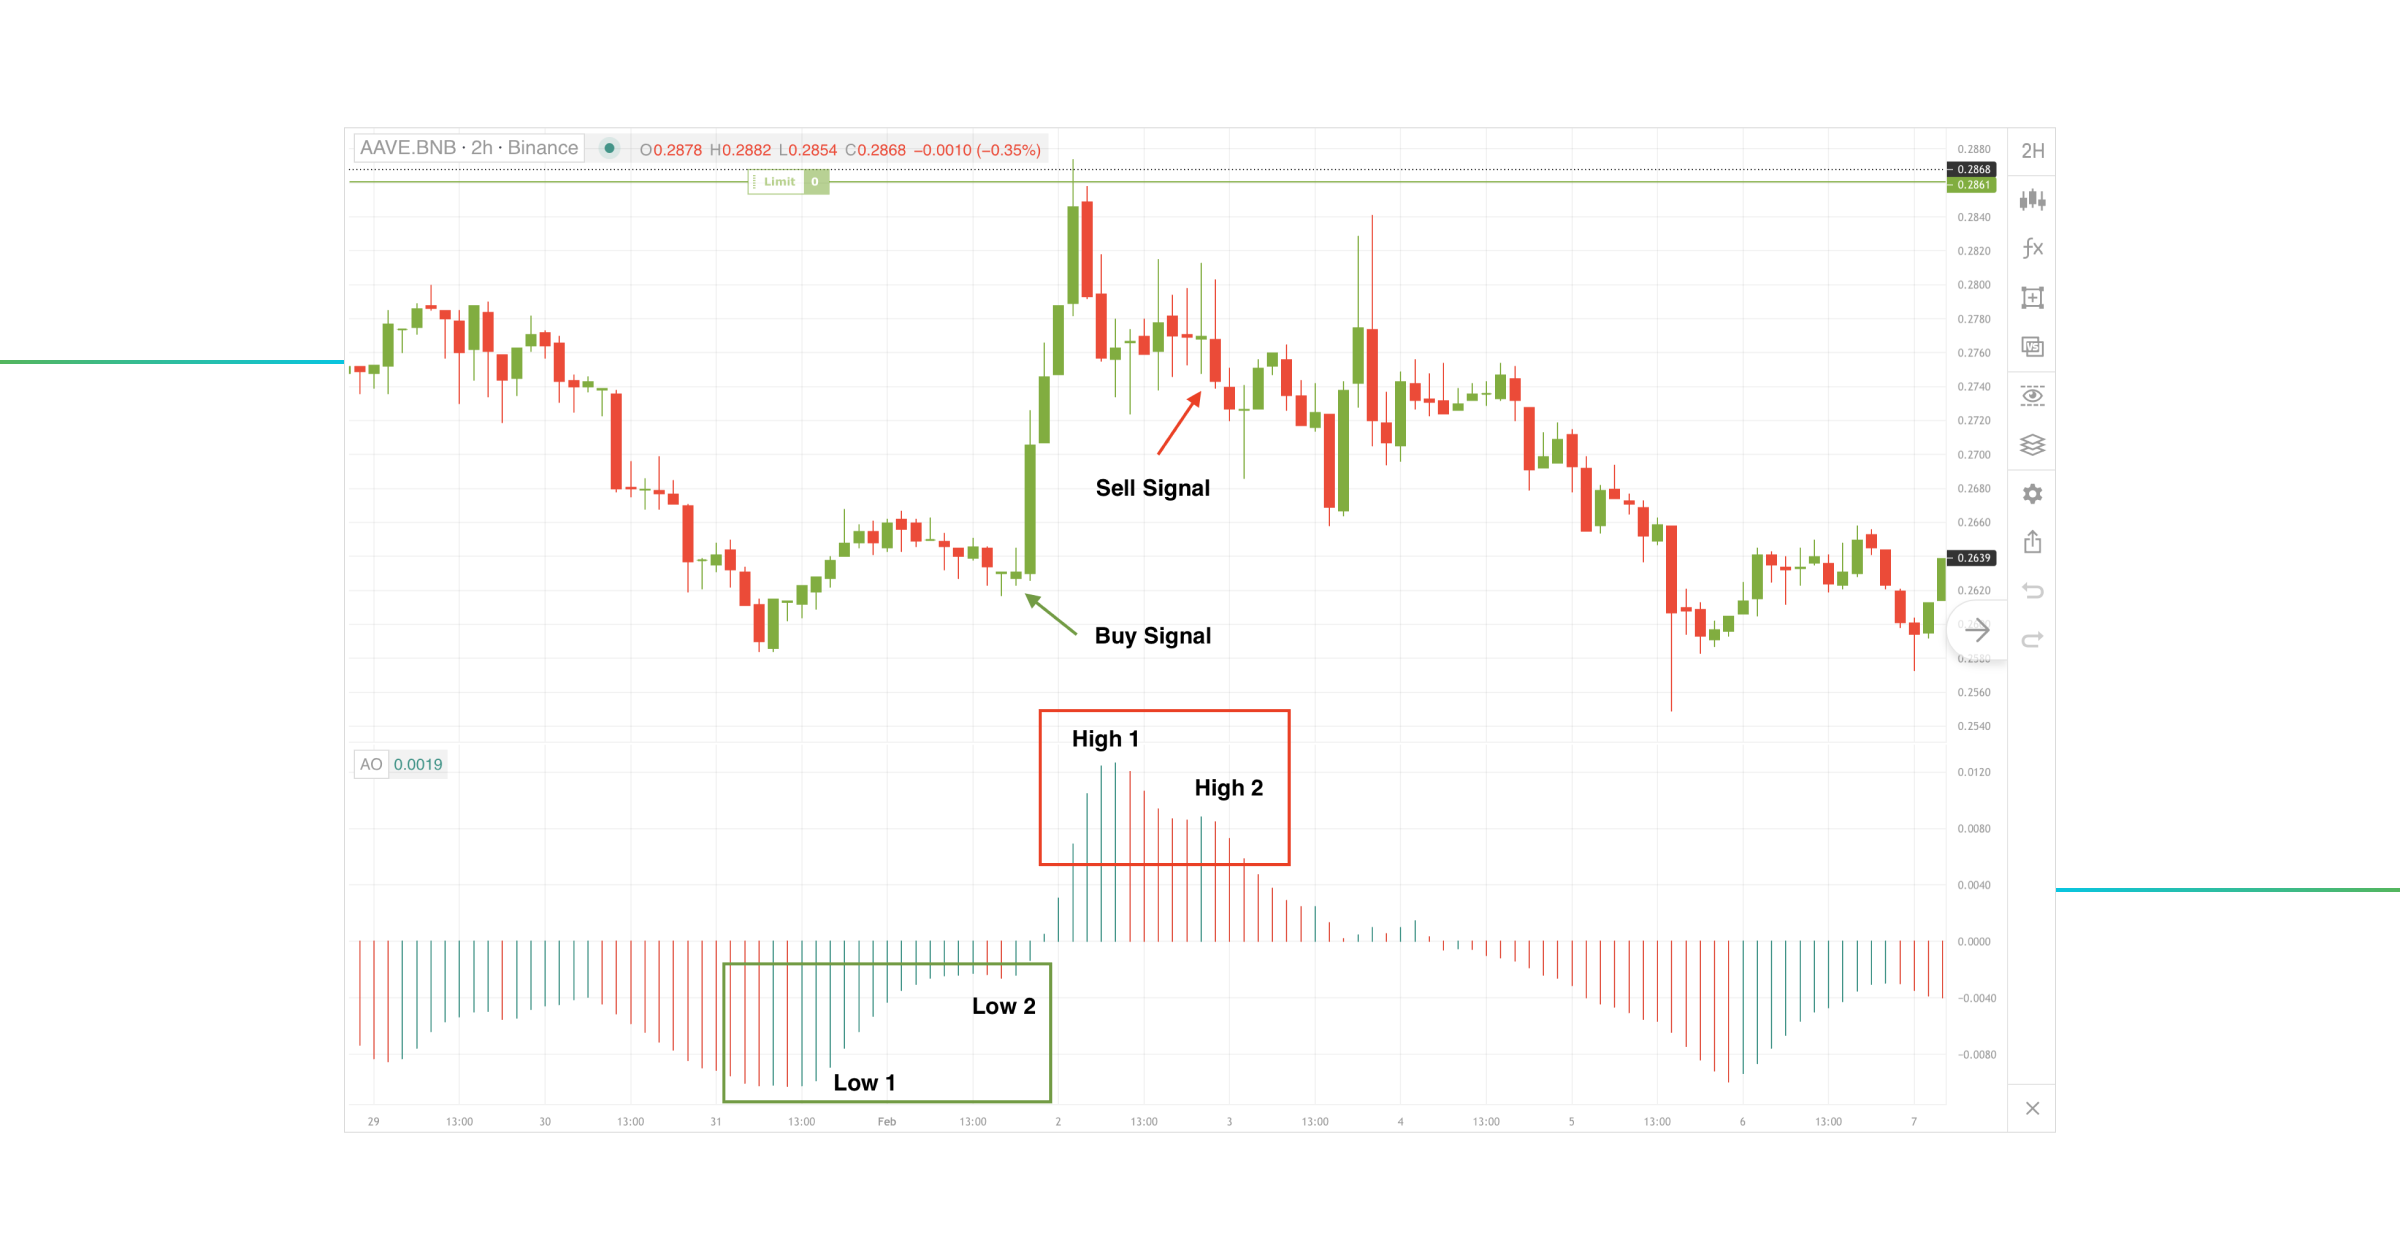
The AO indicator suggests a Sell Signal when two consecutive spikes in the positive zone forms. The essential part of this signal is that the second spike (High 2) should be lower than the first one (High 1), and the histogram between these two extremums is above the Zero Line. Otherwise, the signal is canceled.
A similar pattern can also be used to open a long position in case of a double bottom and a divergence. The indicator showcases a Buy Signal when building construction of two consecutive bottoms (Low 1 & Low 2) below the Zero Line, the second being closer to the Zero Line. This pattern informs that the trend is about to reverse.
Awesome Indicator Strategy #4: Awesome Oscillator Divergence
The divergence in day trading occurs when there is a discrepancy between the price direction of an asset and the oscillator. For example, a divergence occurs if the asset’s price rises and the oscillator falls. Conversely, there is a convergence if the price drops and the oscillator increases.
The Bill Williams’ Awesome Oscillator can successfully assist in determining divergence as any other oscillator. Notice how in the example below, the price of the BTC/USDT pair is rising while the AO is losing momentum.
Day traders may use the Awesome Oscillator Divergence indicator to identify potential trades, as it can be used to spot possible reversals in price trends. For example, bearish divergence suggests a price to most likely balance itself, meaning that long positions should be closed. On the other hand, bullish divergence indicates that a trader should quit any short positions.
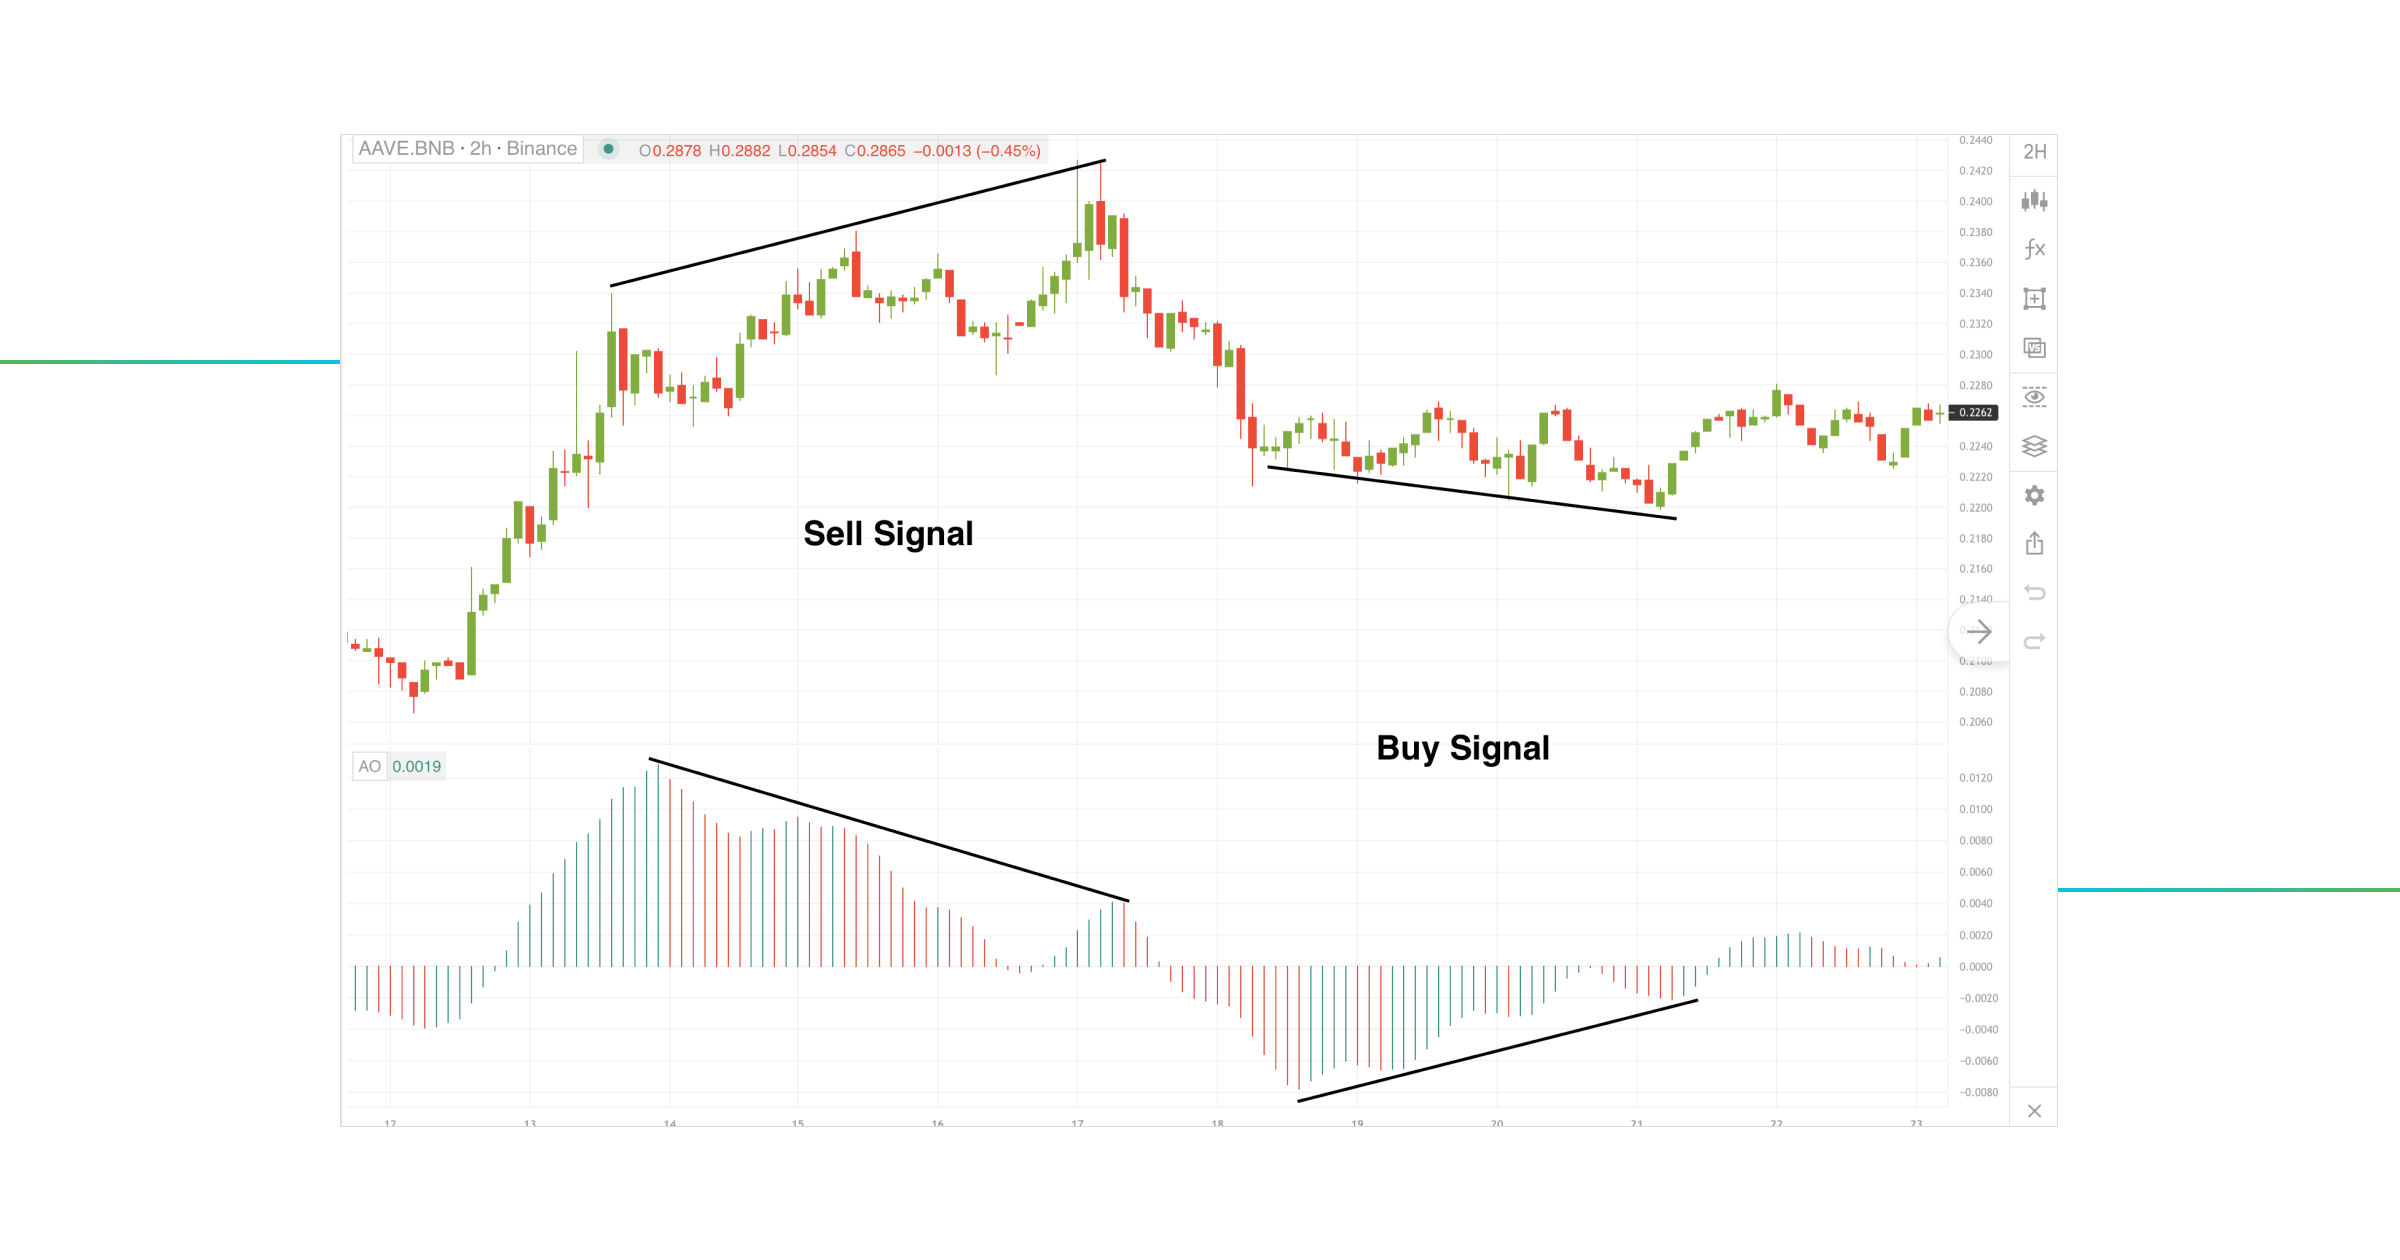
- A Sell Signal occurs when the asset’s price shows Higher Highs, while the Awesome Oscillator makes Lower Highs – this is called a Bearish Divergence.
- A Buy Signal occurs when the asset’s price forms Lower Lows, while the Awesome Oscillator creates Higher Lows – this is called a Bullish Divergence.
Awesome Oscillator Strategy #5: Awesome Oscillator Scalping Strategy
Scalping is a trading method that focuses on achieving relatively small profits regularly. It entails initiating and closing a trade many times during the day, generally for a few pips profit.
This strategy may be utilized in any time frame, although it is most beneficial in smaller time frames, such as the 1-minute chart. While there is no such thing as “the best time frame for scalping,” the time period between one and fifteen minutes is the most prevalent. As a scalping indicator, the Awesome Oscillator assists in capturing asset momentum, especially when combined with other technical indicators.
The Awesome Oscillator scalping method works by detecting areas when the indicator diverges from the price movement, at which point a trader may profit from the price momentum. To maximize gains, traders should initiate the trade inside the range of the divergence and exit a position as soon as the momentum reverses.
AO Oscillator With Other Technical Indicators: Difference and Strategies
A universal rule in the trading world is to only trust an indicator with confirmation!
While traders have a plethora of technical indicators at their disposal, they can occasionally give incorrect signals. So, what can you do to verify that you are following the right indicators?
Other technical indications can come in handy! Combinations of any kind help produce more quick and precise signals for a day trader.
The Awesome Oscillator is a momentum indicator, and if you combine it with other momentum oscillators like RSI or MACD, you can get a potential confirmation of the trend.
Moreover, the AO indicator can be combined with other categories’ indicators – for example, Bollinger Bands volatility indicator or Average Directional Index (ADX) trend indicator.
However, there are some specific indicators with which people confuse the Awesome Oscillator. So let’s break down the differences between each pair and learn how they can be incorporated into one strategy.
Awesome Indicator vs MACD
Similar formula, methodology, and strategies: Awesome Oscillator and MACD may look identical initially. It is no wonder that many traders need clarification on these two indicators. They are indeed alike. However, a few key differences between them are worth mentioning.
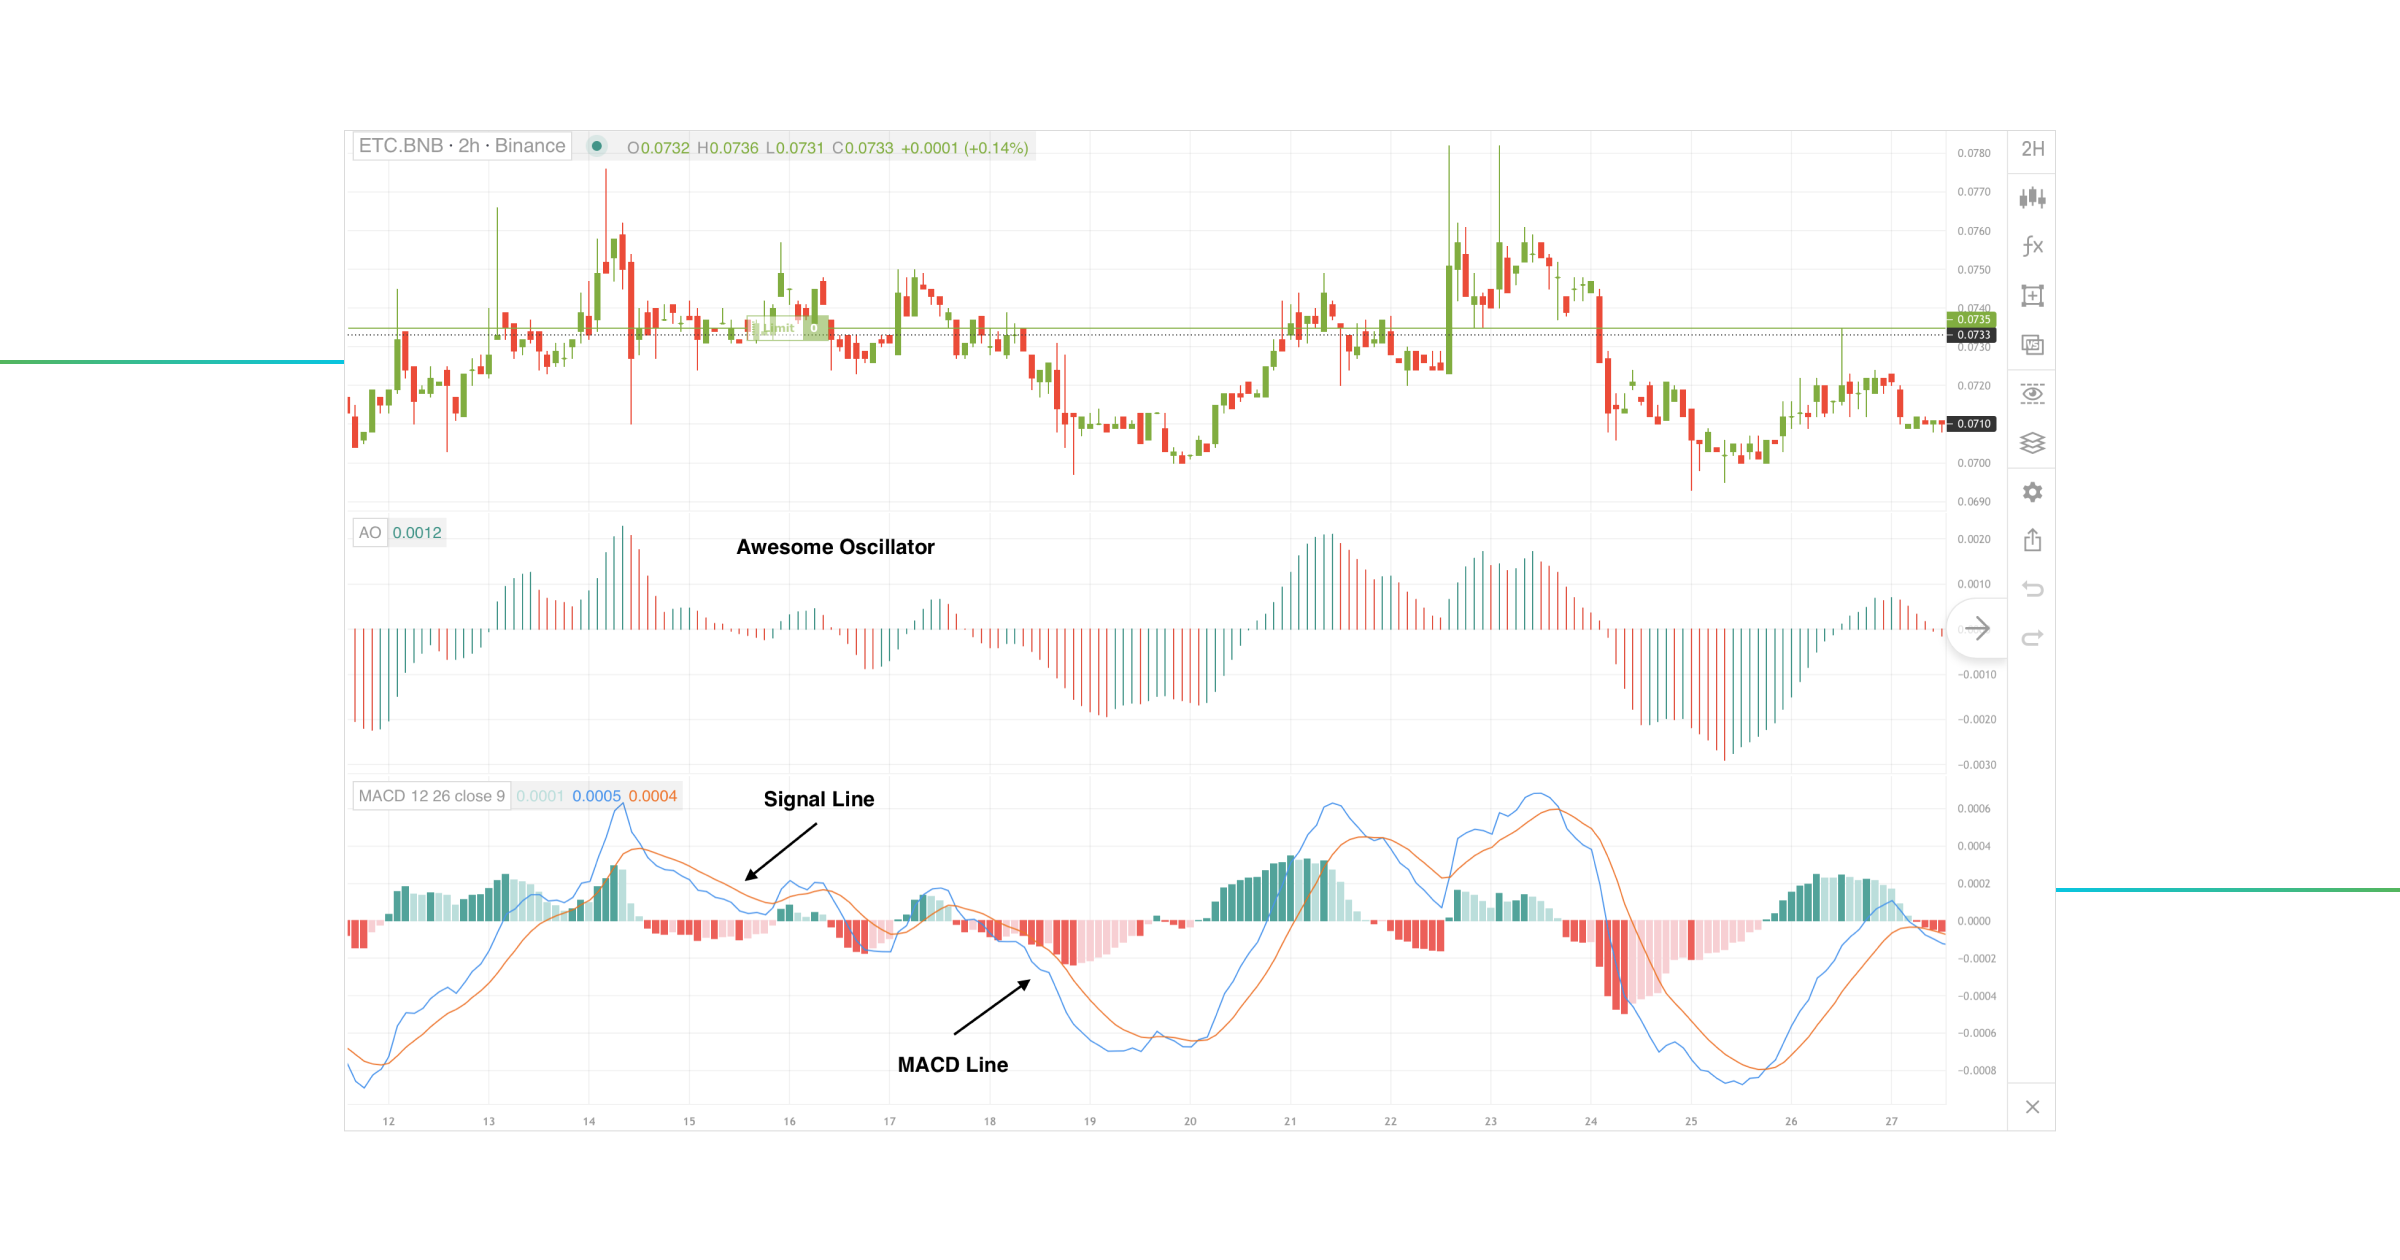
As was previously mentioned, the AO indicator utilizes the 34-bar and 5-bar SMAs in its formula. On the contrary, the MACD indicator employs 26-period and 12-period EMAs and a 9-period Signal Line. What difference does this make? MACD may respond quicker than the Awesome Oscillator when exponential moving averages are included, making AO a confirmation indicator.
Another distinguishing aspect of the AO oscillator is its reliance on the median price to calculate SMAs. On the other hand, MACD calculations, unlike the Awesome Oscillator, are based on the closing price, which is widely regarded as the most reliable.
Ultimately, the AO and the MACD are two major technical indicators that may assist traders in identifying trends and possible reversals. Therefore, compare MACD vs. Awesome Oscillator regarding their effectiveness on various timeframes. For example, the AO is more suited to trading on shorter time frames, such as scalping and day trading, whereas the MACD is better suited to trading on more extended time frames, such as swing trading.
Awesome Oscillator and MACD Strategy
Both the Awesome Oscillator and MACD perfectly complement each other on the chart.
AO may be an improved version of the regular MACD. Since the MACD is based on the EMAs, it reacts faster and gives earlier signals than the AO indicator.
To verify this statement, we are going to overlay two indicators on one chart:
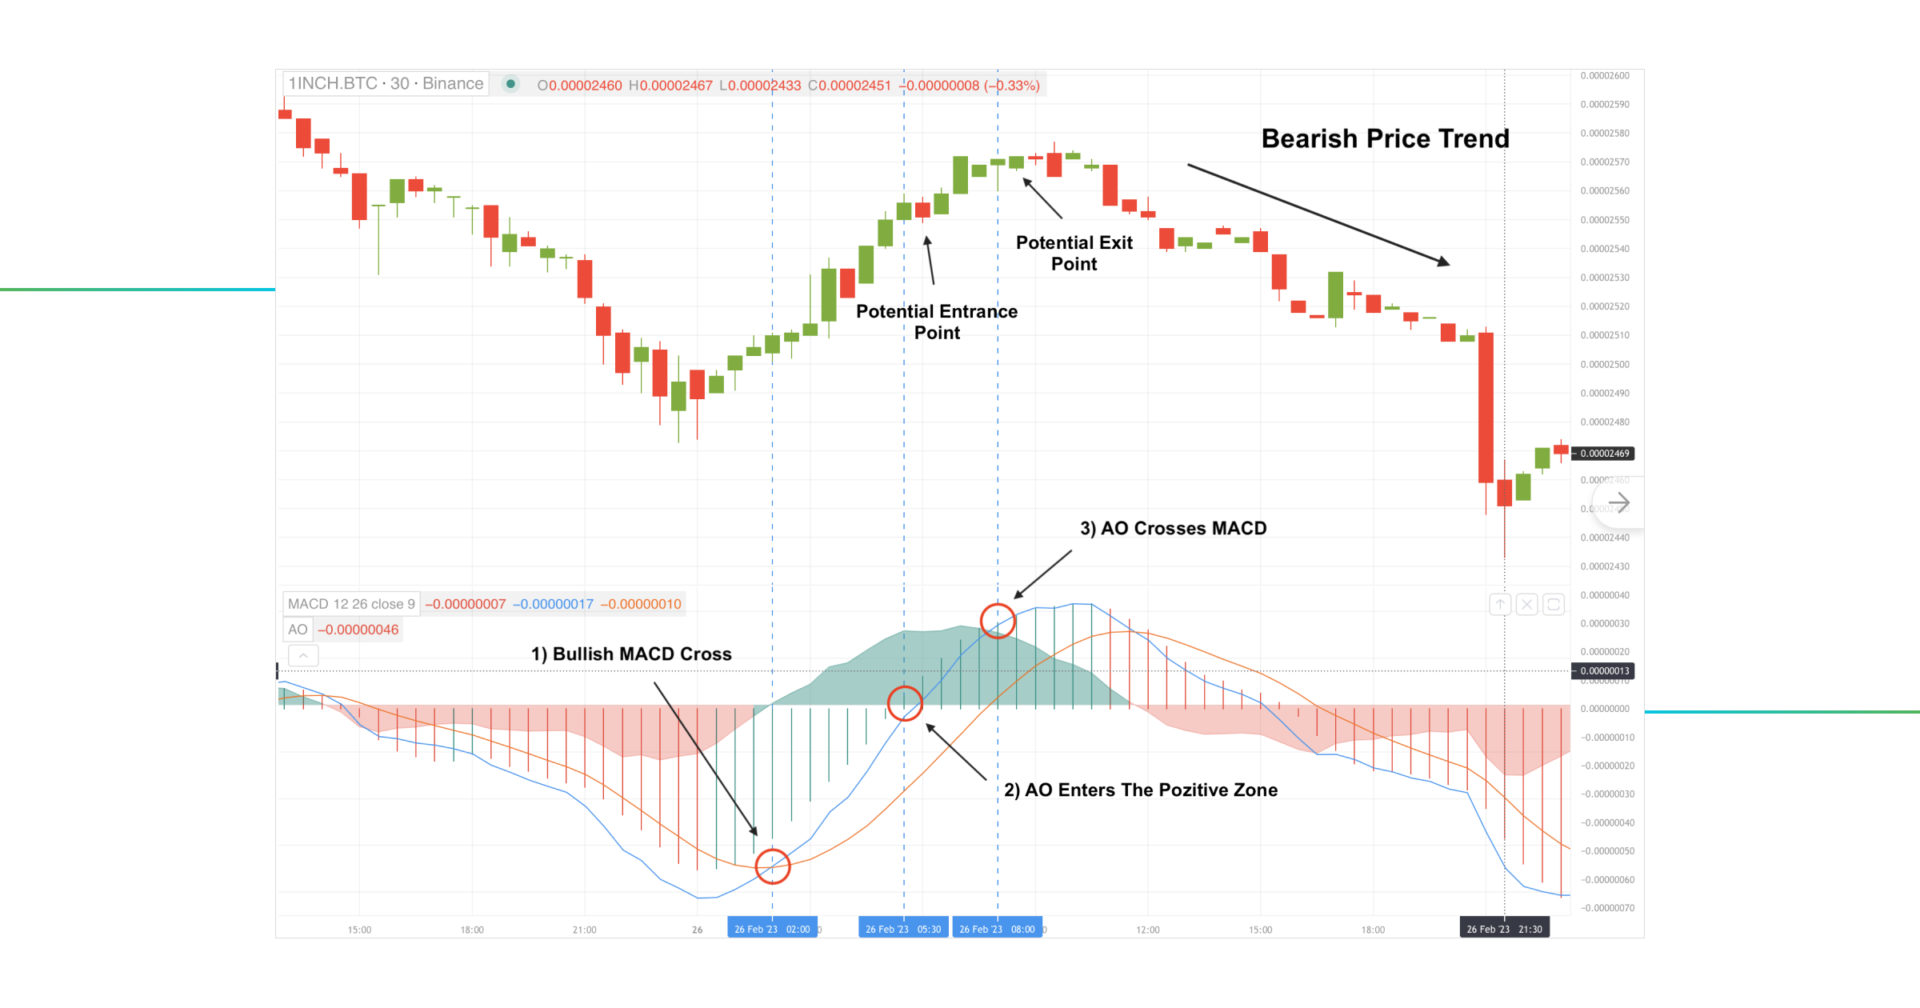
One of the strategies the MACD and AO combination chart can provide is derived from the MACD crossover later confirmed by the AO indicator. We will look at the bullish MACD crossover ahead of the AO entering the positive zone. After the Awesome Oscillator confirms the MACD bullish crossover, we open a trade. The point when AO goes over the MACD histogram shows where the position should be closed if a trader doesn’t want to risk the returns from the deal.
So, the MACD and Awesome Oscillator strategy is based on a simple principle: the first produces a signal, and the second confirms it. The signals generated by these indicators are the same, except for the MACD, which is somewhat delayed.
So you know, no experienced trader trusts a single indicator without confirmation – the Awesome Oscillator and MACD turned out to be a great duo to give traders more reliable signals.
Accelerator Oscillator vs Awesome Oscillator
The Accelerator Oscillator (AC) and Awesome Oscillator are two brainchildren of the famous Bill Williams.
The AC indicator is calculated by subtracting a 5-period simple moving average from the Amazing Oscillator. This indicator was created as a leading indicator to help traders detect early momentum shifts. The Accelerator Oscillator intends to anticipate price fluctuations by assessing the acceleration or deceleration of actual market momentum.
The way AC is plotted in the trading chart is identical to the AO indicator – a colored histogram with green bars representing the price going up and red bars representing the price falling. Although both indicators have lots in common, they have essential differences regarding generated signals.
For instance, AC Zero Line Crossover is not considered a trading signal but rather indicates a bullish or bearish trend.
In his book, “Trading Chaos” (1995), Williams emphasized that while using the Accelerator Oscillator, you should not neither purchase if you see a red bar nor sell if you see a green bar. Essentially, the colors of the bars should be analyzed together with whether the oscillator is above or below Zero Line.
The GoodCrypto trading platform includes the Accelerated Oscillator along with the Awesome Oscillator.
Awesome Oscillator and Accelerator Oscillator Strategy
The Awesome Oscillator and the Accelerator Oscillator can potentially operate together in a quite simple manner – the first one generates a signal, and the last one confirms it.
Let’s plot the AC and AO on one chart:
We should be looking for a signal from the Accelerator Oscillator and a confirmation from the AO.
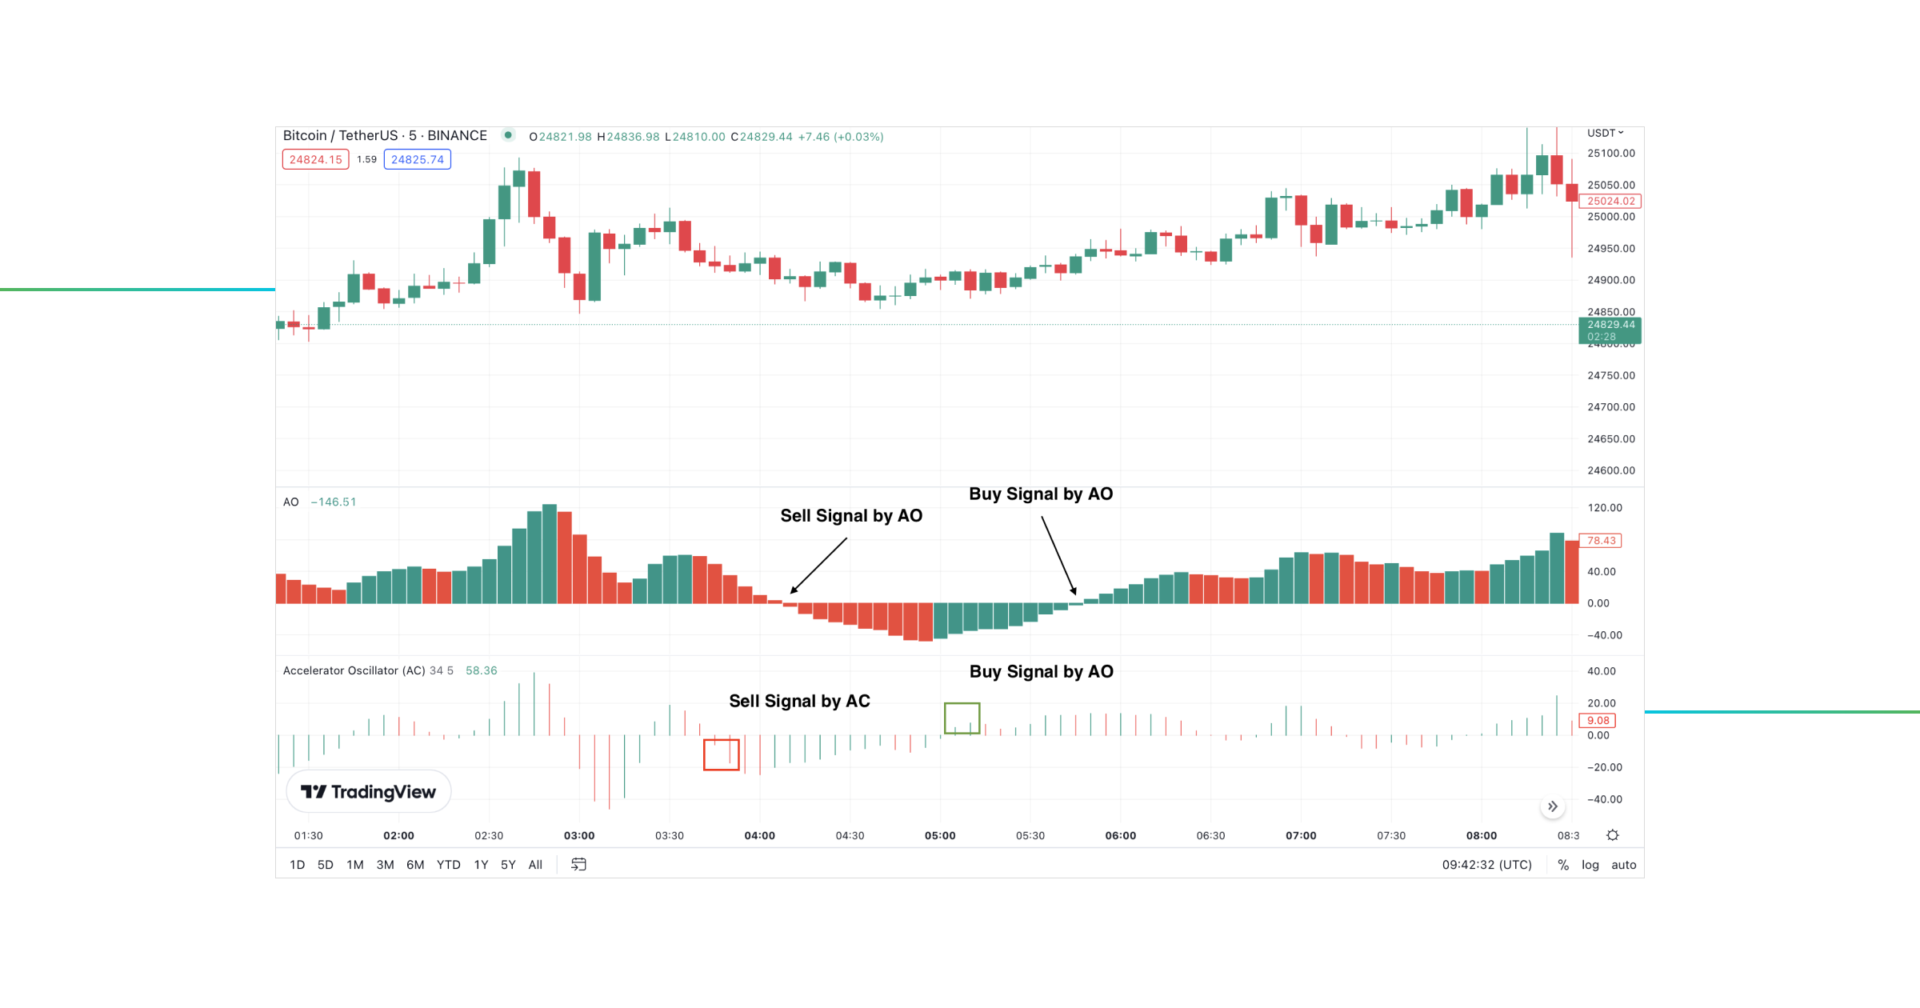
The AC indicator signals:
- Two consecutive green bars in the positive zone (above Zero Line) and two consecutive red bars in the negative zone (below Zero Line) can be seen as Buy and Sell signals, respectively.
The AO indicator confirmation:
- A Zero Line Crossover: Buy Signal is generated when the AO histogram breaks the zero line from the negative zone (below 0) to the positive zone (above 0). While Sell Signal is generated when the histogram breaks the zero line from above Zero Line and moves on to the negative zone (below 0).
First of all, we can see a Sell Signal made by AC (2 consecutive red bars below Zero Line) that was later confirmed by AO (Zero line crossover from above).
The second signal generated by AC was a Buy Signal (2 consecutive green bars above Zero Line) that was later confirmed by AO (Zero line crossover from below).
We can conclude that both indicators complement each other in the trading chart. However, according to Williams, there is an even better way to take advantage of the AO and AC.
In the book “Trading Chaos” Bill himself advised the Alligator indicator to be incorporated into the Awesome Oscillator and Accelerator Oscillator strategy as the primary determinant of whether or not to trade. Speaking of the Alligator indicator, it is another technical indicator created by Bill Williams. In short, the AO and AC histograms can spot particular signals on top of the whole market situation that the Alligator Indicator showcases.
If you want to rely on more than just the Awesome Oscillator, you are not limited to combining it with other technical indicators available on GoodCrypto.
Trading the Awesome Indicator on GoodCrypto
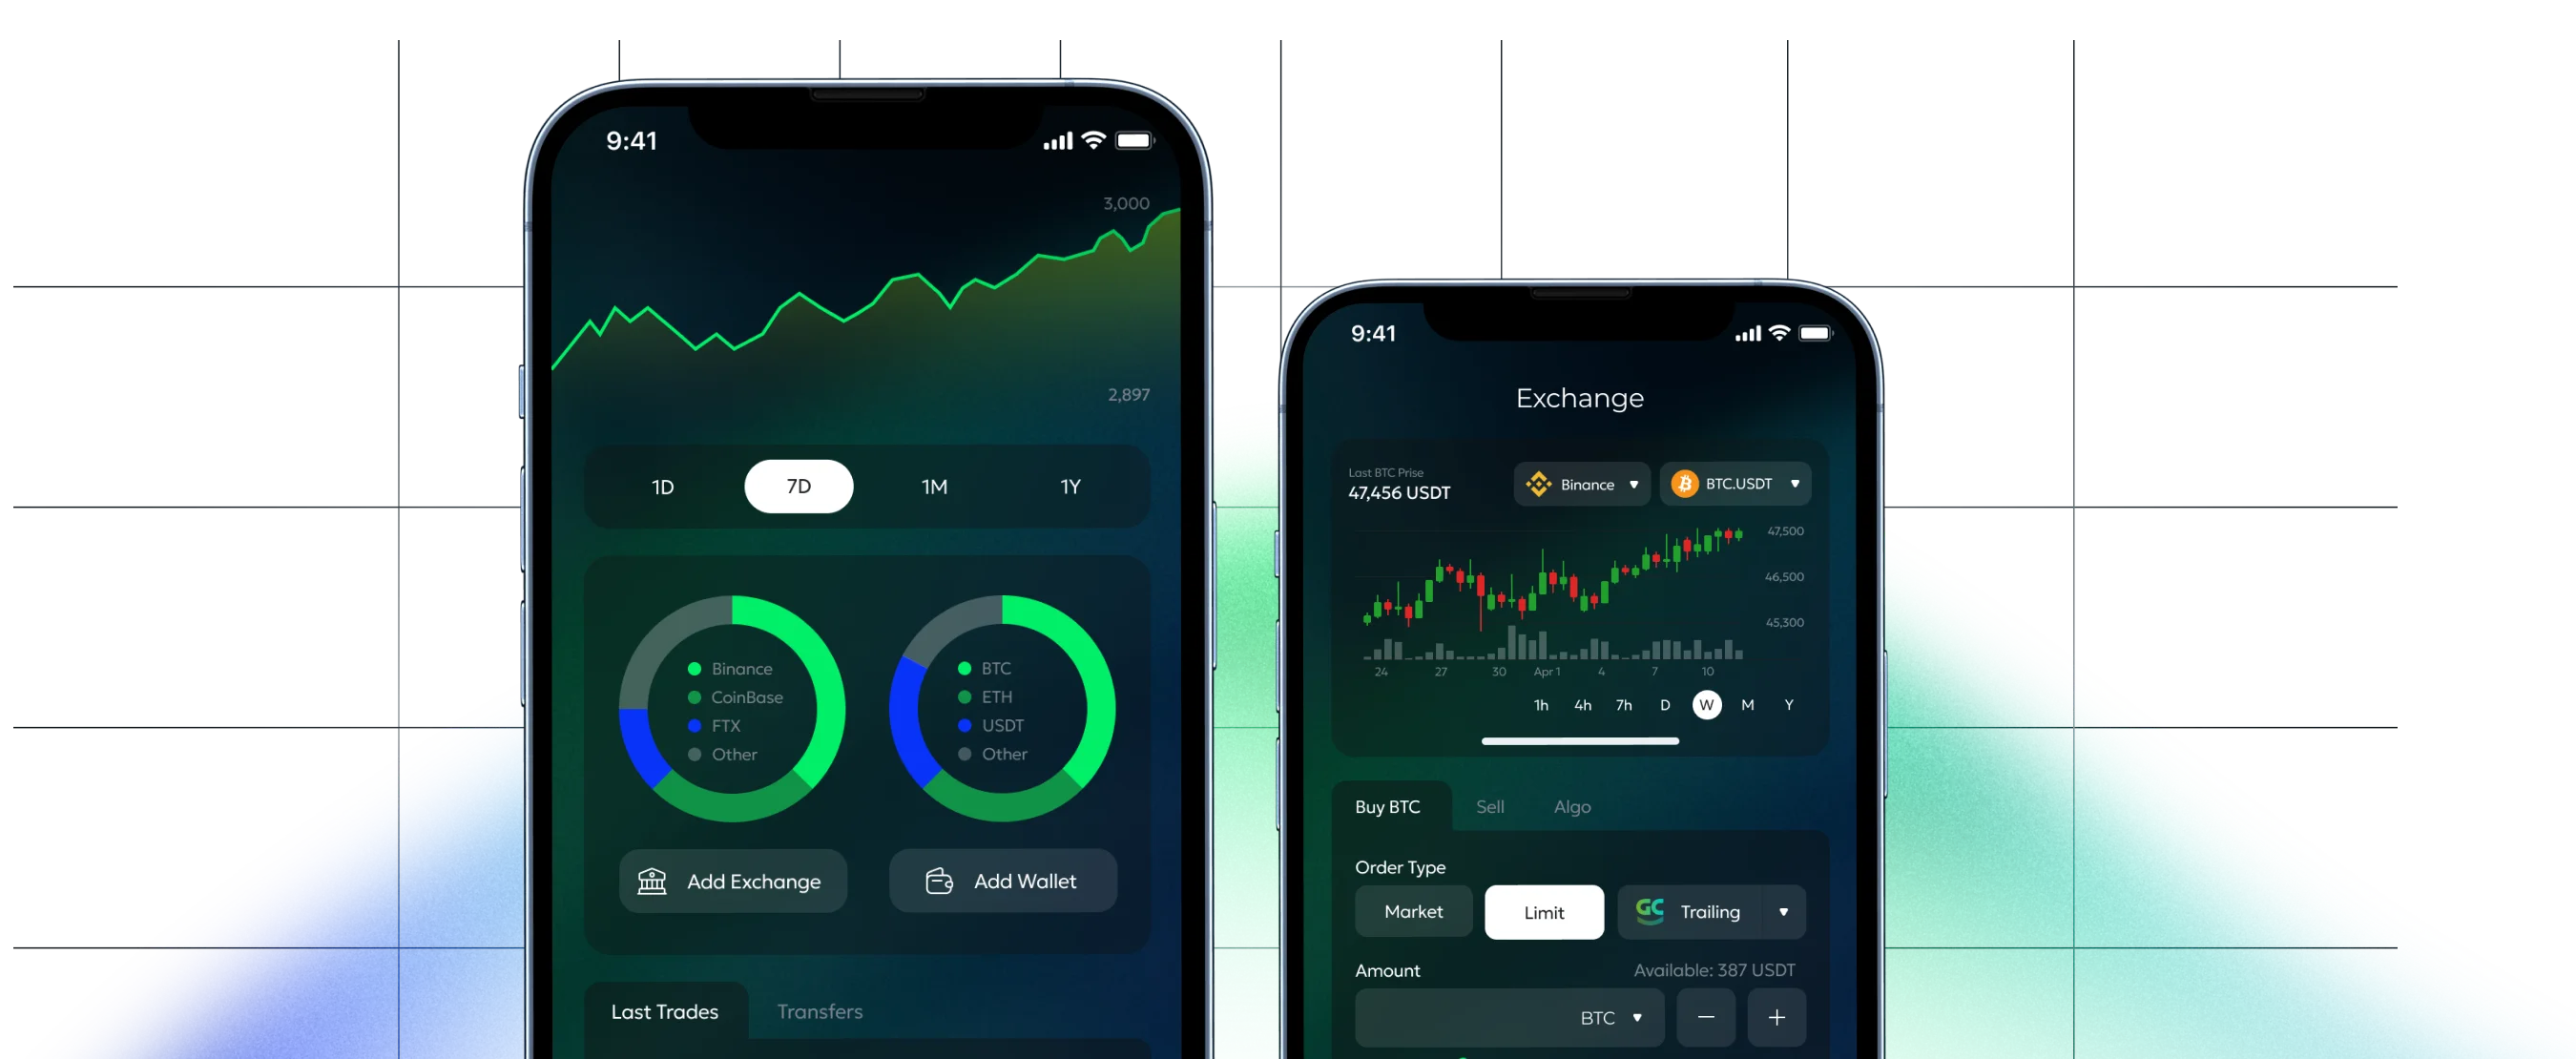
GoodCrypto is a comprehensive cryptocurrency management app that provides users with access to more than 35 leading cryptocurrency exchanges, including Binance, Coinbase, Kraken, and many more.
No more logging into multiple accounts or juggling multiple passwords – with GoodCrypto, you can easily manage your digital assets from a single platform, making it a convenient and hassle-free way to trade, buy, and sell cryptocurrencies. GoodCrypto also provides real-time market data and analysis, enabling you to make informed decisions on when to buy or sell.
GoodCrypto is committed to security – the platform utilizes advanced encryption and multi-factor authentication to protect your funds from unauthorized access.
With GoodCrypto, you can trade your digital assets like a professional:
- Level up your trading strategy by integrating Grid Bots, Infinity Trailing, and DCA Bots.
- Take advantage of crypto signals based on a currency market state and 25 technical indicators.
- Capture perfect entry points and protect your trades using Take Profit & Stop Loss combos that don’t lock your balance until triggered.
- Leverage GoodCrypto Trailing feature to maximize your profit from trades.
So why wait? Download GoodCrypto on either the iOS App Store or the Android Play Store today and see why it’s the go-to app for aspiring cryptocurrency traders and investors.
If you have additional questions, you can ask them in our Telegram public chat room that operates 365/24/7.