
We’re proud to be the first to launch a DCA bot for DEXs! Enjoy the same DCA trading experience you’re used to on CEXs but with no technical limitations.
July 2, 2025
Over the course of history, scholars have researched various ways that help us predict seemingly erratic market behavior. As such, Fibonacci retracement often comes out as one of the most popular methods to forecast a market trend shift.
In this article, we will teach you the basics of Fibonacci trading with the help of our GoodCrypto app. To this end, we will explain the meaning behind Fibonacci retracement numbers. Additionally, we will show you how to draw crypto Fibonacci retracement using our free Fibonacci retracement tool. More importantly, you will learn to apply the automatic Fibonacci retracement tool using real-world Fibonacci retracement examples in crypto markets.
After reading this article, the automatic Fibonacci retracement indicator will have no secrets for you. You will be able to construct your own Fibonacci retracement day trading strategies and place market entries and exits. But before we delve deeper into practices of trading Fibonacci, let’s begin with a short introduction on what is Fibonacci retracement and how it was discovered.
To understand what is a Fibonacci retracement, we first need to introduce you to the Fibonacci numbers sequence. The Fibonacci retracement meaning is derived from the following series of numbers: 0, 1, 1, 2, 3, 5, 8, 13, 21, 34, 55, etc. Here, each number is the sum of the two previous ones.
To have the Fibonacci retracement explained, we can divide each number by the next one and obtain a ratio of 68.1%. When we divide it by the number two places to the right, we obtain 38.2%. Finally, the next ratio equates to 23.6%. These are Fibonacci ratios.
In the 12th century, Leonardo Pisano (better known as Fibonacci), noticed that this sequence is widespread across nature. It can be naturally found in spiral shapes that form seashells, constellations, flowers, etc. More importantly, it is believed that Fibonacci retracement also affects how humans behave. In our narrative, it applies to how the prices can fluctuate in the crypto market. The retracement helps traders understand how to use technical analysis effectively.
To achieve this, traders choose Fibonacci swing high swing low price points on the chart.
The aforementioned ratios of 68.1%, 38.2%, and 23.6% form horizontal lines between these points, with two additional levels, at 50% and 76.4%. These crypto Fibonacci lines provide price levels where the price is likely to reverse within the trend. They also provide levels where the price is more likely to stall and encounter support or resistance.
The two additional levels of 50% and 76.4% are added by traders, even though they aren’t provided by the Fibonacci formula. This is because, historically, price trends tend to find support and resistance at these levels as well. Consequently, adding them to the Fibonacci levels on your chart can provide further insight for market entries or exits.
But is Fibonacci retracement accurate and should you rely on swing high swing low Fibonacci in crypto trading? To answer this question, let’s first explain how to use the Fibonacci retracement in practice.
To learn how to use the Fibonacci retracement tool, you need to understand how to read the lines provided by the aforementioned Fibonacci crypto ratios.
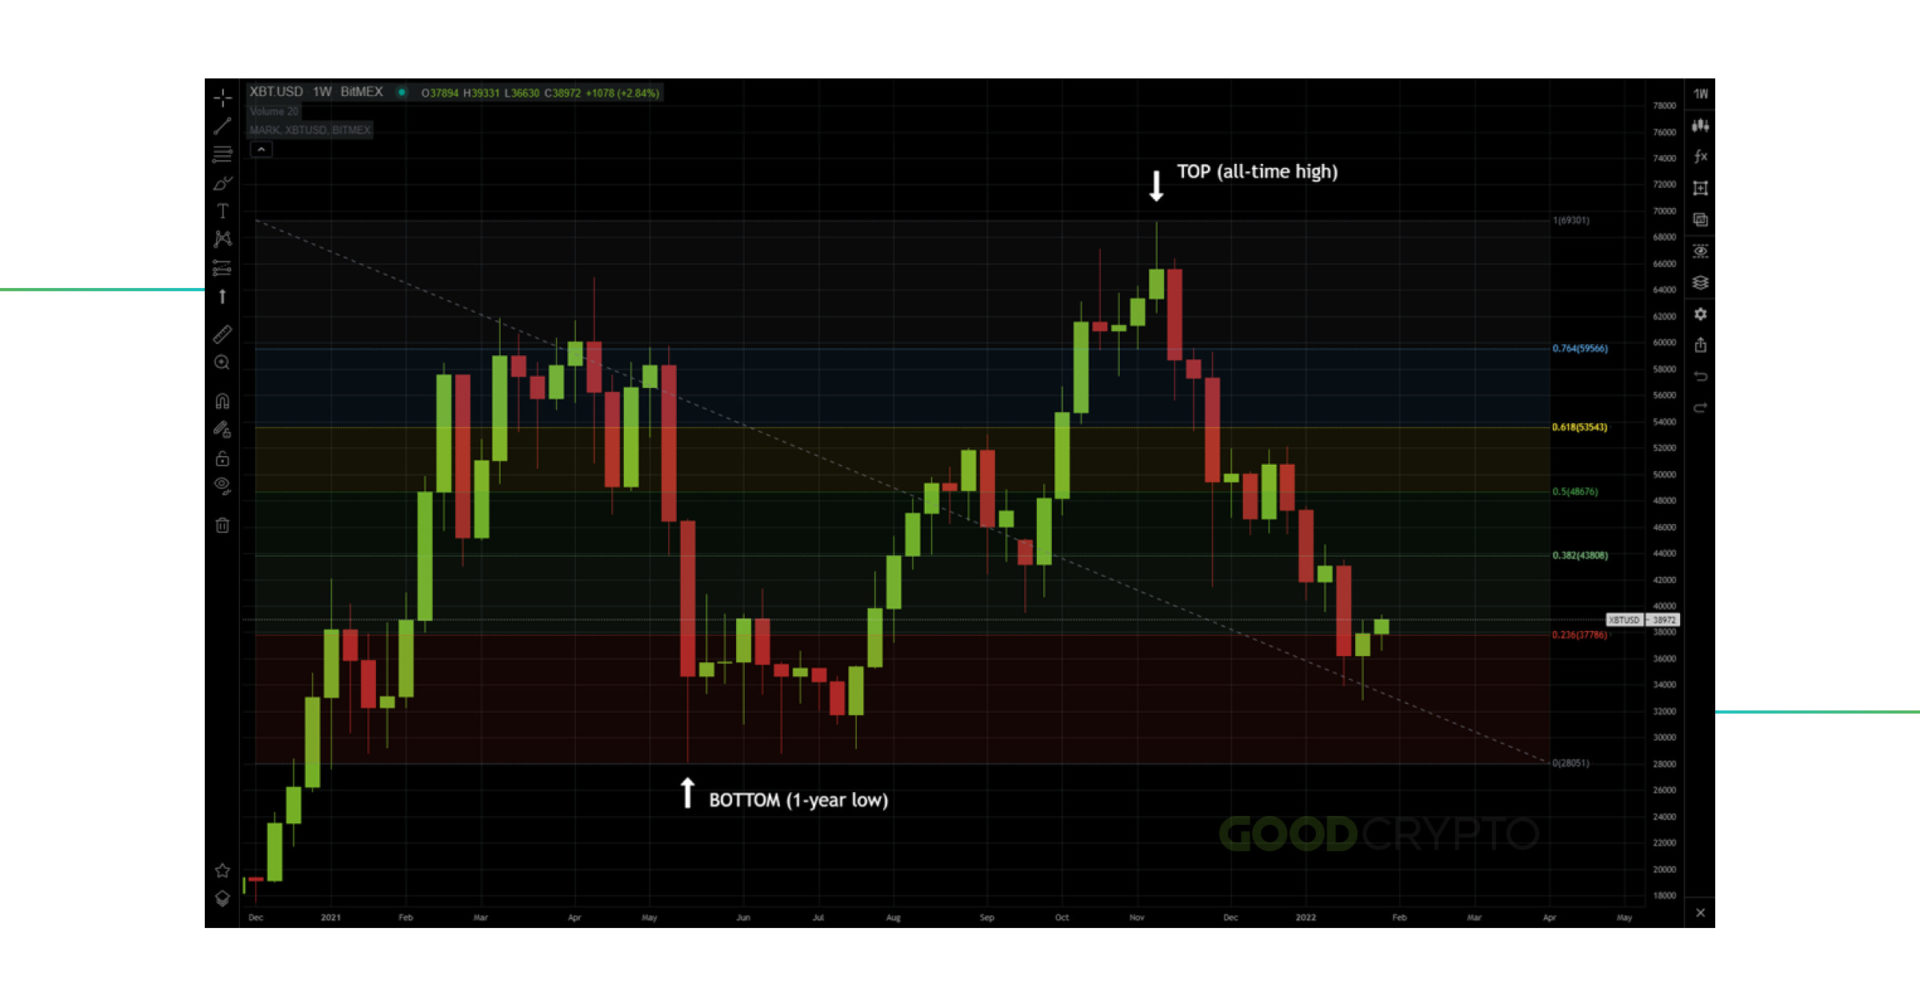
Using Fibonacci retracement is appealing because there are no set rules on how to properly use Fibonacci retracement. You just need to select two points, one high and one low. Any point that seems relevant to you in a price trend can be used as a reference. In the Bitcoin example below, we selected the yearly high and the yearly low as points of reference for the 1-week chart.
And if you are asking yourself: ‘does Fibonacci retracement work?’, the answer is yes. What’s interesting is that one of the main reasons why does Fibonacci retracement work is the indicator’s popularity. Traders watch the same support and resistance lines and expect the same result, which culminates in self-fulfilling predictions.
However, finding the right occasion when to use Fibonacci retracement is a matter of trading experience. Fibonacci retracement crypto may seem obvious in hindsight but placing confident trades in relation to these levels can be mind-boggling. So, let’s explore how to read Fibonacci retracement next.
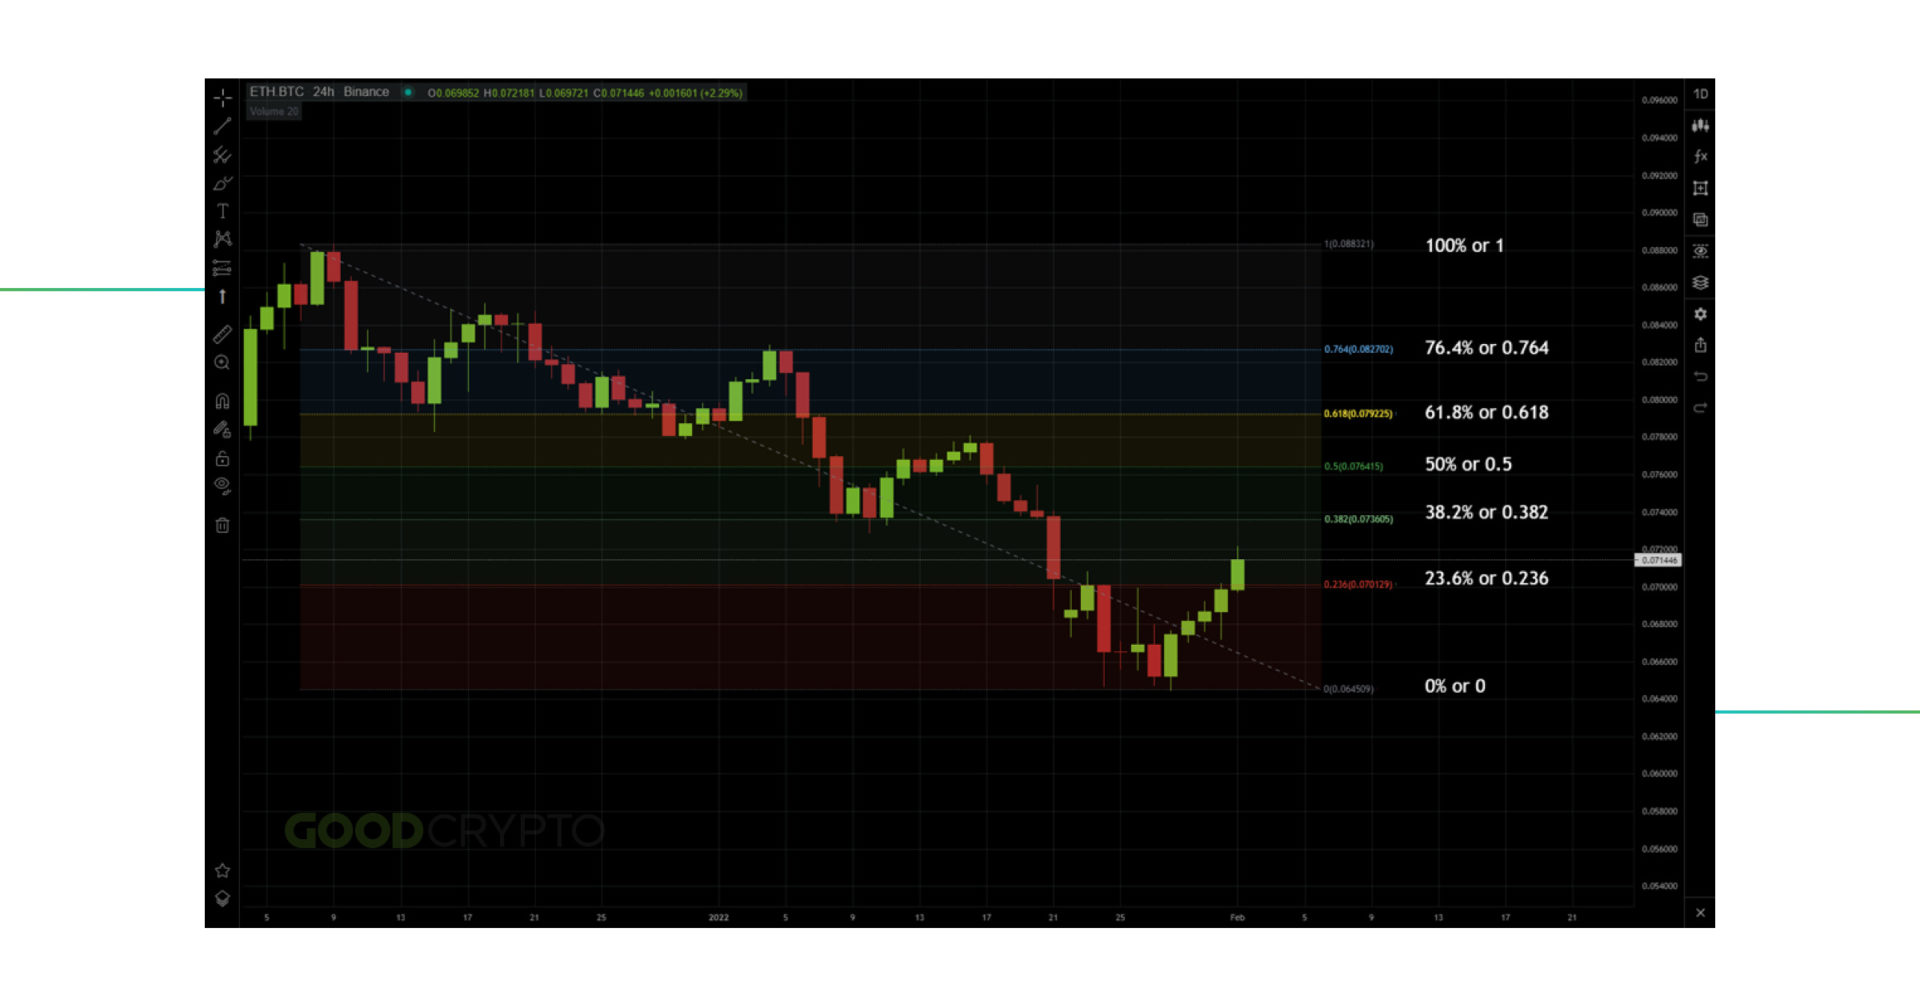
In trading apps like GoodCrypto, the most common ratios of Fibonacci in crypto will be represented on a scale of 1 to 0 with the following levels in between: 0.786, 0.618, 0.5, 0.382, and 0.236. Once you understand these Fibonacci numbers trading lines, you can learn how to use Fibonacci retracement levels quite effortlessly.
It’s worth noting that the 0.618 ratio is particularly important for trading with Fibonacci retracements. It is called the “golden ratio” and traders often consider it as a major trend support/resistance level. When the price reaches one of these levels, we expect that either a trend continuation or reversal will occur.
Now that you know how to read Fibonacci retracement in a chart, let’s continue by showing you how to trade with Fibonacci retracement. The best way to trade Fibonacci retracement is by observing the retracement levels closely.
In the following example, we have a Bitcoin chart in a downtrend. To know where to use Fibonacci retracement, choose the highest and lowest points in this trend. In this instance, the chosen time frame for Fibonacci retracement is 1 day.
The price reaching below 0.382 ($51,463) could be a signal that the downtrend continues. Thus, the price might sharply fall towards 0.236, signaling traders to place short bets.
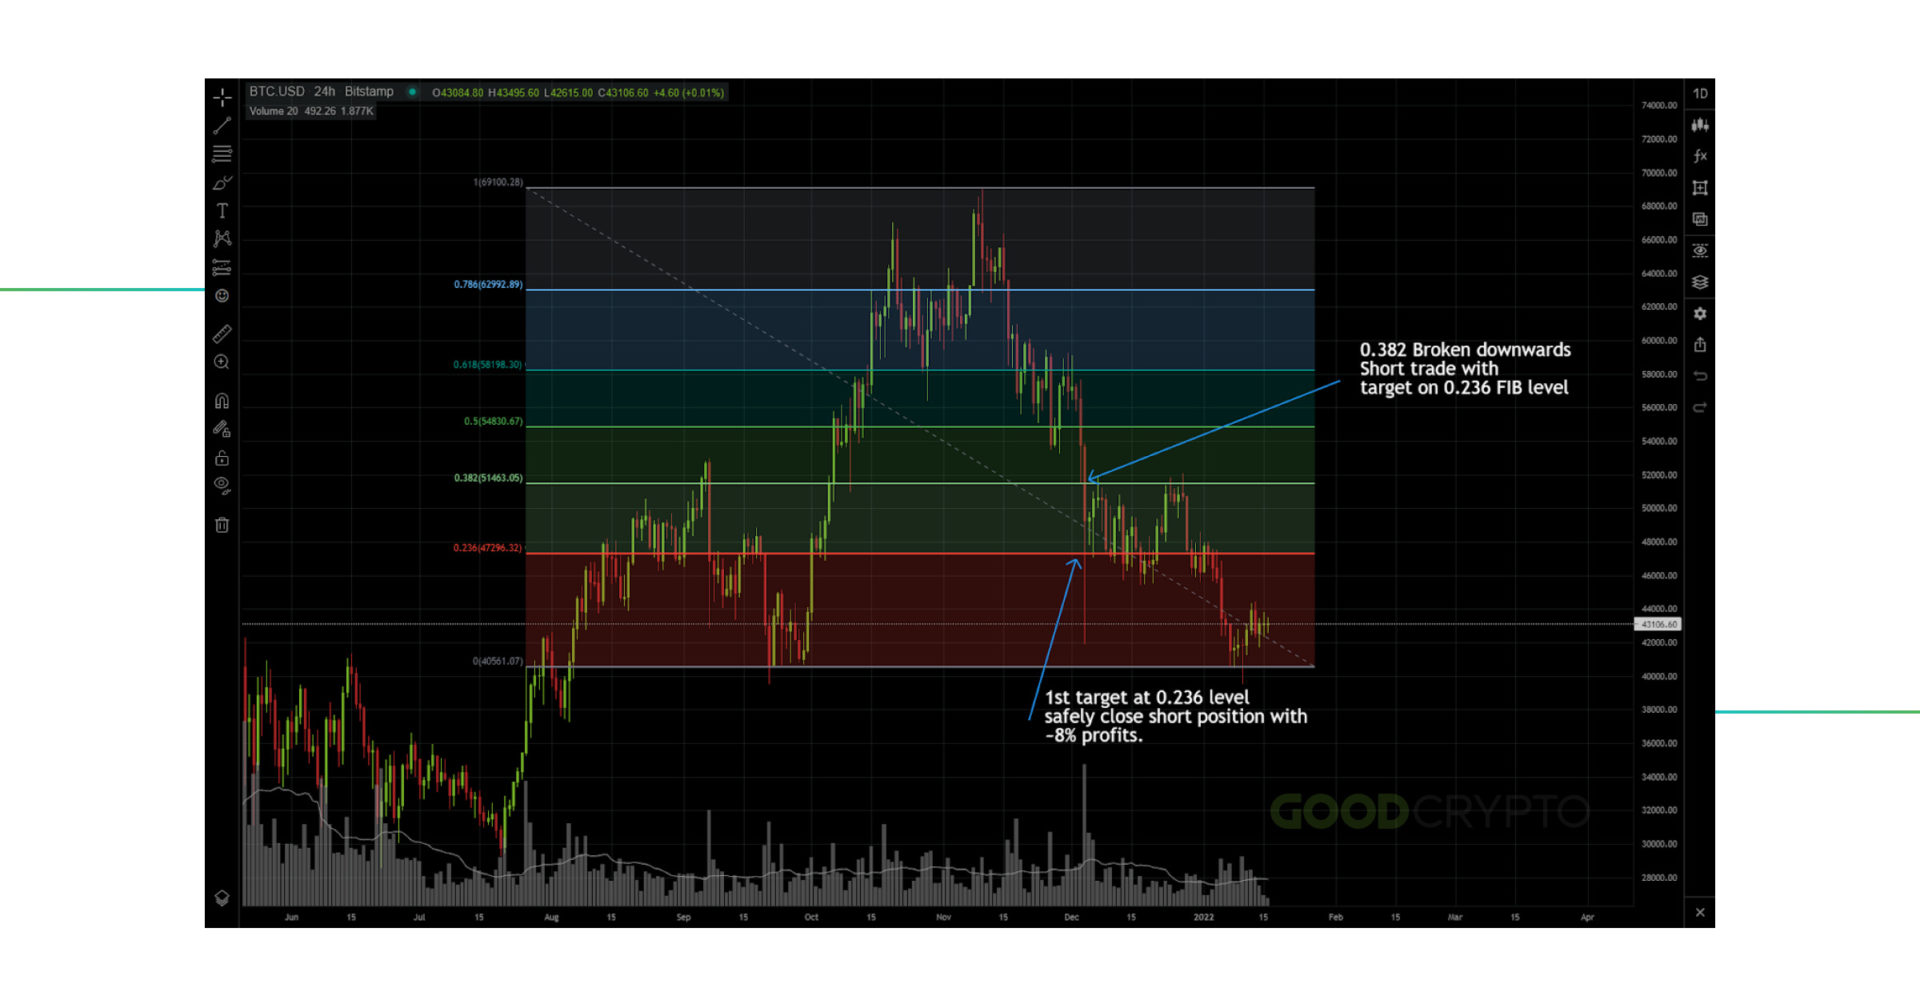
Once the price reaches the 0.236 line ($47,296), the trader can safely close the short position with an ~8% gain.
This is just a crude example on how to trade with Fibonacci retracements. We will expand further upon how to trade Fibonacci retracement further down in our article. But first, you need to learn how to add Fibonacci retracement level using our GoodCrypto free Fibonacci retracement tool.
If you are still wondering how to place Fibonacci retracement you are in for a treat. Drawing Fibonacci retracement levels is completely streamlined in our GoodCrypto app. The only thing you need to learn through trial and error is where to place Fibonacci retracement, as there is no particular rule on how to draw Fibonacci retracement correctly. Selecting a relevant high and low price should be your starting point, depending on the timeframe that you are trading on.
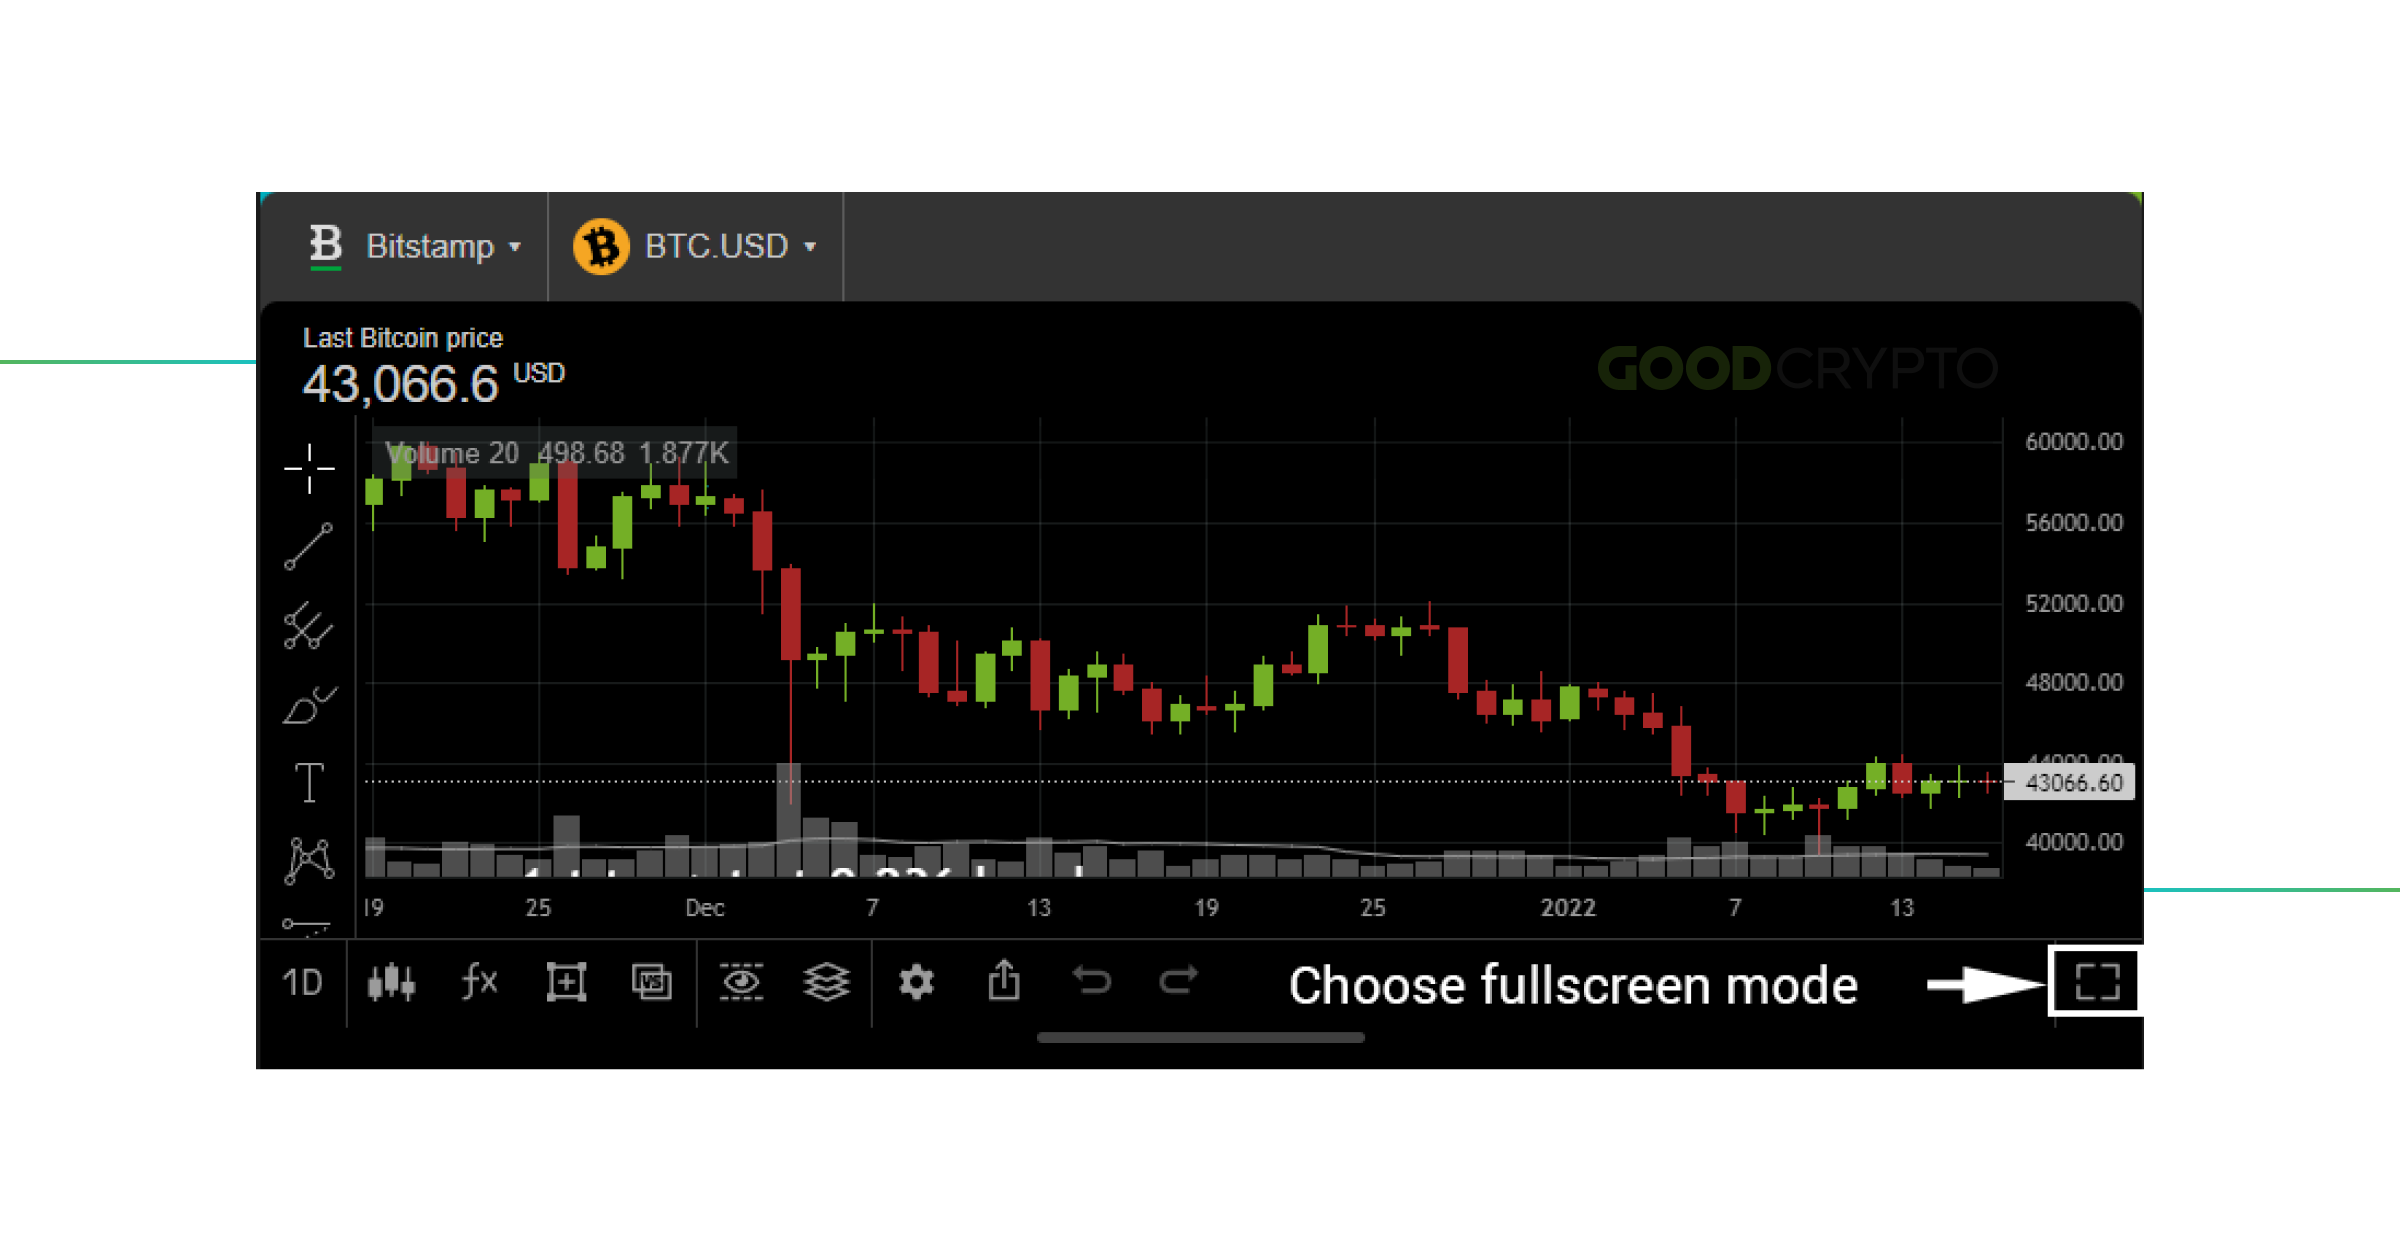
So, let’s carry on with our guide on how to draw a Fibonacci retracement using GoodCrypto. First, open the app and put it in fullscreen mode for legibility purposes when reading Fibonacci levels crypto.
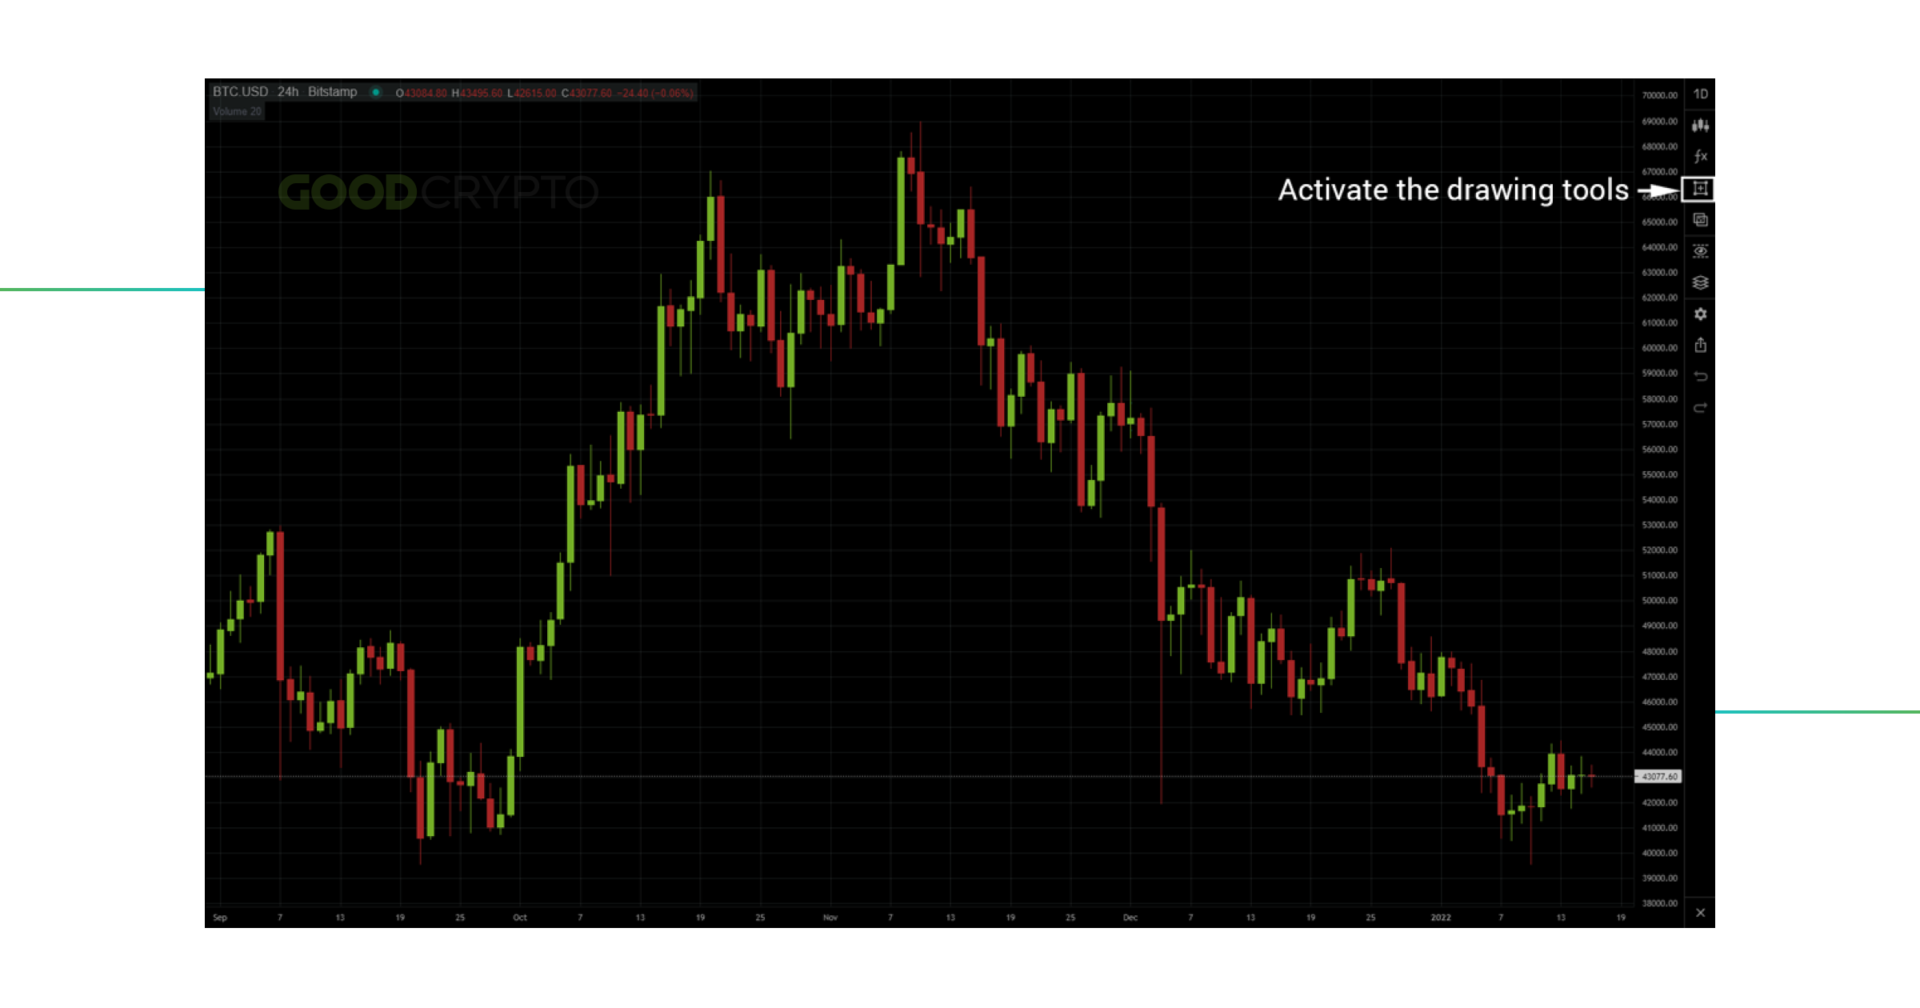
Once in fullscreen, you can proceed to draw your Fibonacci retracement by using the integrated Fibonacci retracement lines tool. To access this Fibonacci retracement charting tool, activate the drawing tools by clicking on the icon with a square and a cross in the middle.
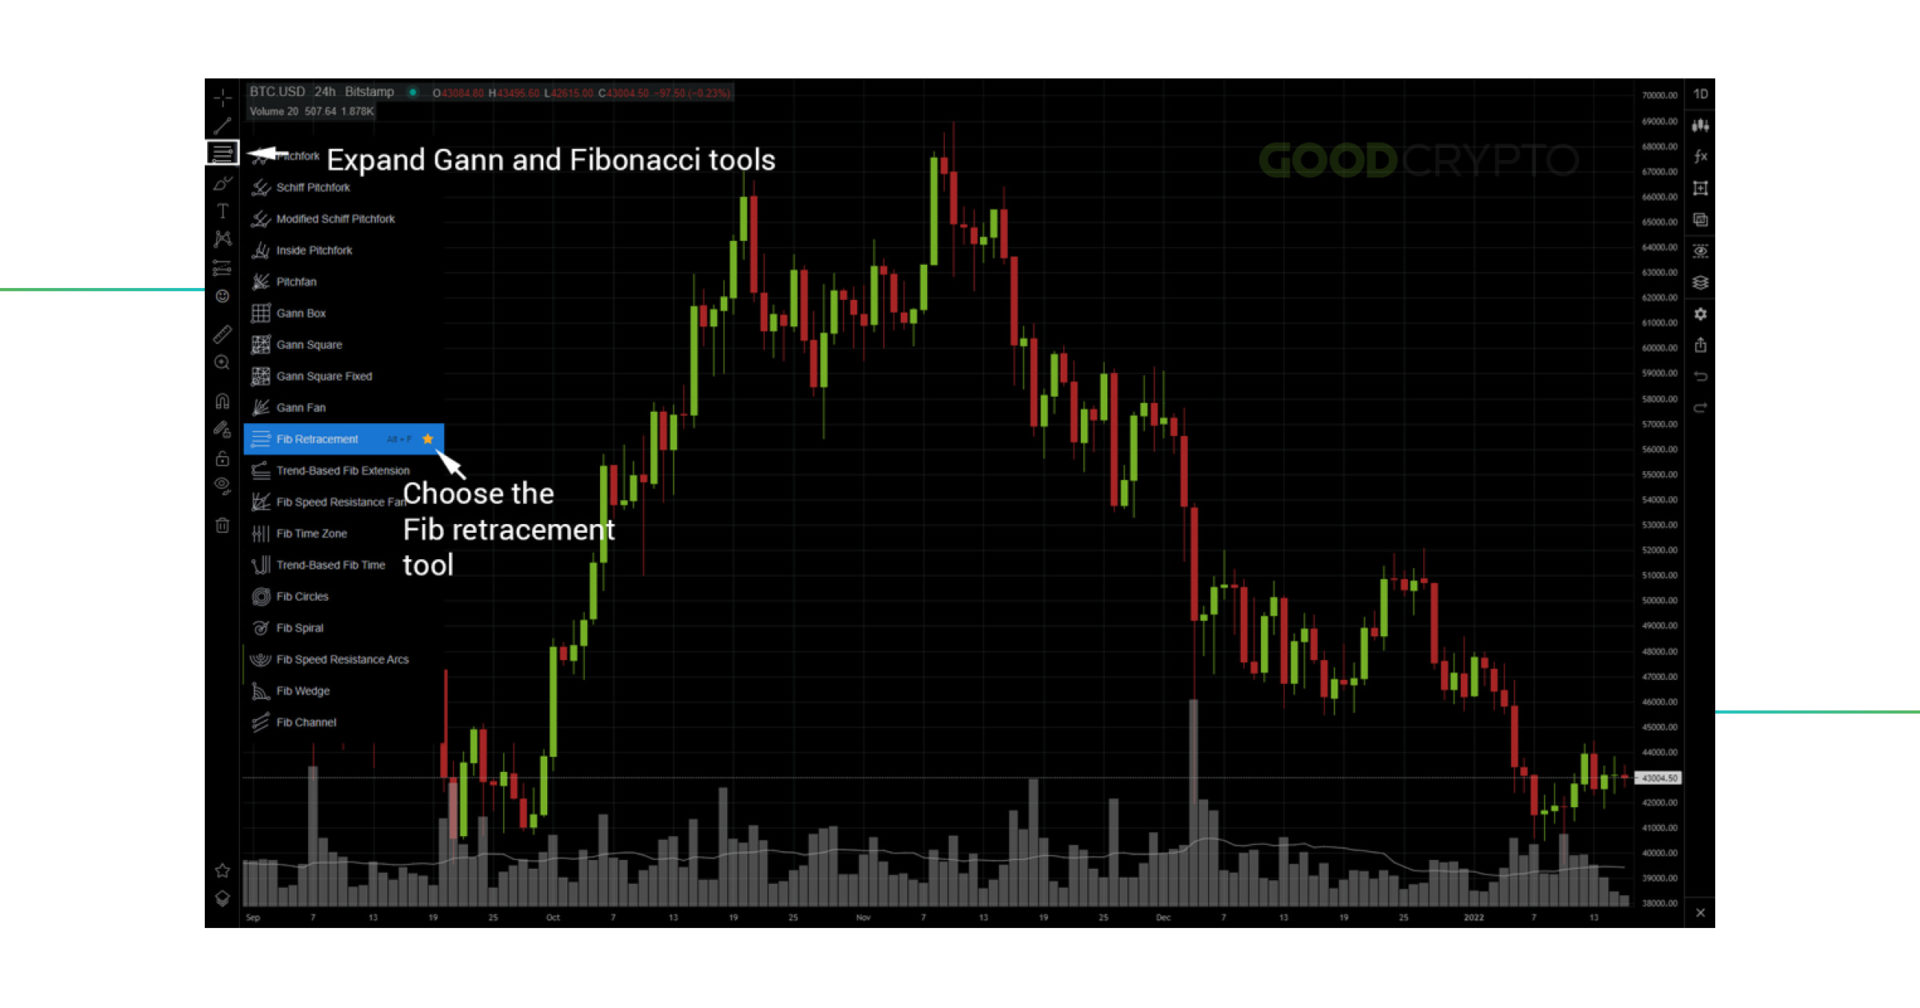
Next, to chart Fibonacci retracement levels, expand the Gann and Fibonacci retracement tool crypto. Click on the 3rd tool icon from the top and select the “Fib retracement” tool. Alternatively, you can use the Alt+F shortcut to activate the Fibonacci retracement levels indicator if you are using our web app.
Your next step on how to place a Fibonacci retracement is to choose a high and low point on your chart. In our case, we will select the Bitcoin all-time high of $69,000. Our low point reference will be the low levels of September 2021 and January 2022 at $39,470. Simply click and drag from the all-time high to the lowest points to draw the Fibonacci retracement table.
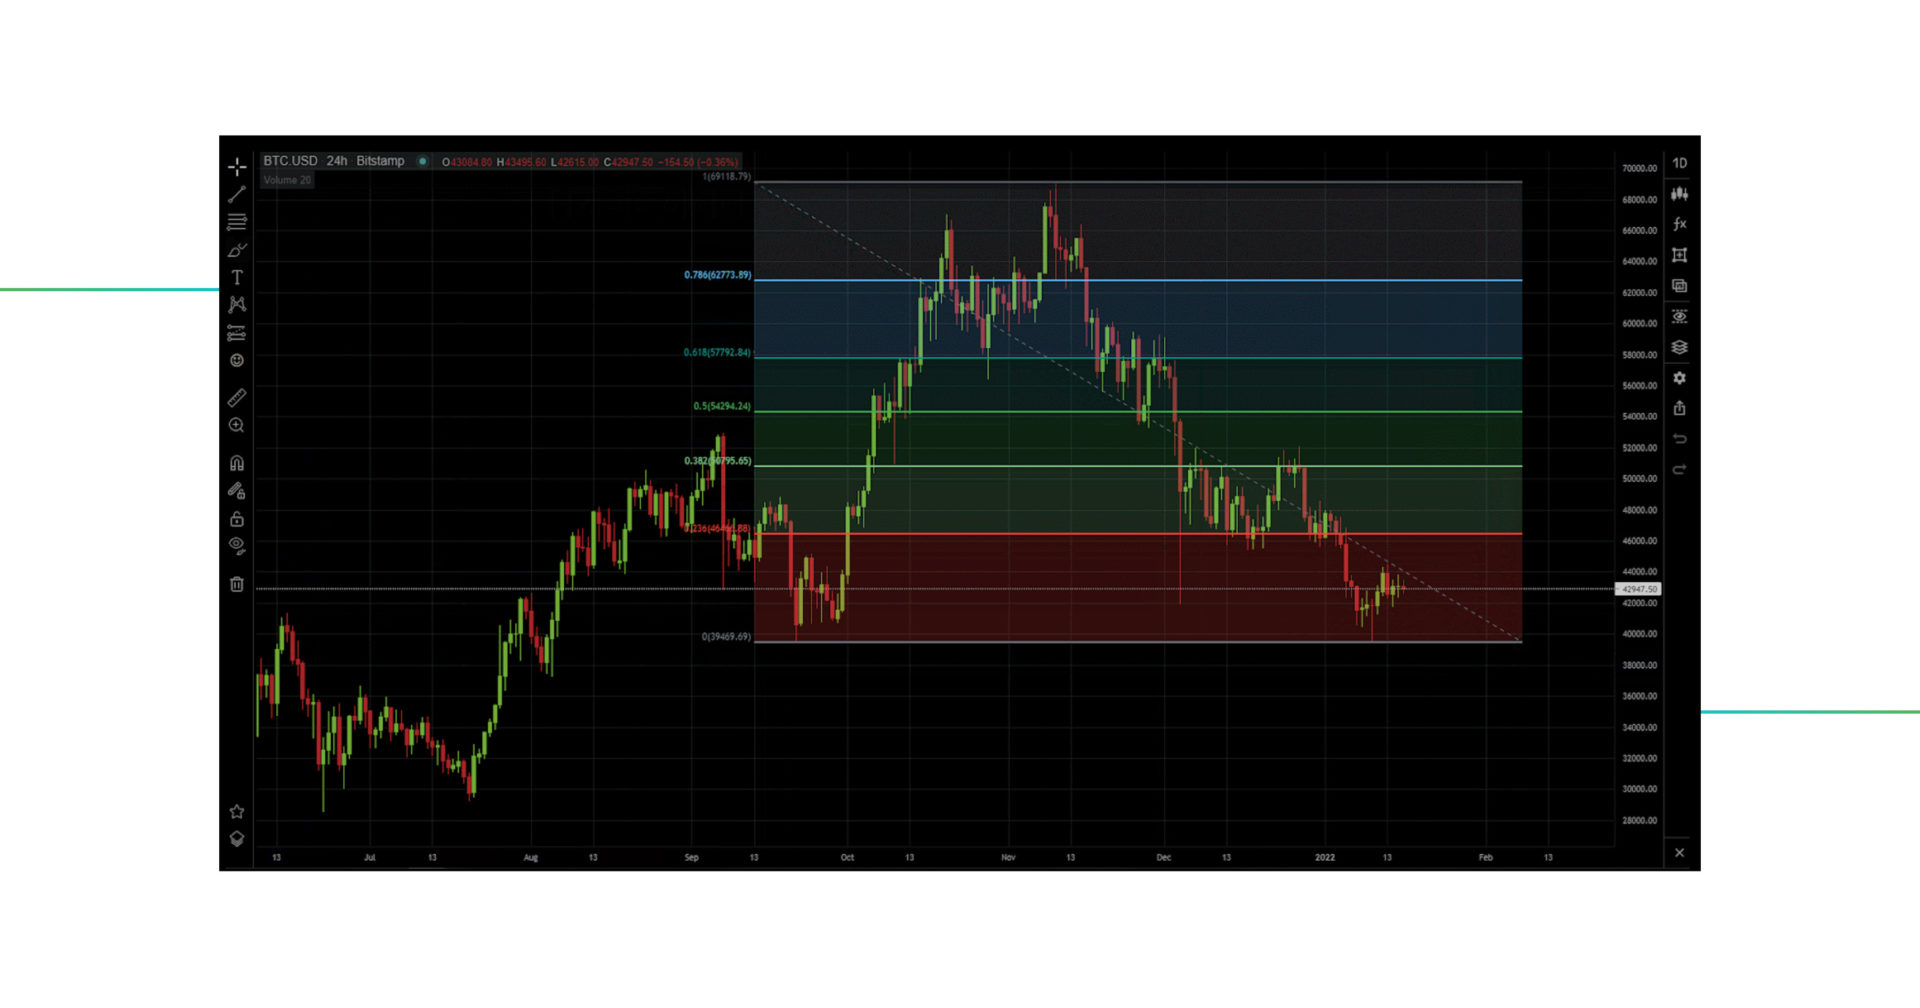
This will allow you to place the most common Fibonacci retracement levels, including the extremely popular 50 Fibonacci retracement level. While this level isn’t obtained by calculating the ratios as we explained earlier in the article, setting a Fibonacci retracement level at the 0.5 level can be very useful. It often acts as a strong support/resistance within the trend and you should use this Fibonacci retracement level liberally.
And if you use Tradingview for charting, note that the Trading View Fibonacci retracement operates exactly in the same manner.
To calculate the Fibonacci retracement levels, you can either use a Fibonacci retracement calculator or use the following Fibonacci retracement formulas:
Thankfully, you will never need to learn how to calculate Fibonacci retracement as our auto Fibonacci retracement indicator in the GoodCrypto app will automatically set the default ratios and levels for you. Moreover, the following Omnicalculator link will lead you to a Fibonacci retracement levels calculator that will do the hard work in your stead.
Now that we have the method on how to calculate Fibonacci retracement, let’s delve into some practical examples of Fibonacci pattern crypto trading.
Finally, we get to the meat of our article, where we teach you about Fibonacci trading strategy. Below, we go through various Fibonacci retracement trading strategies that you can use as your Fibonacci day trading strategies for making reliable market entries and exits. Keep in mind that there’s no single best Fibonacci trading strategy, as each one can be applied in different circumstances.
While we already covered Fibonacci retracement strategy earlier, we haven’t yet touched upon the Fibonacci retracement vs extension notion. Fibonacci extensions are very useful for determining exit positions when the price breaks out of the trend, beyond 100%. To obtain the ratios for Fibonacci extension vs retracement, we simply add the usual ratios to 100%, which gives us 1.236, 1.382, 1.5, 1.618, and so forth.
Let’s have a look at a Fibonacci extension and retracement example to see how it can help you determine price targets in a downtrend. In the chart below, we placed our Fibonacci bottom level at a major support line on $3,600 for ETH/USD.
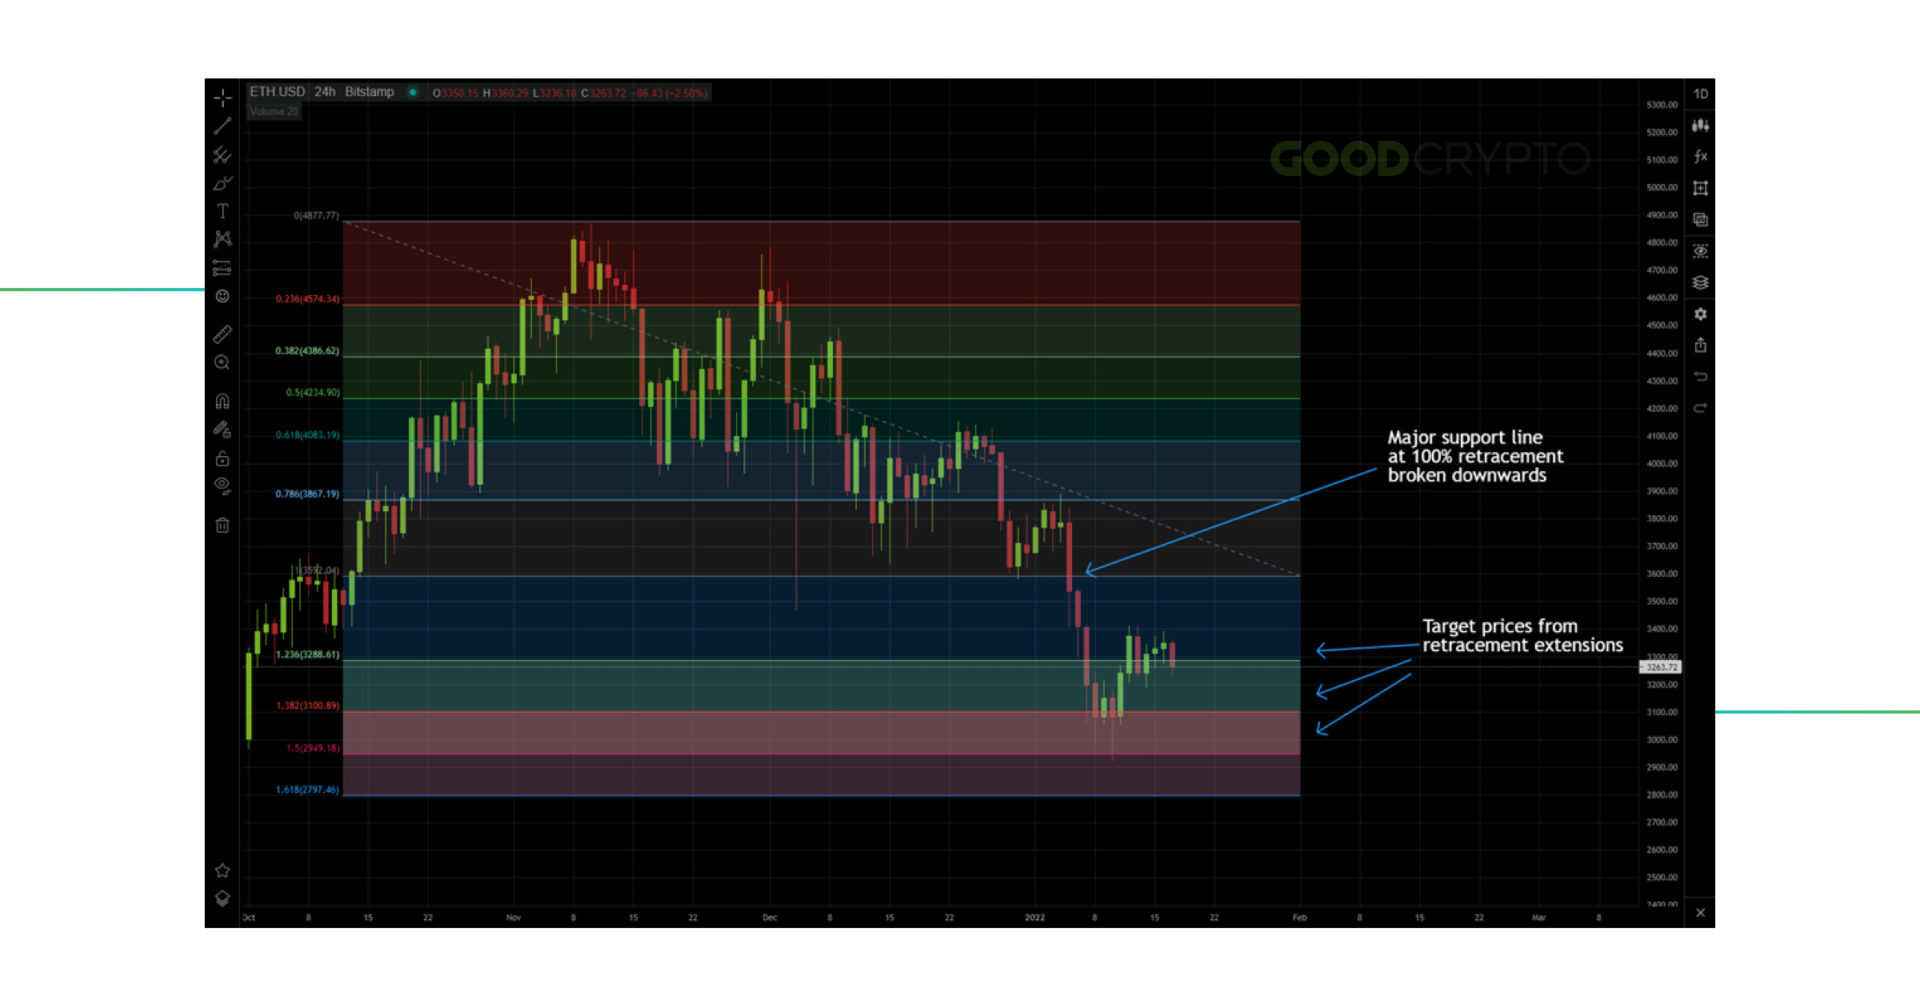
The Fibonacci extensions provide us price targets in case the price breaks down this support line. In this case, the trader can open short positions once the trend has broken down the support with targets at 1.236 ($3,260) and 1.382 ($3,100). In this particular case, the 1.382 level acted as a strong support from the price, validating the Fibonacci extensions theory. In case of a bounce from these levels, the trader can buy back assets and make profits from the price swing towards the previous Fibonacci retracement level.
As mentioned earlier, when trading downtrend or uptrend Fibonacci retracement, the levels will provide you with crucial support and resistance levels. However, to draw the Fibonacci retracement in uptrend, you will need to attach the tool to the bottom and drag it up to the top. Conversely, when drawing the Fibonacci retracement on downtrend, attach the tool to the top and drag it to the bottom of the trend.
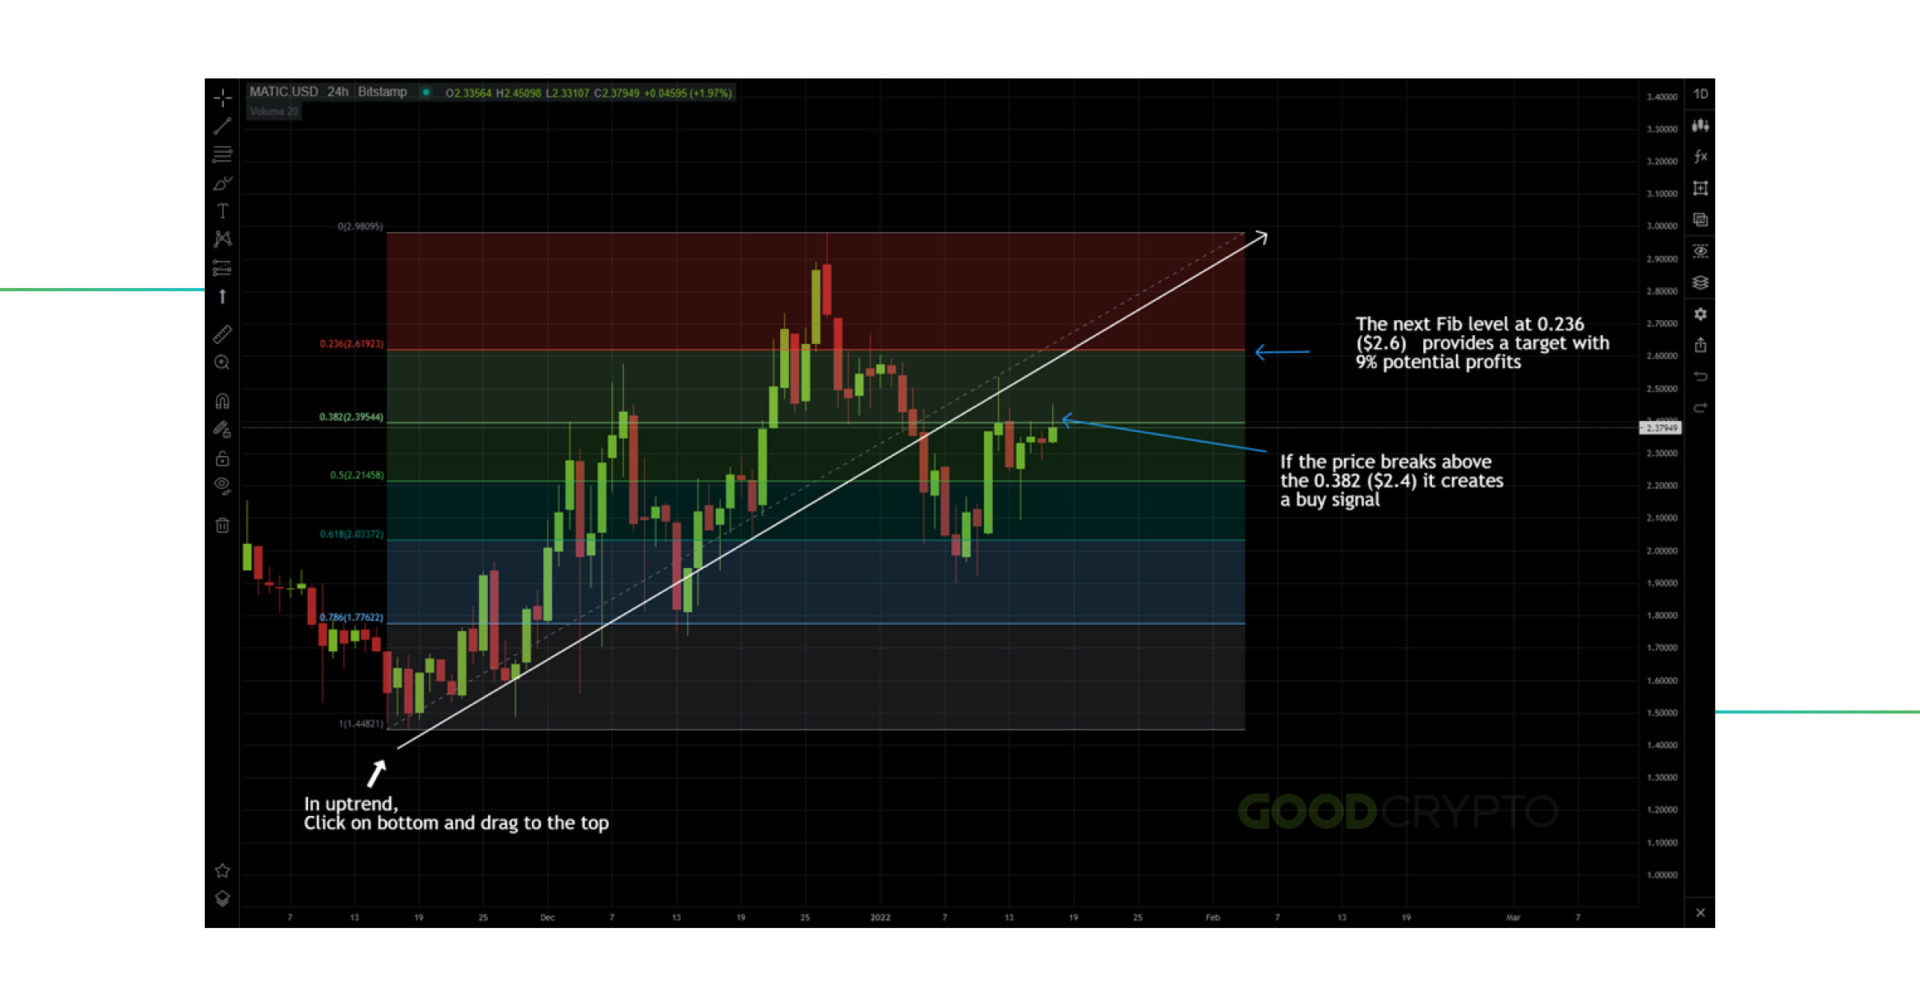
In the MATIC/USD example above, we drew Fibonacci retracement uptrend lines from the bottom up. In case the price breaks above the 0.382 level ($2.4), it signals a long position and a continuation of the trend. The target is the next Fib level at 0.236 ($2.6) providing a Fibonacci retracement take profit position of 9%. You can set a stop loss just under the 0.382 level (-1.5%), in case the breakout is not confirmed.
The same can be applied with a downtrend Fibonacci retracement, providing you with precise opportunities for short positions and buybacks.
The Fibonacci support and resistance lines are extremely useful when you can’t clearly distinguish support and resistance lines on a chart. This can help you immensely with market entries and exits, even though the price seems to be going in only one direction on a macro scale.
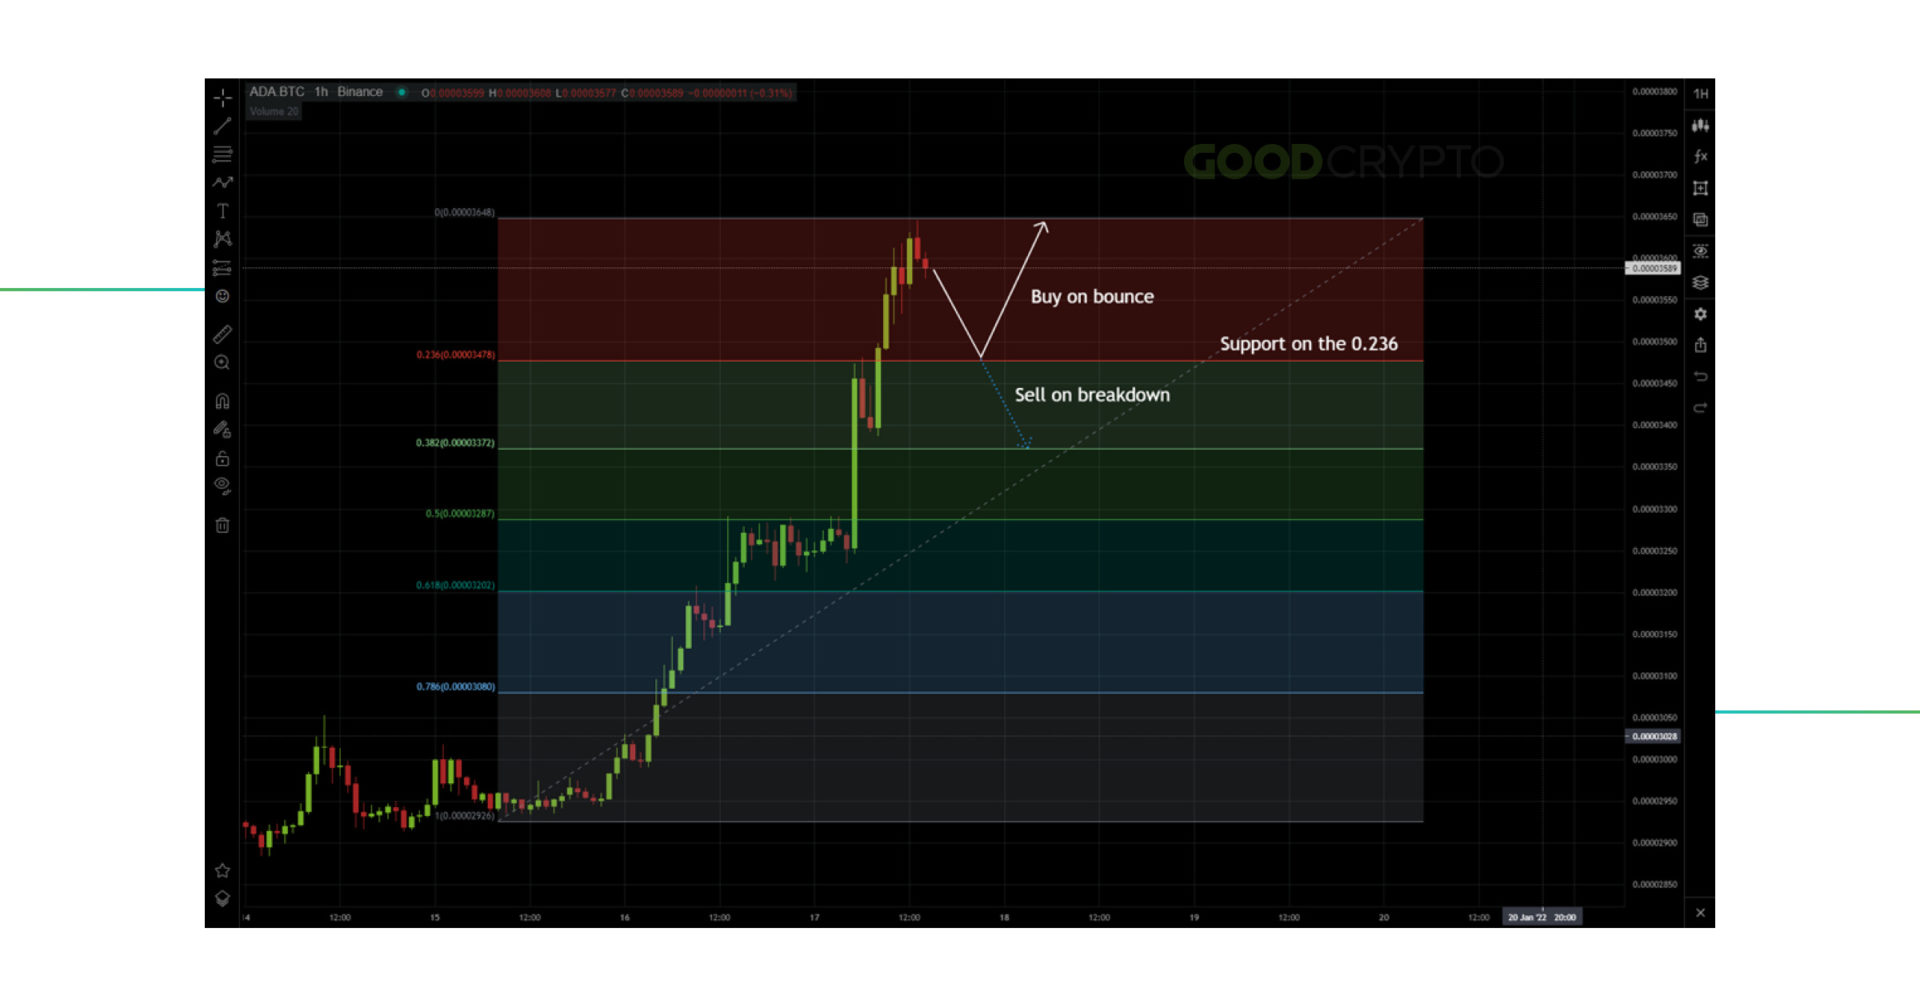
Because Fibonacci provides fixed lines for support and resistance, you can use Fibonacci sequence trading automation strategies. The Fibonacci sequence in trading can provide you with clear market entries and exits so that you can set up conditions for automatic orders using our GoodCrypto app. The Fibonacci sequence in crypto will allow you to look for pullbacks and breakouts for low-risk profit strategies.
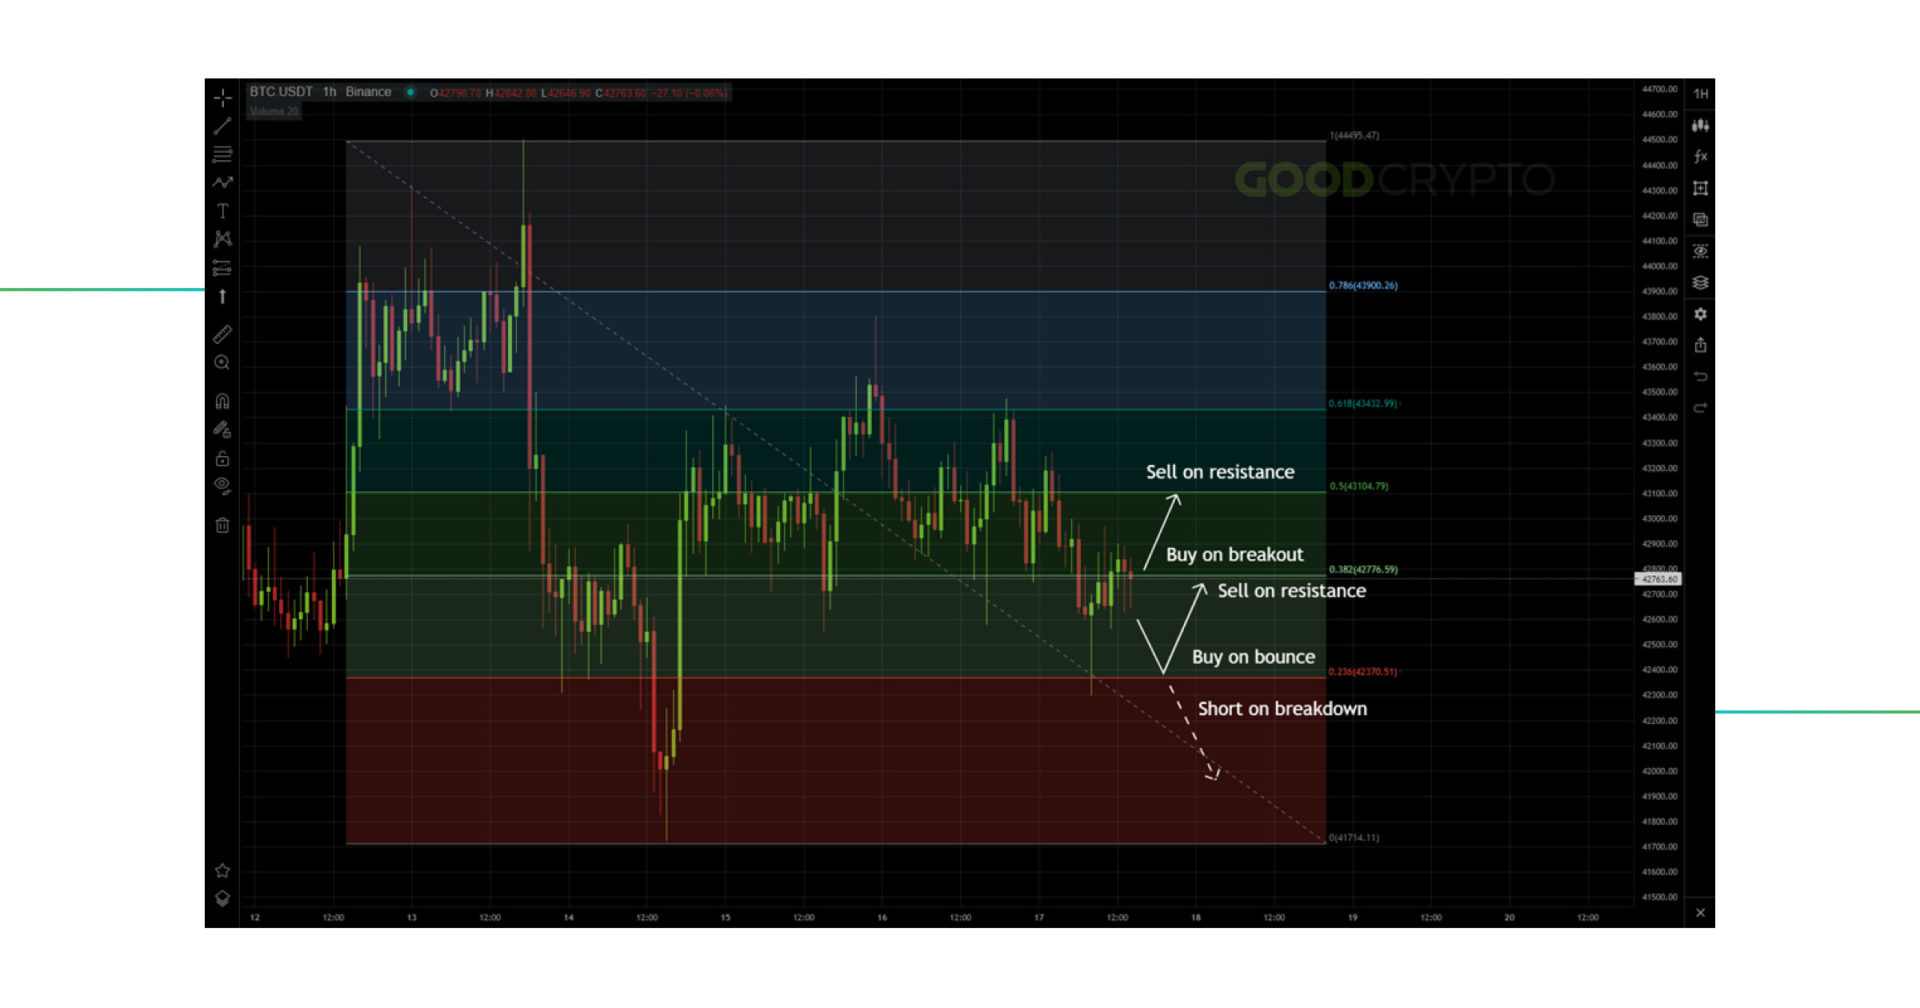
In the example above, you can see how the Fibonacci sequence Bitcoin chart, where it allows you to take profits from price swings. Breakouts provide buy signals, where the target is the next Fibonacci retracement level. On the other hand, breaking down from Fibonacci sequence levels provides either short entries, or allows you to place stop losses in case of a fakeout.
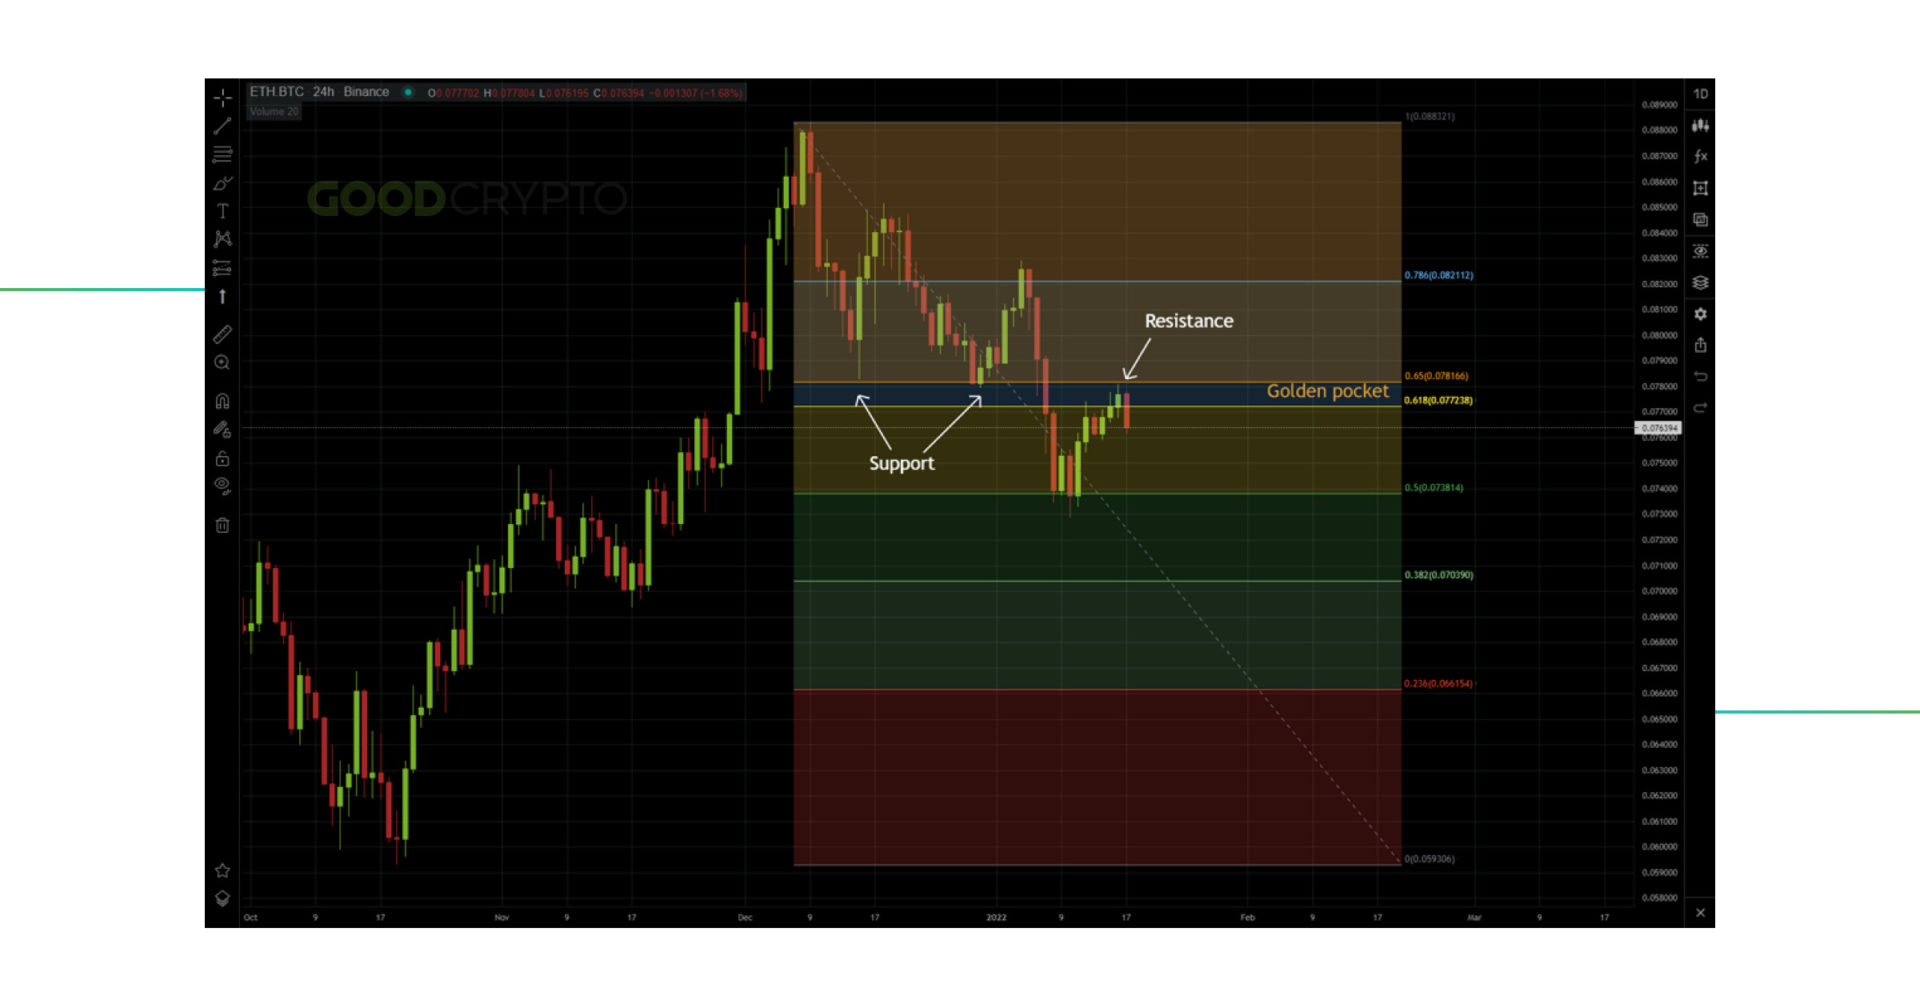
The Fibonacci retracement golden pocket level is another interesting strategy to have in your technical analysis toolset. The golden pocket is the level between the 0.618 Fibonacci retracement golden ratio and the 0.65 ratio. This zone is the level where the price is most likely to reverse during an uptrend or a downtrend.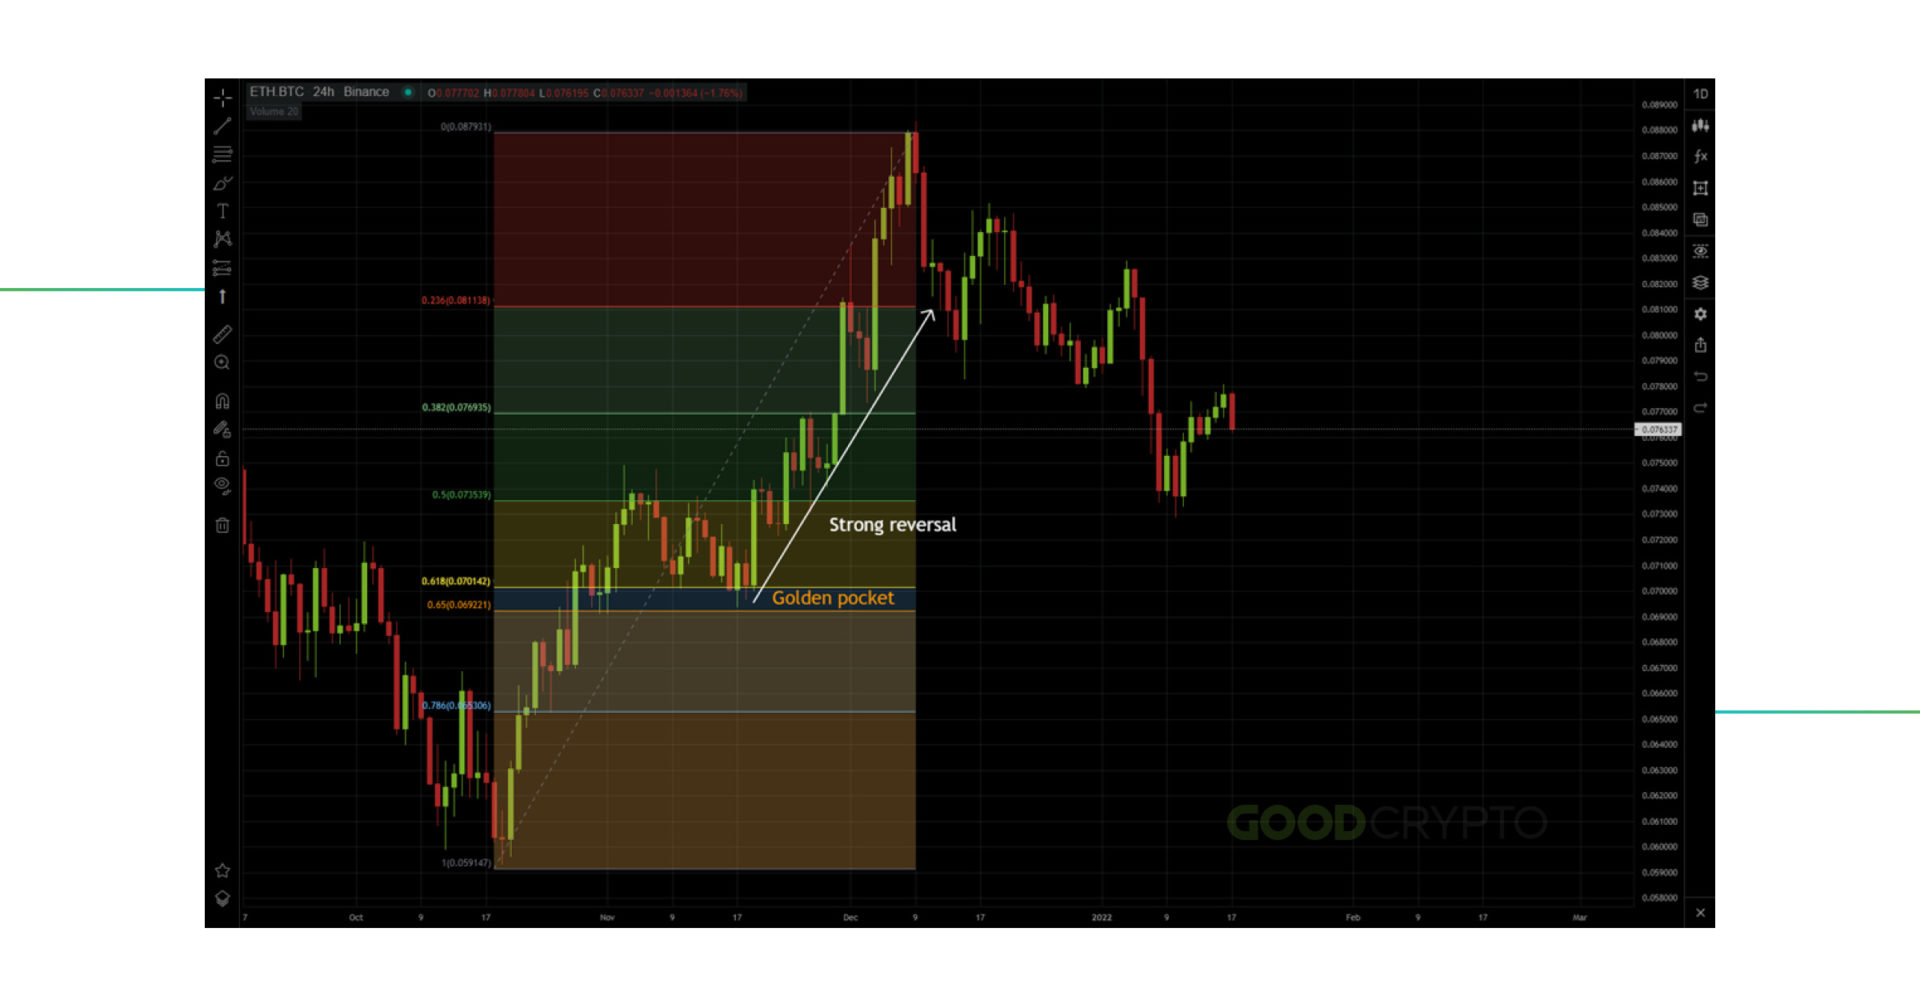
In the above example, (ETH/BTC) the golden pocket acted as a strong support zone for a bullish reversal from a 0.5 Fib retracement. In the example below, however, it acted as a support level in the downtrend. Once broken downwards, the golden pocket became a new resistance zone.
Worth noting is that we were able to provide every Fibonacci sequence crypto trading strategy in this article just by using our GoodCrypto trading app. However, GoodCrypto is much more than just a free tool for drawing Fibonacci trading ratios.
In addition to helping you chart your trading strategies, you can access a wide array of functionalities, including:
To conclude, GoodCrypto can be the perfect companion in the extremely demanding world of crypto trading.
Fibonacci in crypto is a powerful tool that can help you determine support and resistance levels, and thus, help you set up low-risk trading strategies. That being said, just like any indicator, you shouldn’t exclusively rely on Fibonacci ratios in trading. They become much more reliable when used in combination with other indicators such as trading chart patterns or the MACD indicator. Consequently, integrating the Fibonacci retracement trading rules depicted in this article into your technical analysis toolset will allow you to have better insight into market swings.


Share this post:
March 17, 2023

We’re proud to be the first to launch a DCA bot for DEXs! Enjoy the same DCA trading experience you’re used to on CEXs but with no technical limitations.

Discover the power of MEXC with GoodCrypto! Advanced tools like bots, trailing stops, and smart TA signals and TradingView webhooks at your fingertips.

Dollar Cost Averaging (DCA) bot has become an increasingly popular trading tool due to its convenience, the versatility of its modes, and trading efficiency....

Dollar Cost Averaging (DCA) bot has become an increasingly popular trading tool due to its convenience, the versatility of its modes, and trading efficiency....