
We’re proud to be the first to launch a DCA bot for DEXs! Enjoy the same DCA trading experience you’re used to on CEXs but with no technical limitations.
July 2, 2025
Technical analysis is often called magic. Analysts seem to be forecasting the weather and able to predict what is about to happen next, making profits by doing so.
Besides news or fundamentals, an important part of predicting the movements of a market lies in what can be seen in the chart. That is exactly how technical analysts create predictions.
This Good Crypto article aims to share the knowledge on how to interpret charts and see more than other traders or investors. Trendline trading and analyzing support and resistance is a crucial part of knowledge when trading price movements.
The free Good Crypto app provides all the tools needed to analyze any crypto price chart and trade it. In the previous articles, we already covered the main trading features of the app, as well as the most popular support and resistance indicators available in the app, like Moving Averages, Bollinger Bands, RSI, the Ichimoku Cloud, and more.
Surprisingly, one can often successfully interpret cryptocurrency charts even without technical indicators. Some traders even think that technical indicators add unnecessary information that might eventually be distracting. Every technical analyst will have their preference on how to analyze cryptocurrency charts. Crypto chart analysis is not an exact science, it’s merely an opinion based on the interpretation of historical data. To formulate this opinion every trader devises her system.
How to read crypto charts without indicators then? Many successful traders trade cryptocurrency charts simply based on trend lines and support and resistance levels. In this article, we will review how this type of trading works exactly. But let’s start from the basics and answer the question “What is a trendline?”
The definition of trend line:
A trendline is a line that connects the price’s swing highs and swing lows of a trending market.It’s as simple as that.
We’ll dive into how to draw trendlines next.
Drawing trend lines comes with a few rules… Let’s find out how to make a trend line.
These aren’t complicated yet important rules when drawing a trendline.
So, what does a trendline show? It represents an edge, a certain floor or roof for the price movement.
Let’s open the free Good Crypto app and start to draw a trend line.
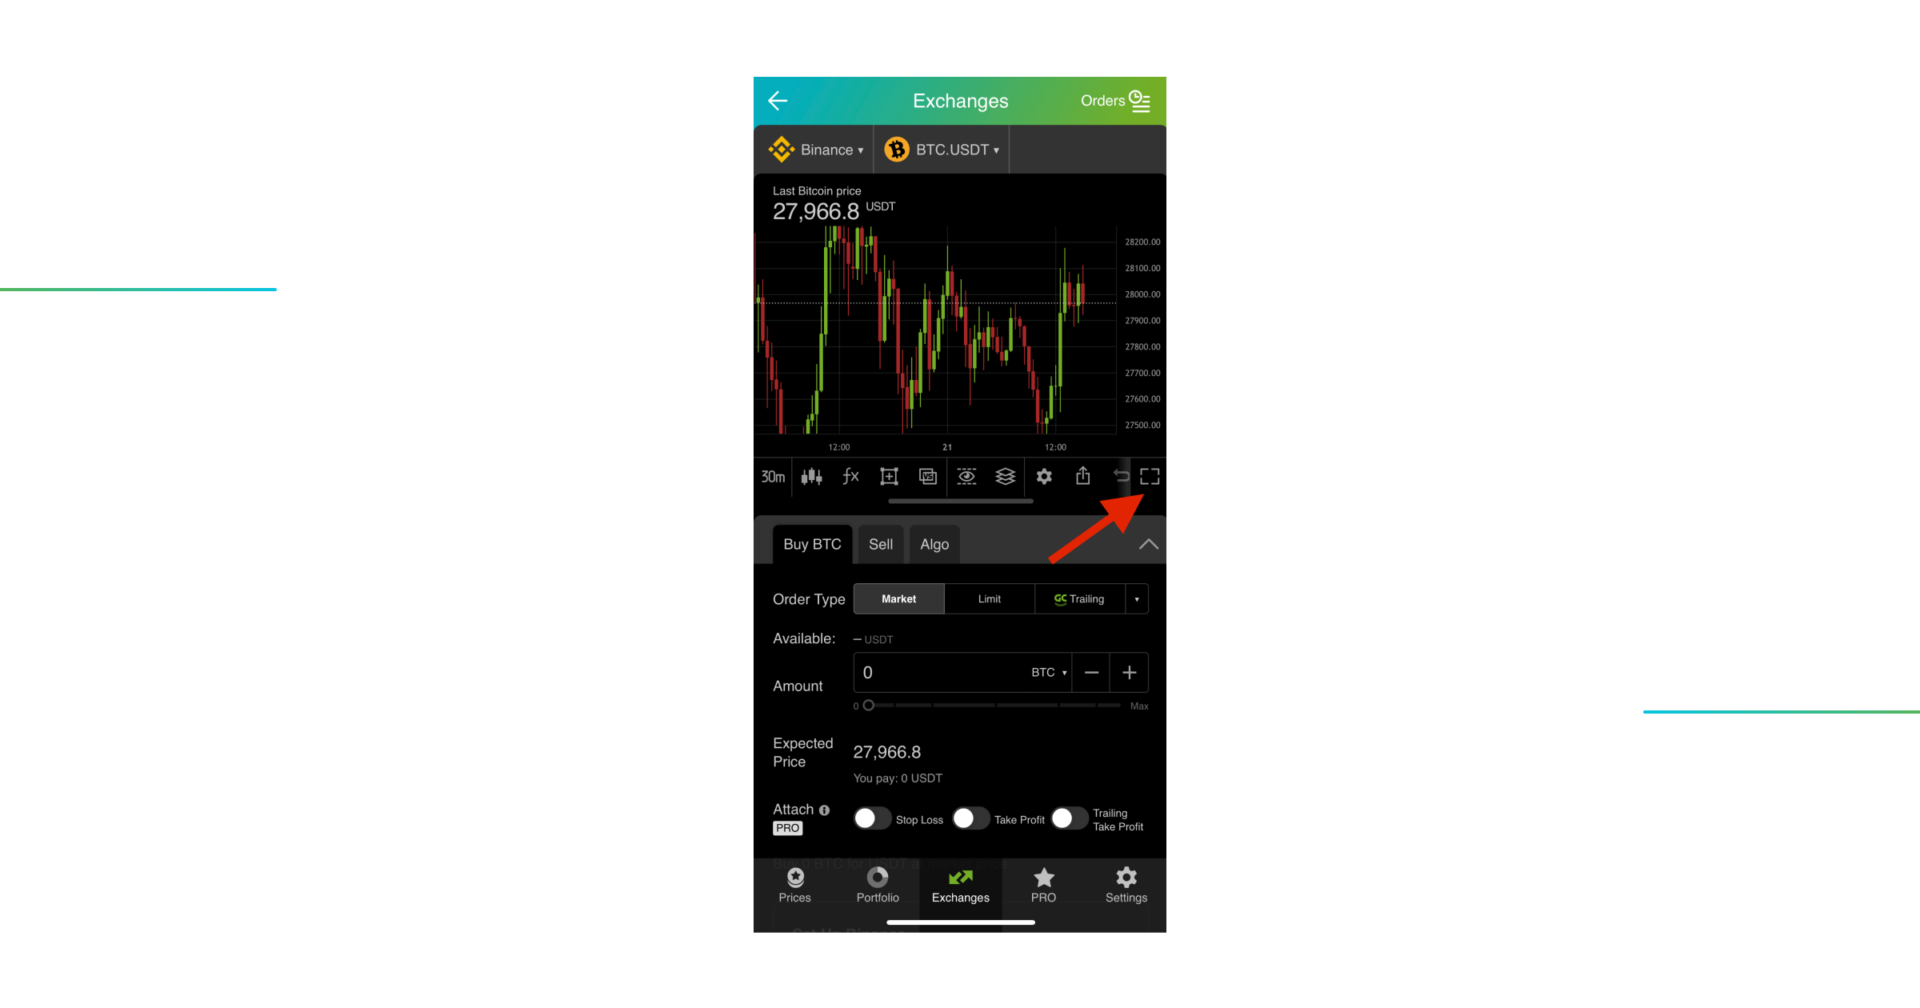
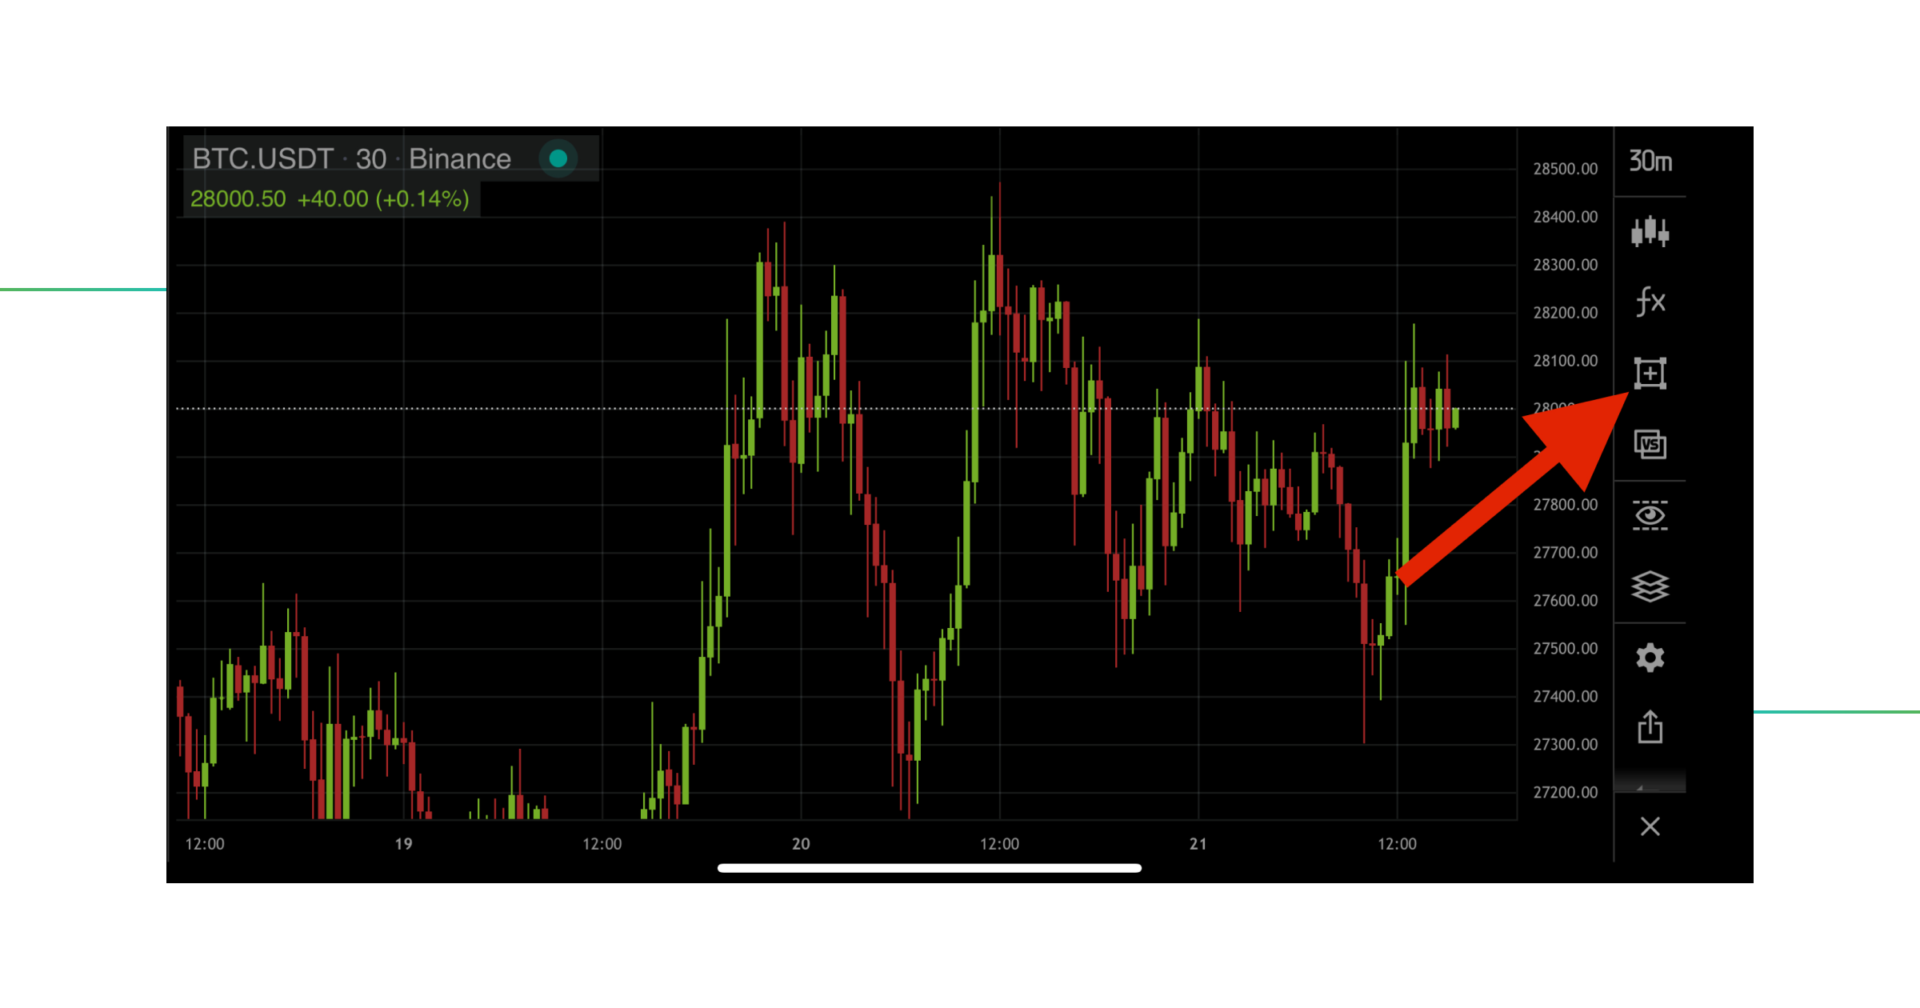
Click the icon on the right side of the screen to open more tools.
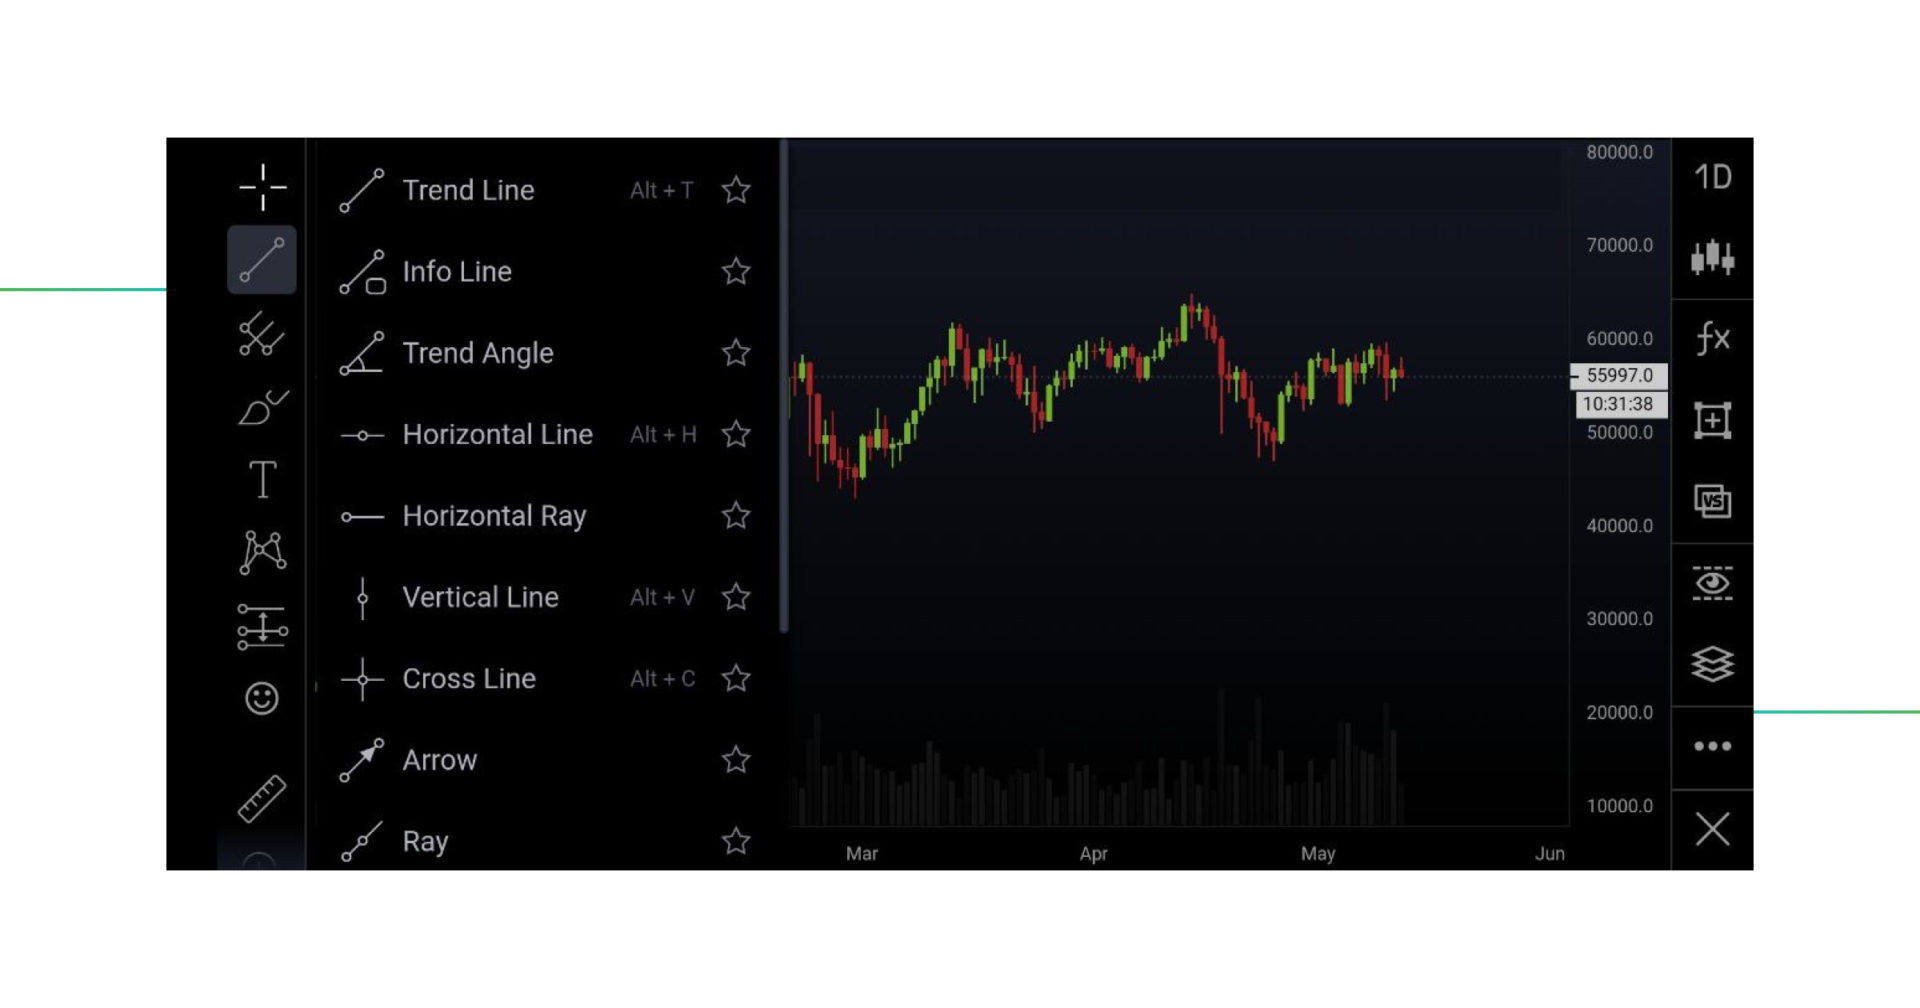
Once inside the toolbar on the left side, you can find the Trend Line tool.
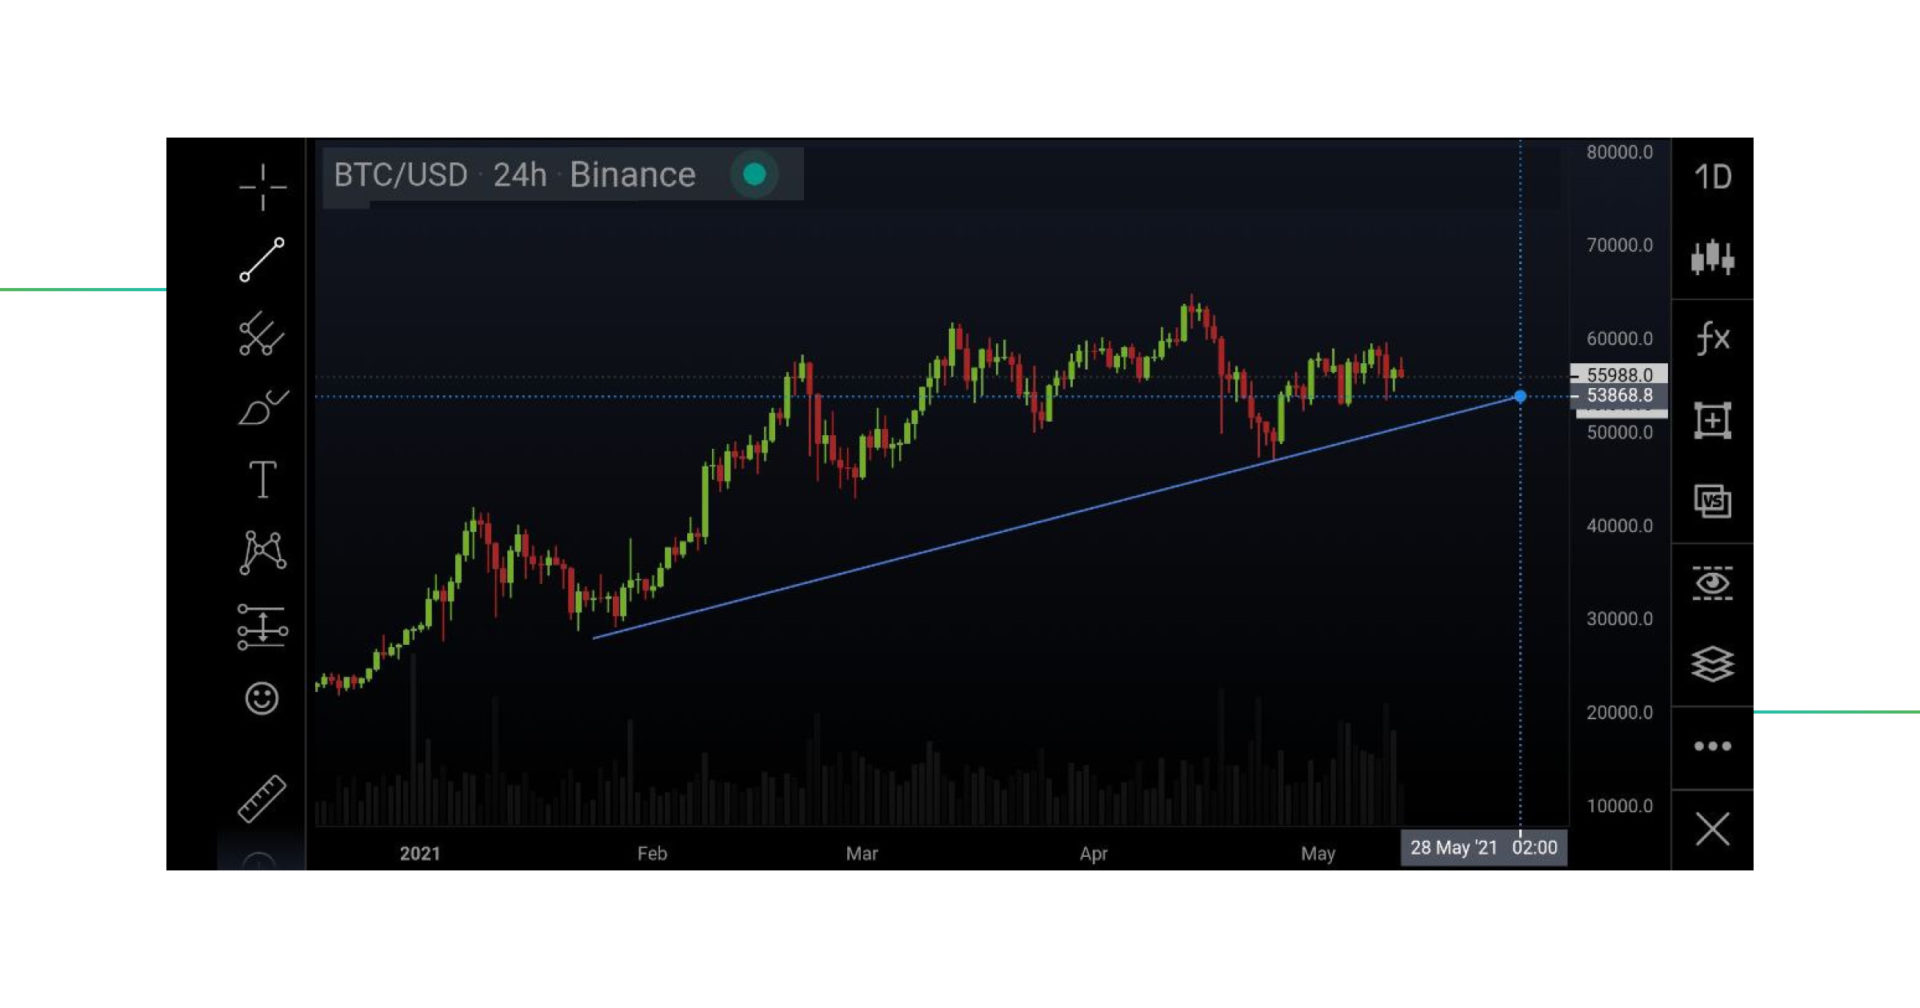
Tap one time for your starting point, and tap a second time for the endpoint of your line. You can drag and adjust however you wish!
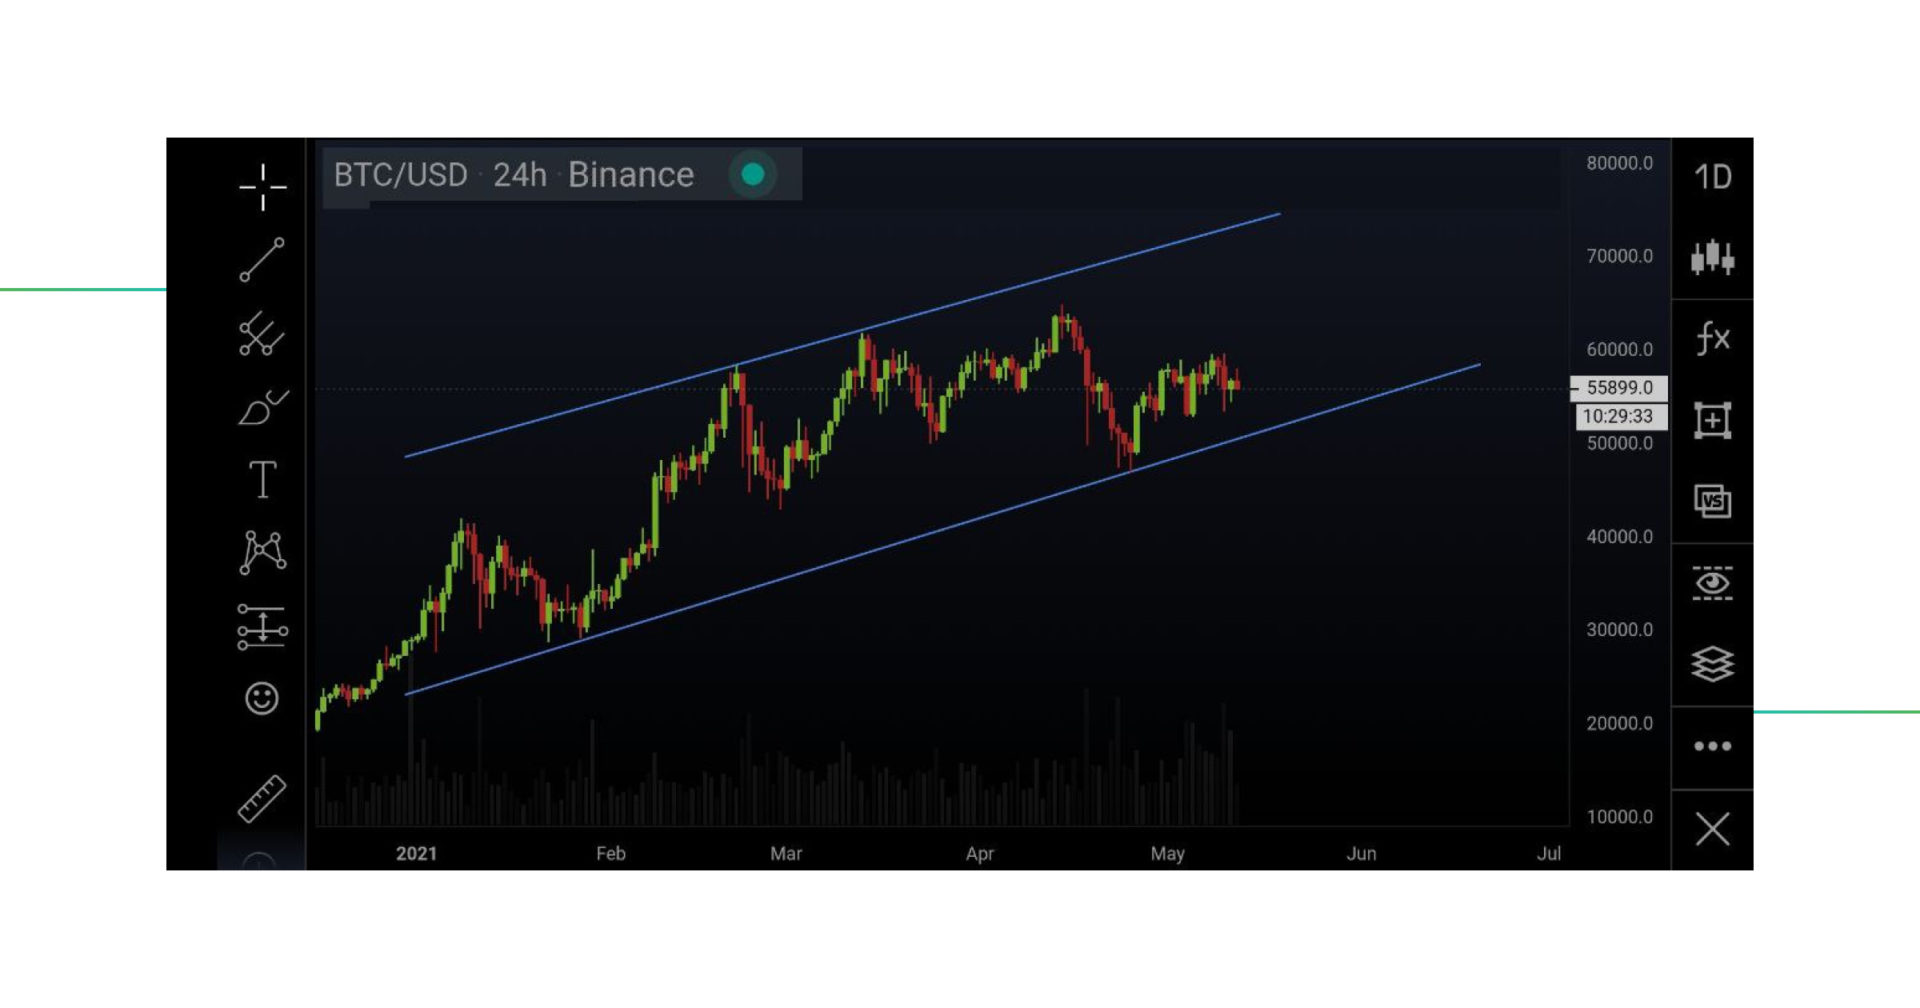
Perfect! The lines touch 2 points and do not cut any candles. These are two valid trendlines.
We have respected the rules and have learned how to draw trend lines for technical analysis! Based on this knowledge, you can continue to trend line analysis.
It’s important to know that there are many possible trendlines. It takes intuition and practice to create the most logical ones. It’s also better to reduce the number of lines, to avoid chaos.
Trendlines show you the direction of the market, and the points where the price is most likely going to find support and resistance.
When a trend line is broken, it’s called a breakout. This can provide you with trading opportunities because it often creates a strong movement and triggers high liquidity.
To put it simply, a trend line is telling you the potential behavior of buyers and sellers at a certain price during a trend. When a line is broken, it can indicate a reversal of the overall market’s behavior.
Trendlines are drawn purely based on the visual appearance of the data. There is no trend line equation calculator, trend line math, or any other way of knowing how to calculate trend lines.
Support and resistance lines are drawn horizontally, unlike trend lines. Trend lines show a trend and therefore slope either up or down.
These levels are seen as regions, rather than lines. A support region or zone is simply a level where the price has been supported, or resisted, more than once before. This means that the support and resistance indicator can identify levels of importance for traders. Identifying support and resistance levels is of great importance when trading.
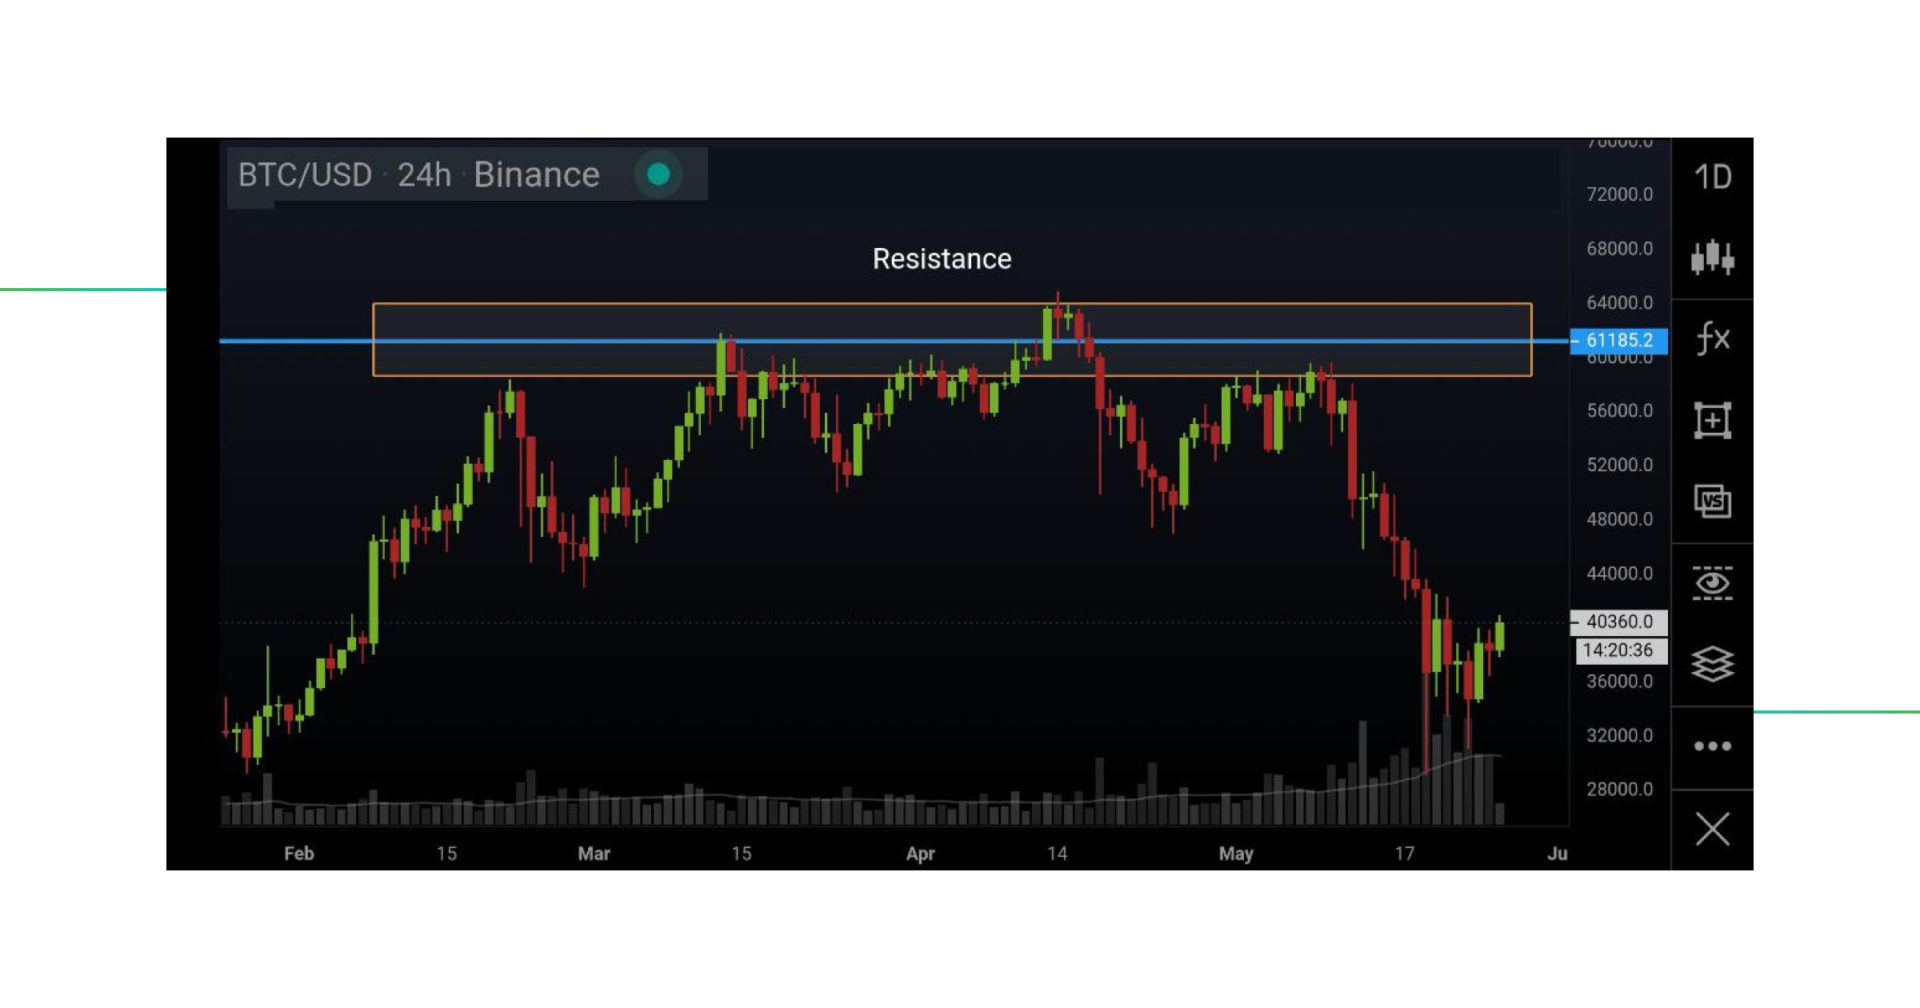
This example on the daily BTC/USD chart shows how the resistance is a region from $58,000 to $64,000 (orange box). Depending on the timeframe, regions can be between 1% to even 10% big. Only when the price would make the resistance region into support, continuation is expected.
Let’s learn how to find support and resistance levels.
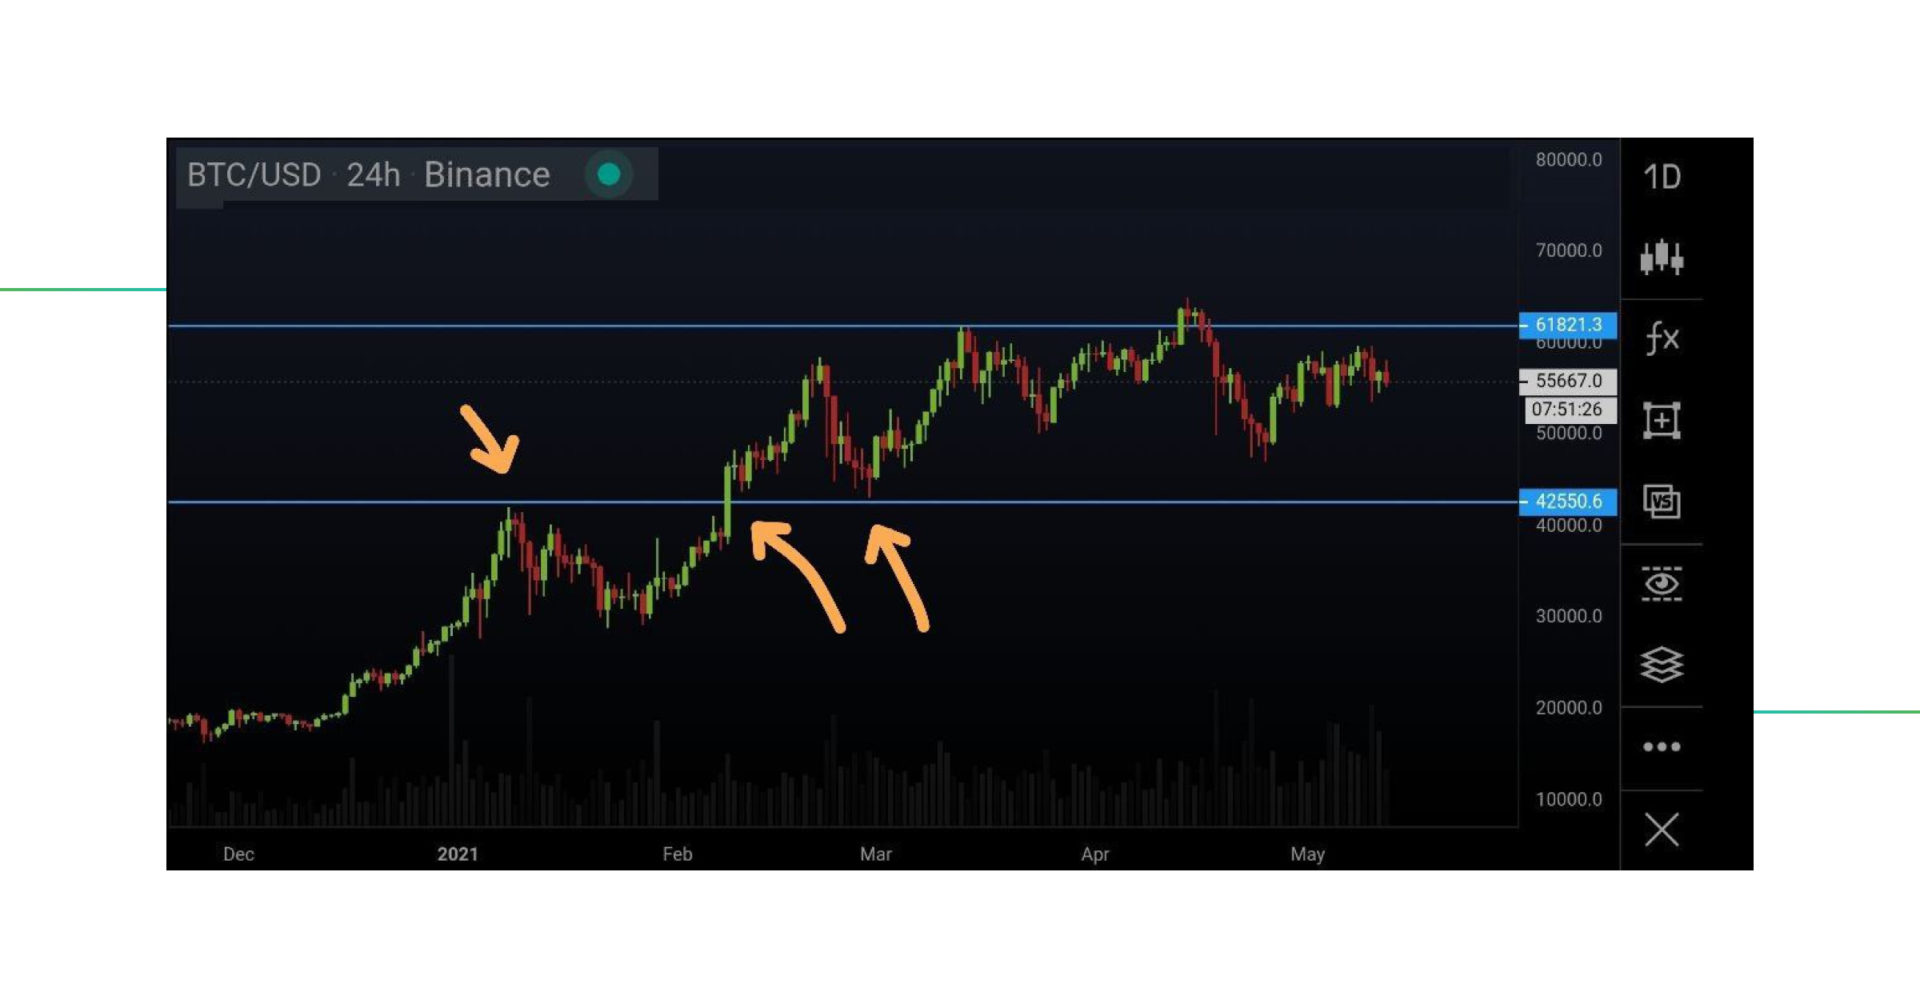
This is the BTC/USD daily chart, showing horizontal support and resistance lines.
A trend line should not be drawn through any candles – it cannot be broken. However, for a support and resistance level, it’s different since it should be treated as a zone. A zone is less exact, it’s a field that can be wide. That’s why you see the price move inside the resistance zone above and then go back down into the range.
In the example above, we see how the resistance is strong at the first arrow. This resistance was broken with the second arrow, and eventually became the support at the third arrow.
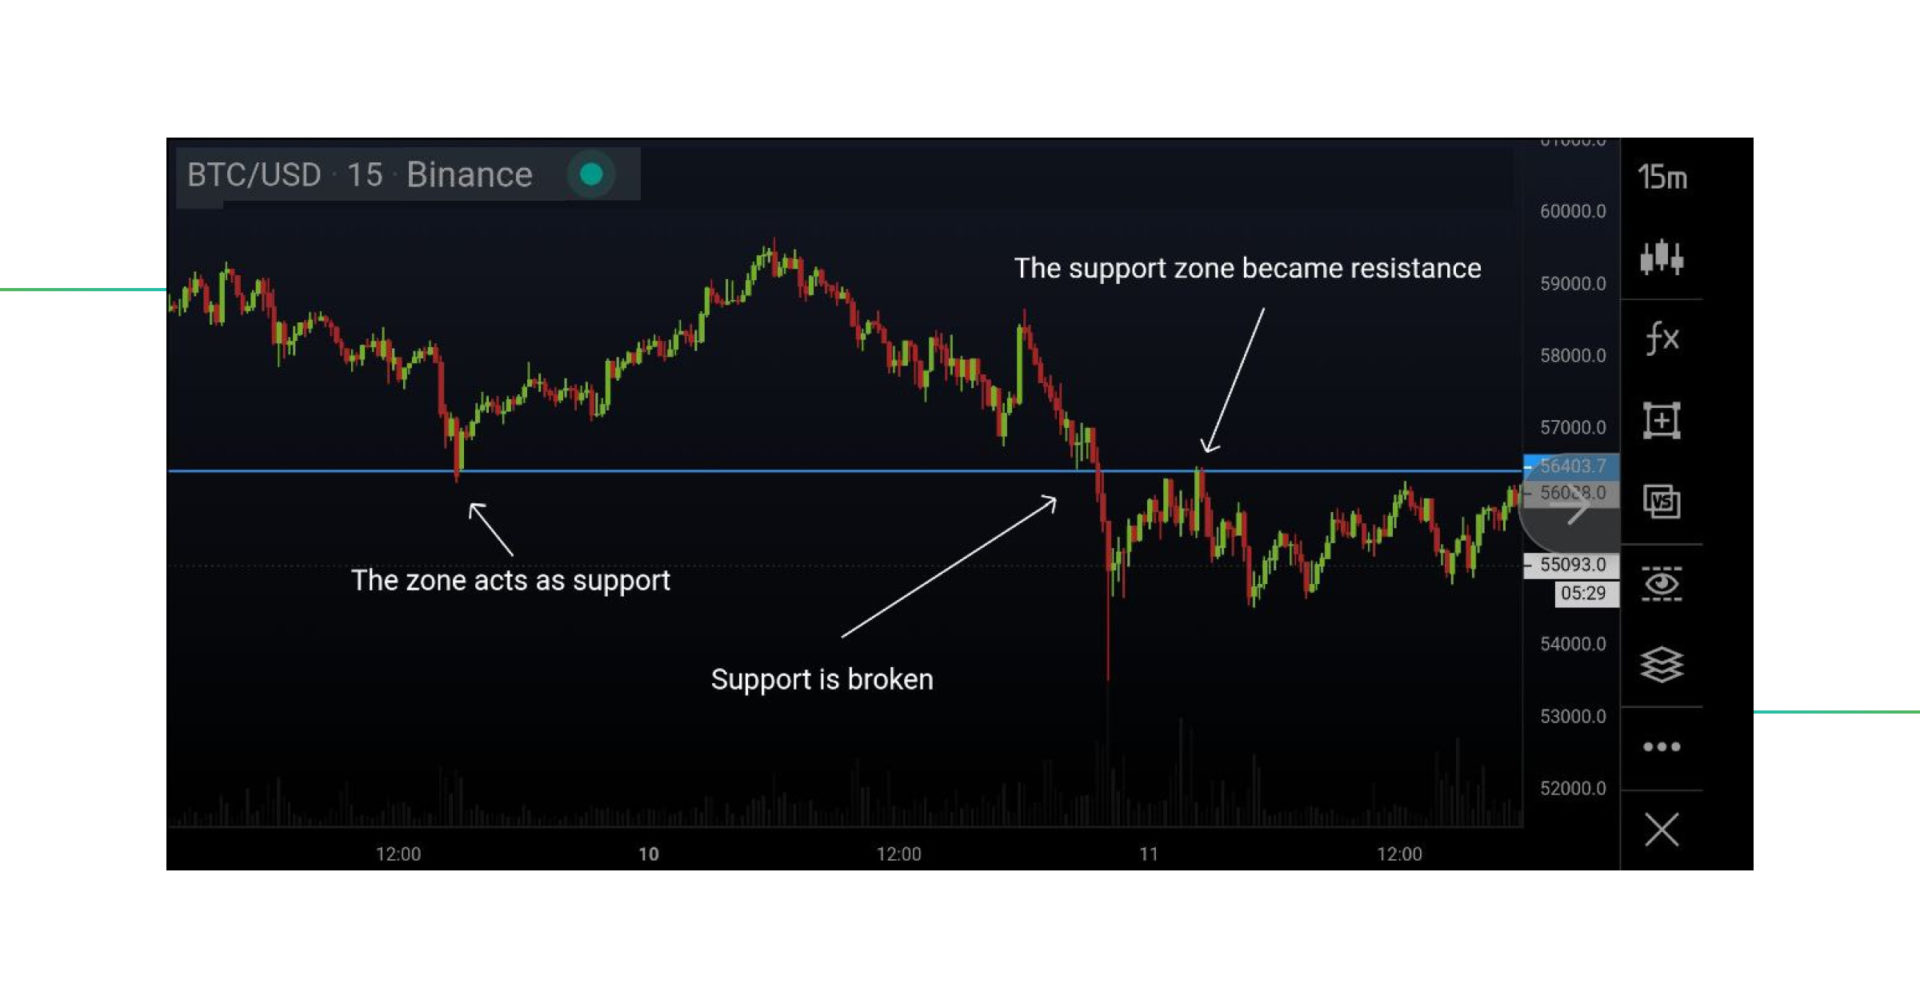
Zooming in. This is the 15-minute chart of BTC/USD. This example shows how a previous support level can become a resistance level after it has been broken. This is called an S&R flip.
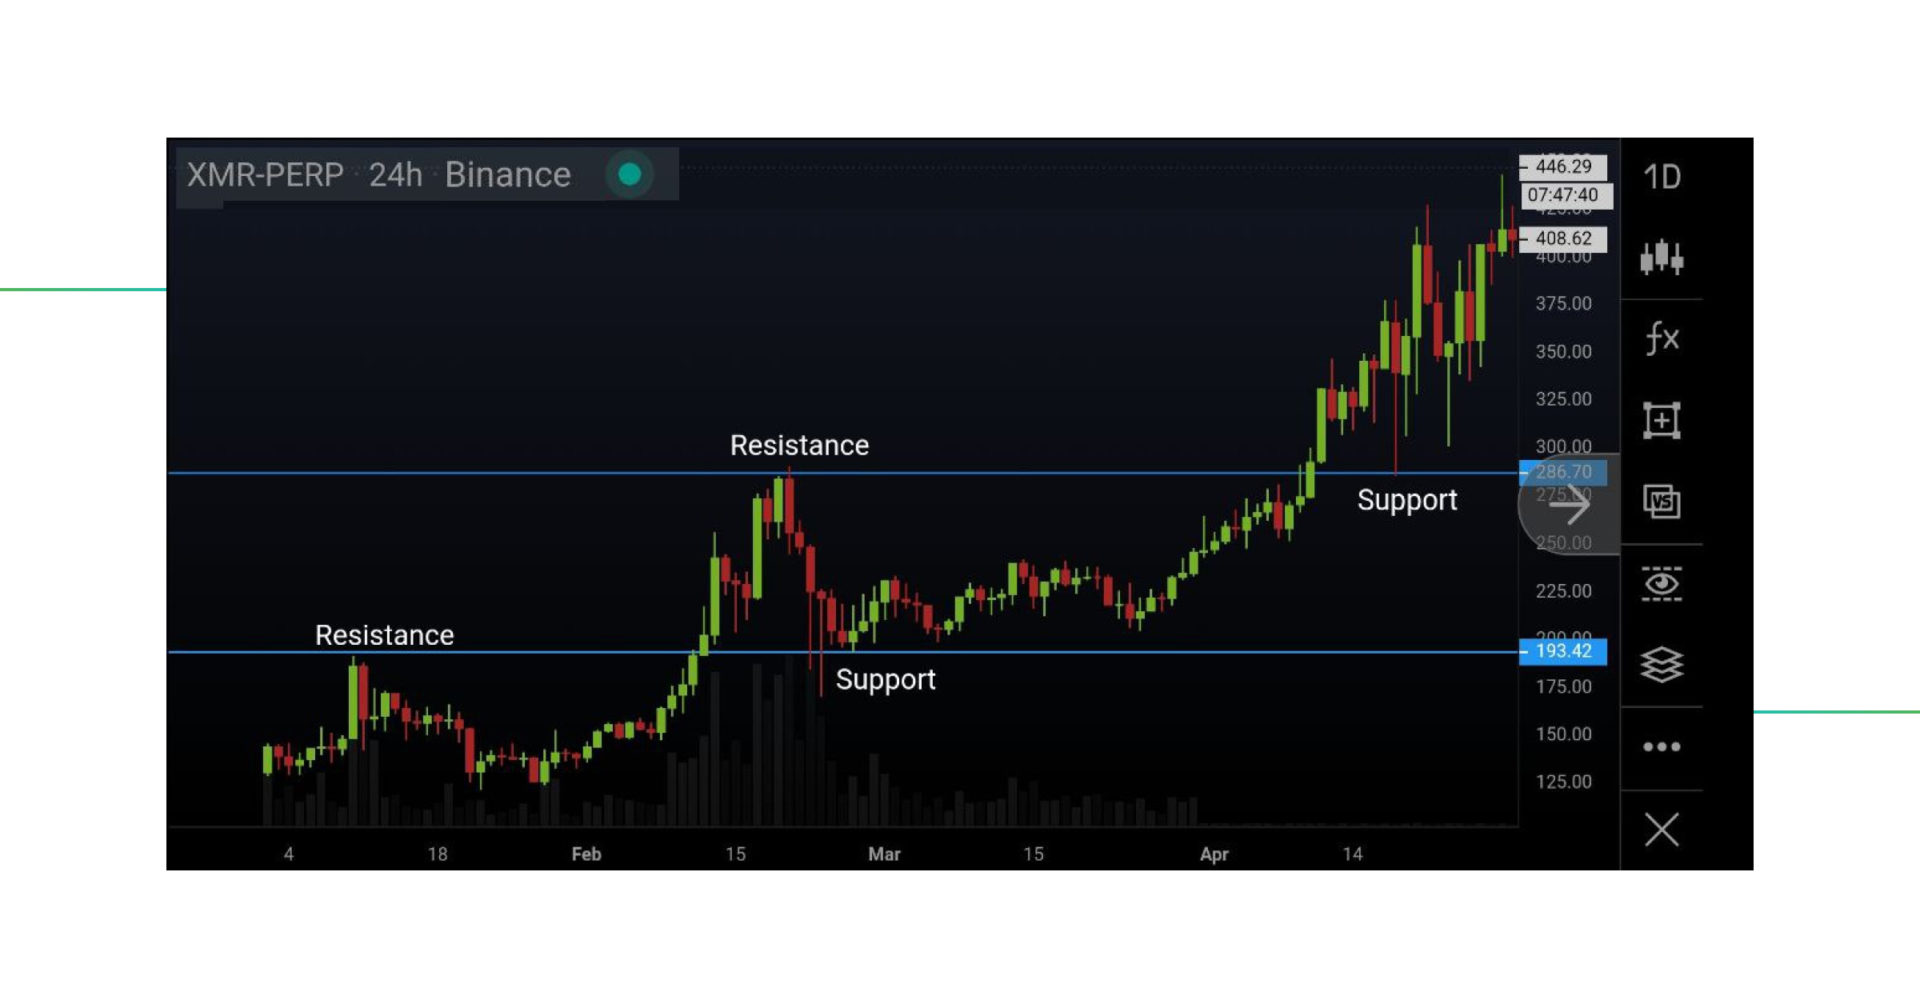
When heading over the XMR/USD, the daily chart, we see how Resistance levels can become Support levels.
Showing support and resistance on charts helps traders identify the bottom or the top of price movements. Support and resistance trading and having a good support and resistance trading strategy is therefore very respected. Trading support and resistance is not always easy, because it’s less exact than a trendline.
Support and resistance in technical analysis are fundamental. They are part of price movements and recognizing them gives you an edge in the market.
Since trend lines are a more exact tool compared to support and resistance, they are providing the opportunity to create a more accurate trendline trading strategy. This strategy can be applied not only to cryptocurrencies but also to stock market trend lines.
We have already learned how to draw trend lines technical analysis charts. Now, how can we get into trading with trend lines only?
A brief overview:
There are two types of trends, an upward trend, and a downward trend. If the market goes sideways, it is in a range.
Upward trend definition:
When a market successfully makes higher highs and higher lows.
Downward trend definition:
When a market successfully makes lower lows and lower highs.
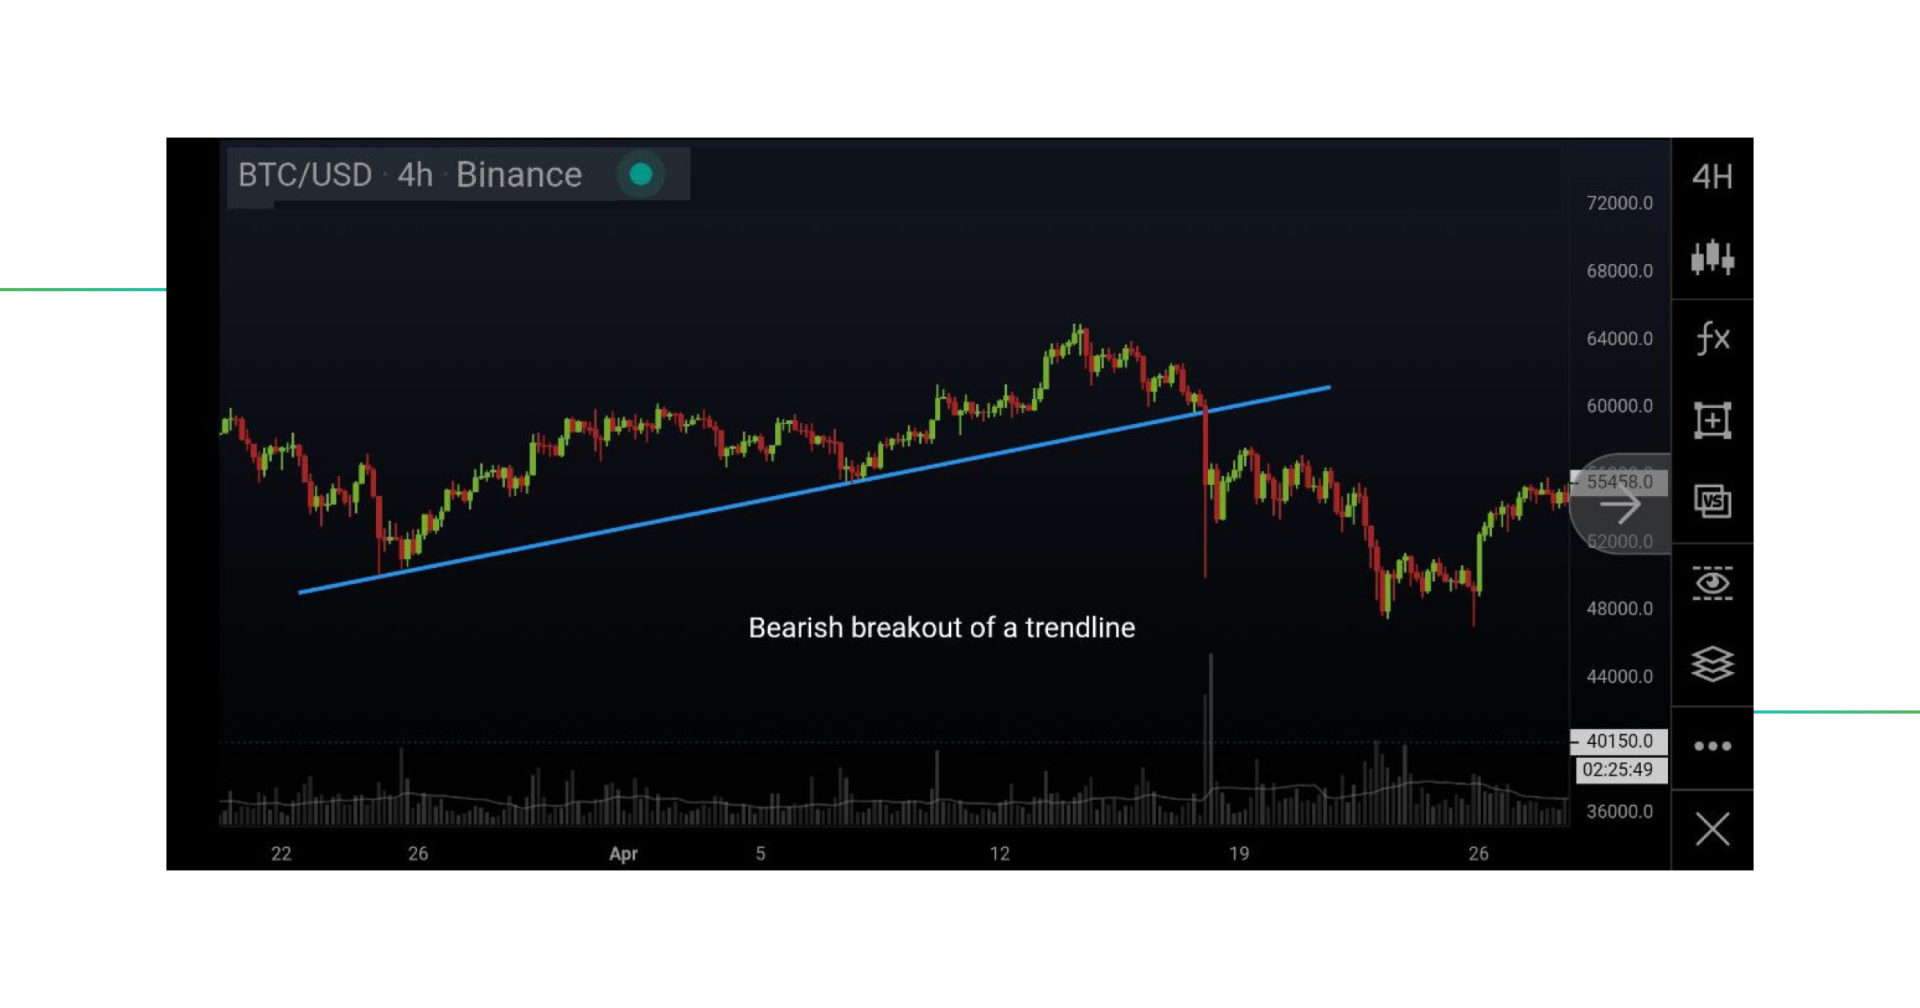
When or if the price breaks out of an uptrend or downtrend, it will most likely make an aggressive move.
When the price breaks out of a downtrend, it’s bullish.
When the price breaks out of an uptrend, it’s bearish.
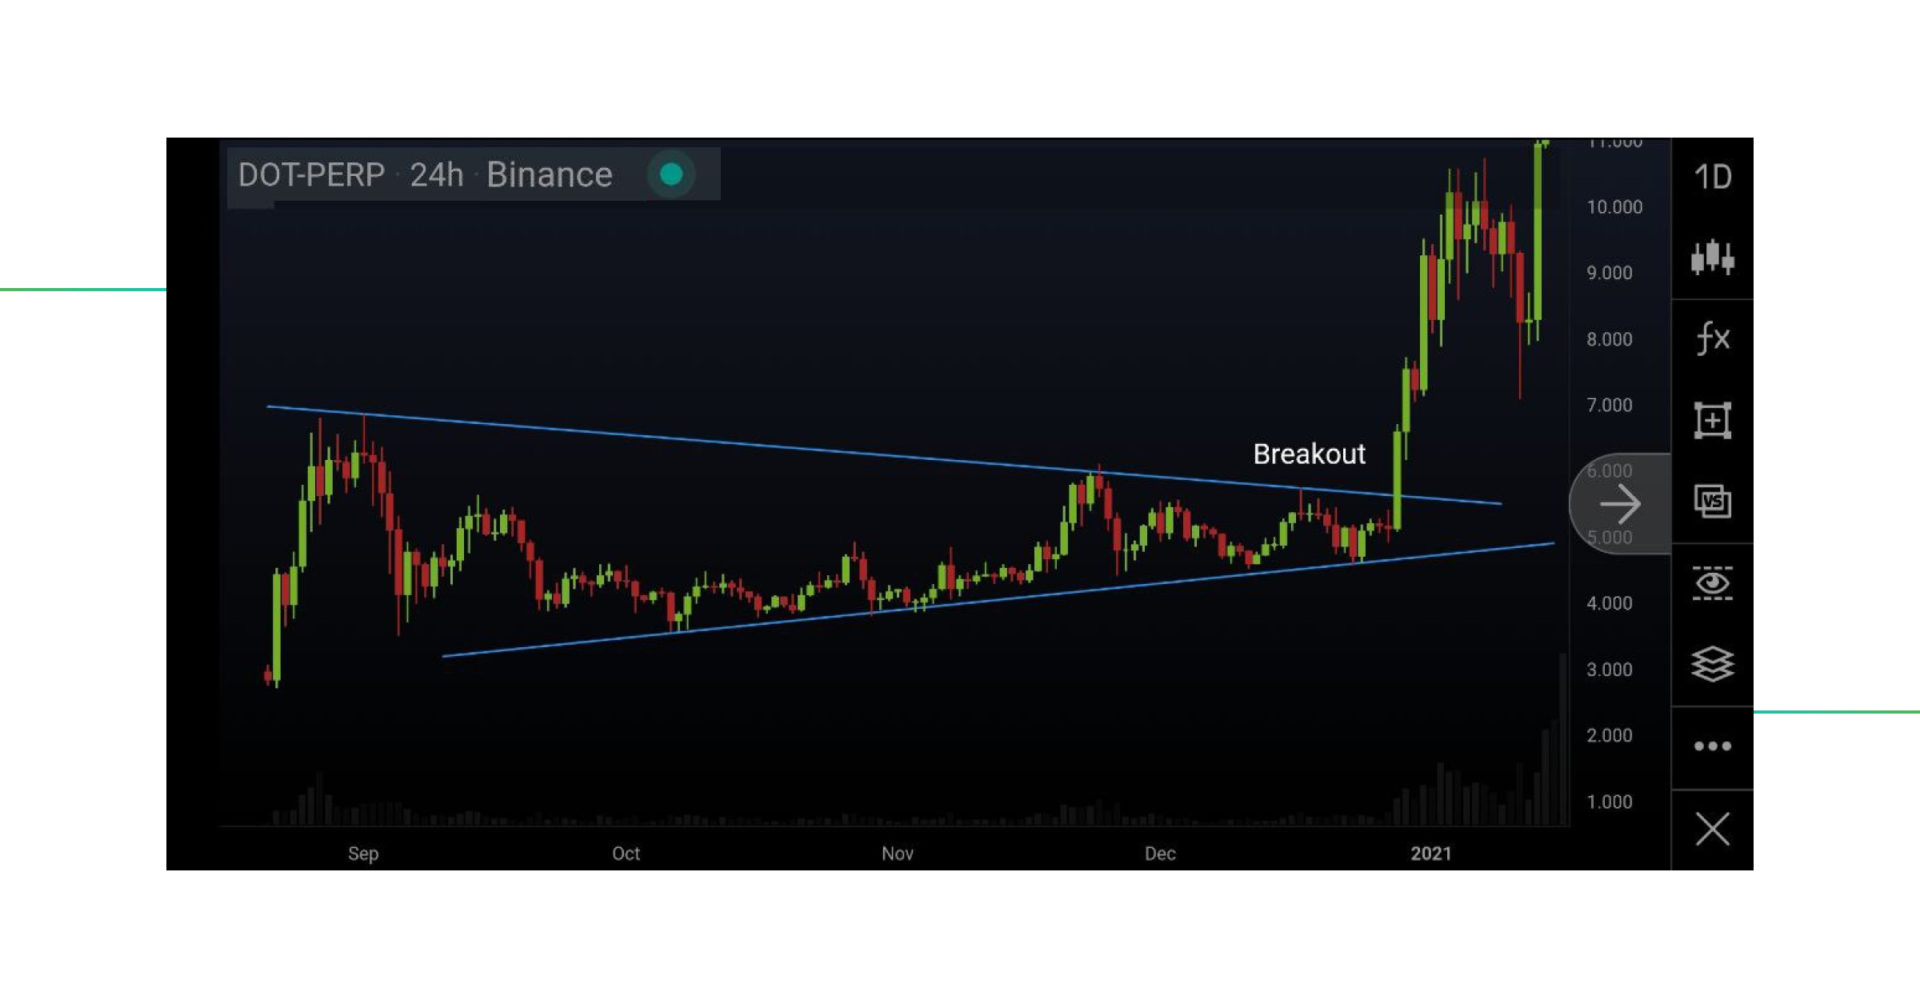
This example shows the daily chart of DOT/USD. Both trend lines above and below have been respected beautifully. Once the breakout happened to the upside, a bullish confirmation was given and the price doubled in a very short time.
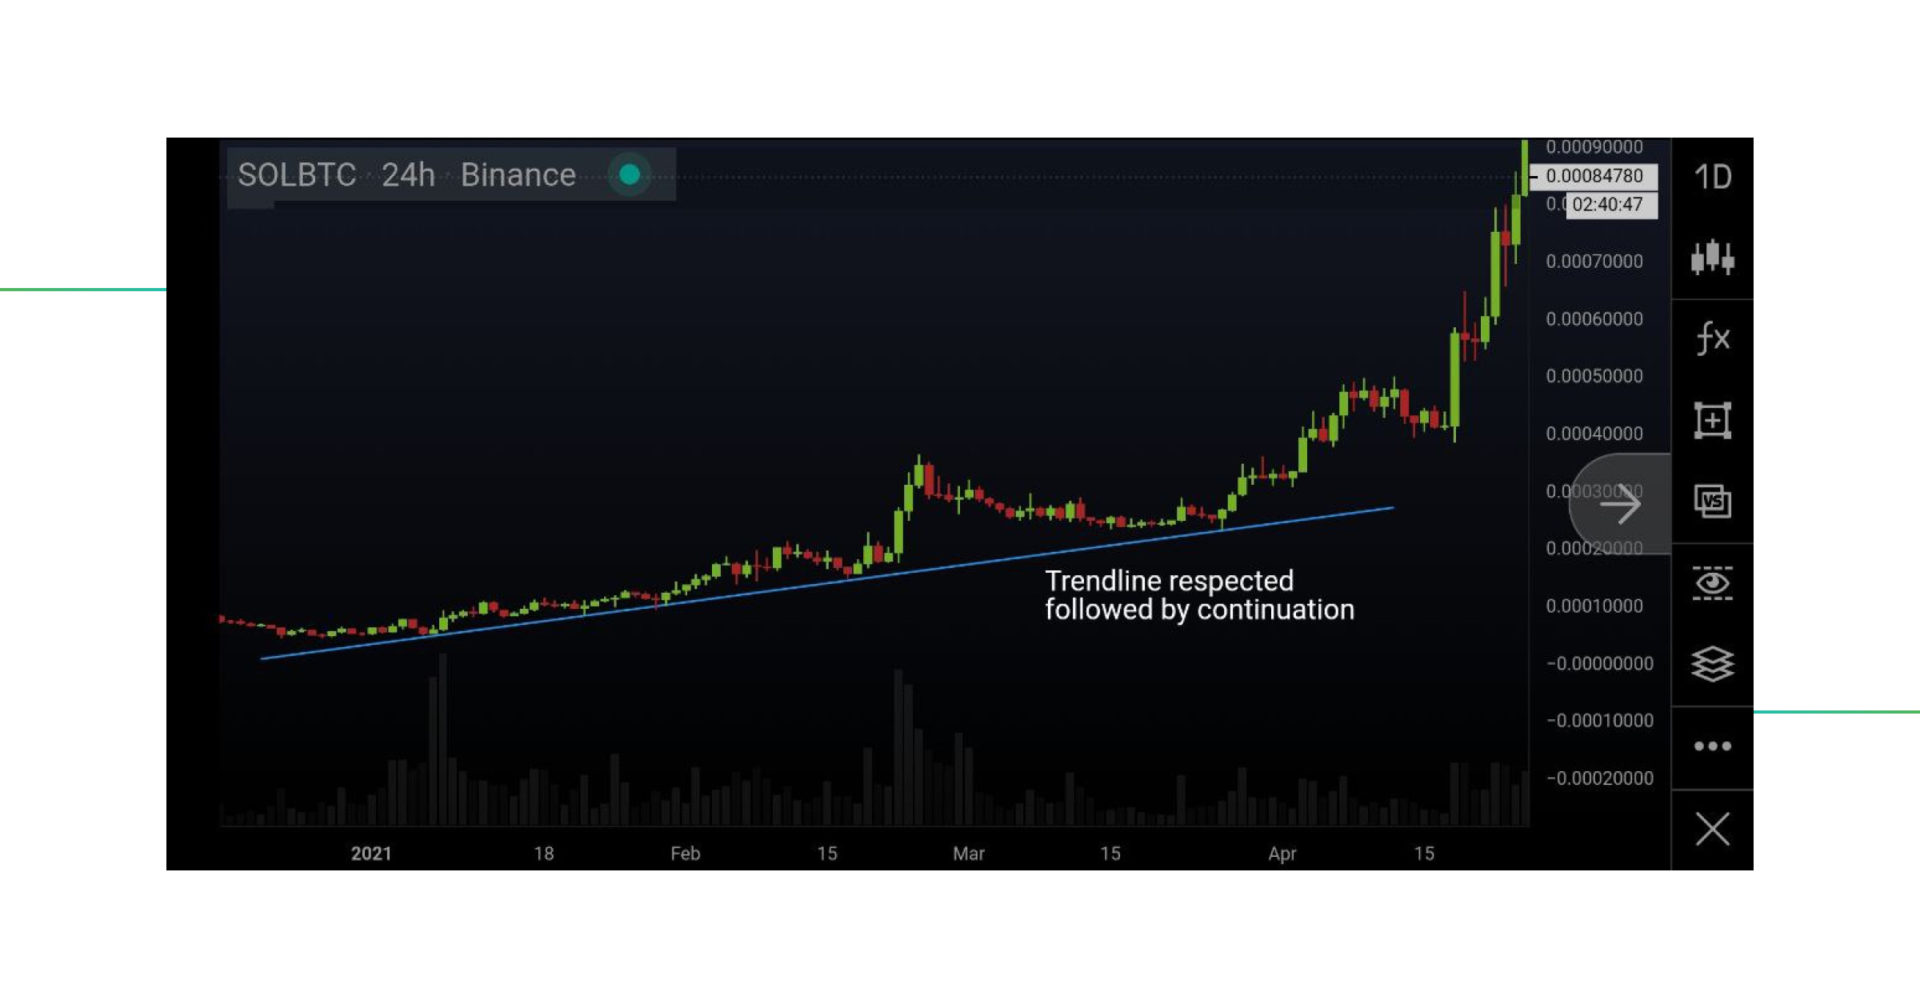
This daily chart from SOL/BTC shows a great example of a trendline that is respected. After several touches, the support grew stronger. Eventually, the price took off.
A trendline is only confirmed after 2 touches. This means an entry would have been possible on the 3rd or 4th touch, with a Stop Loss order right below it.
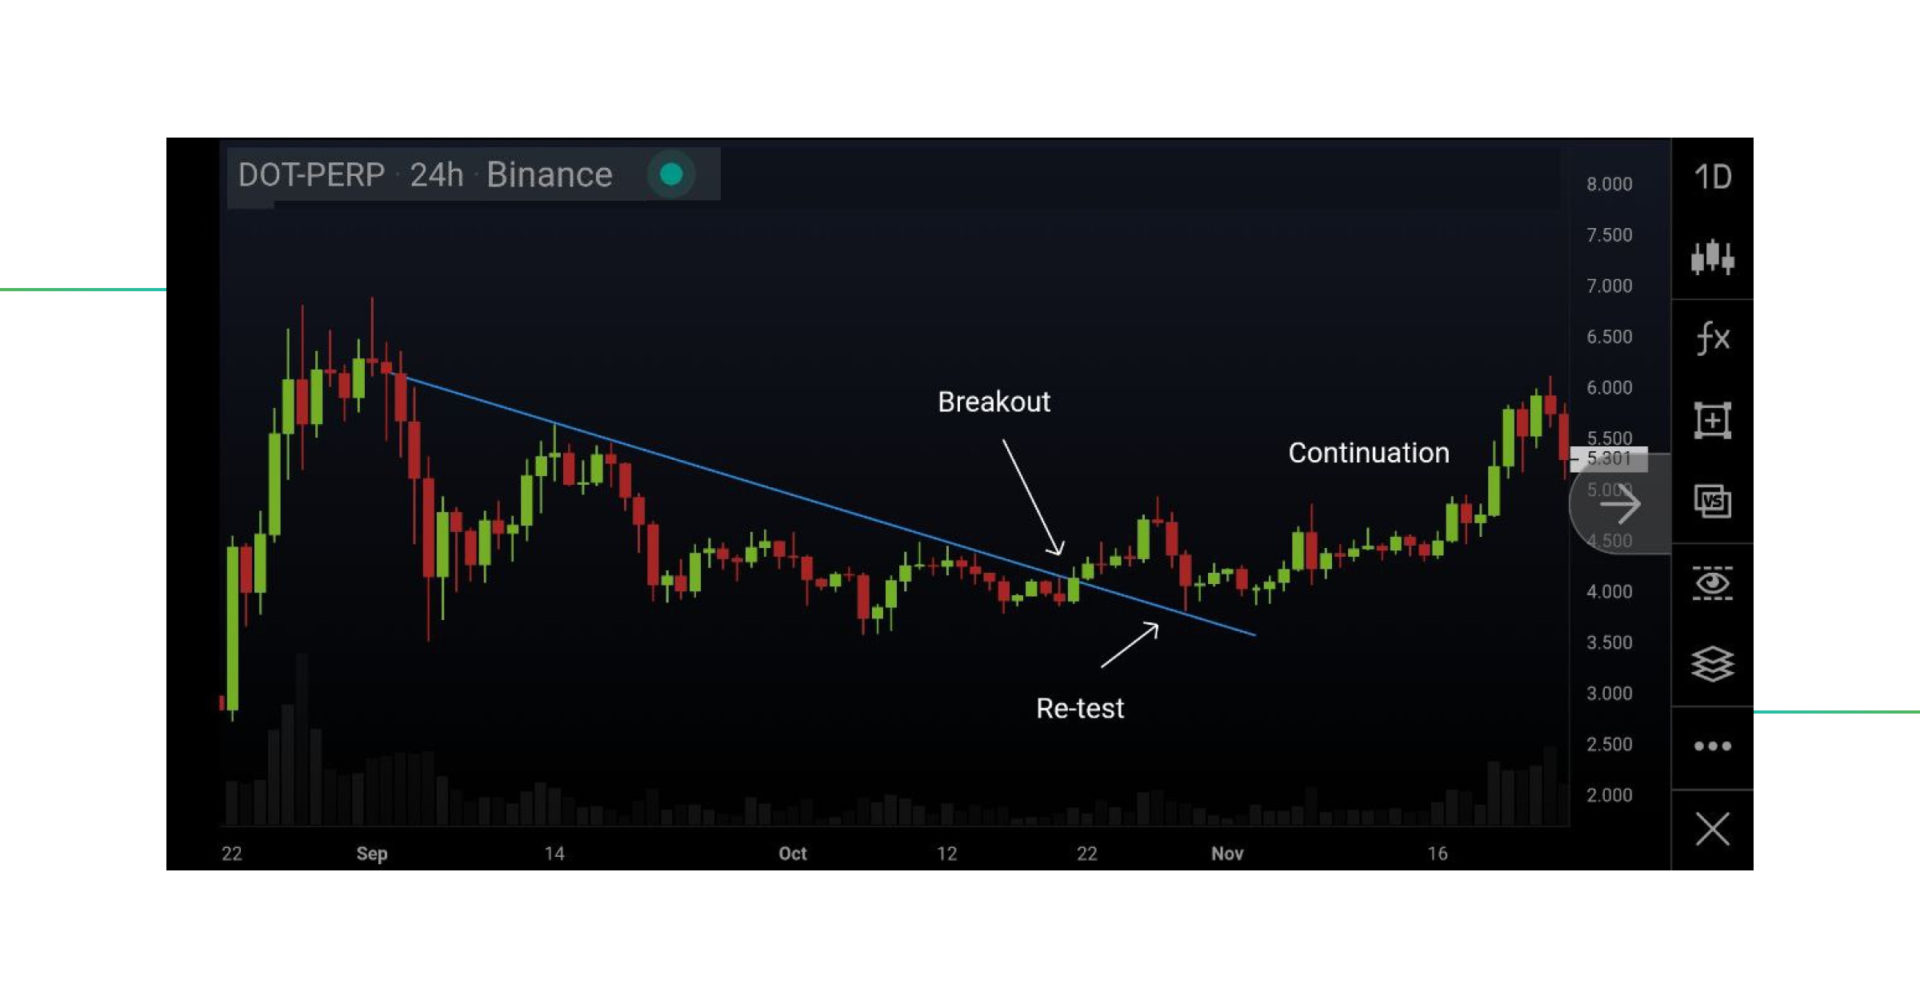
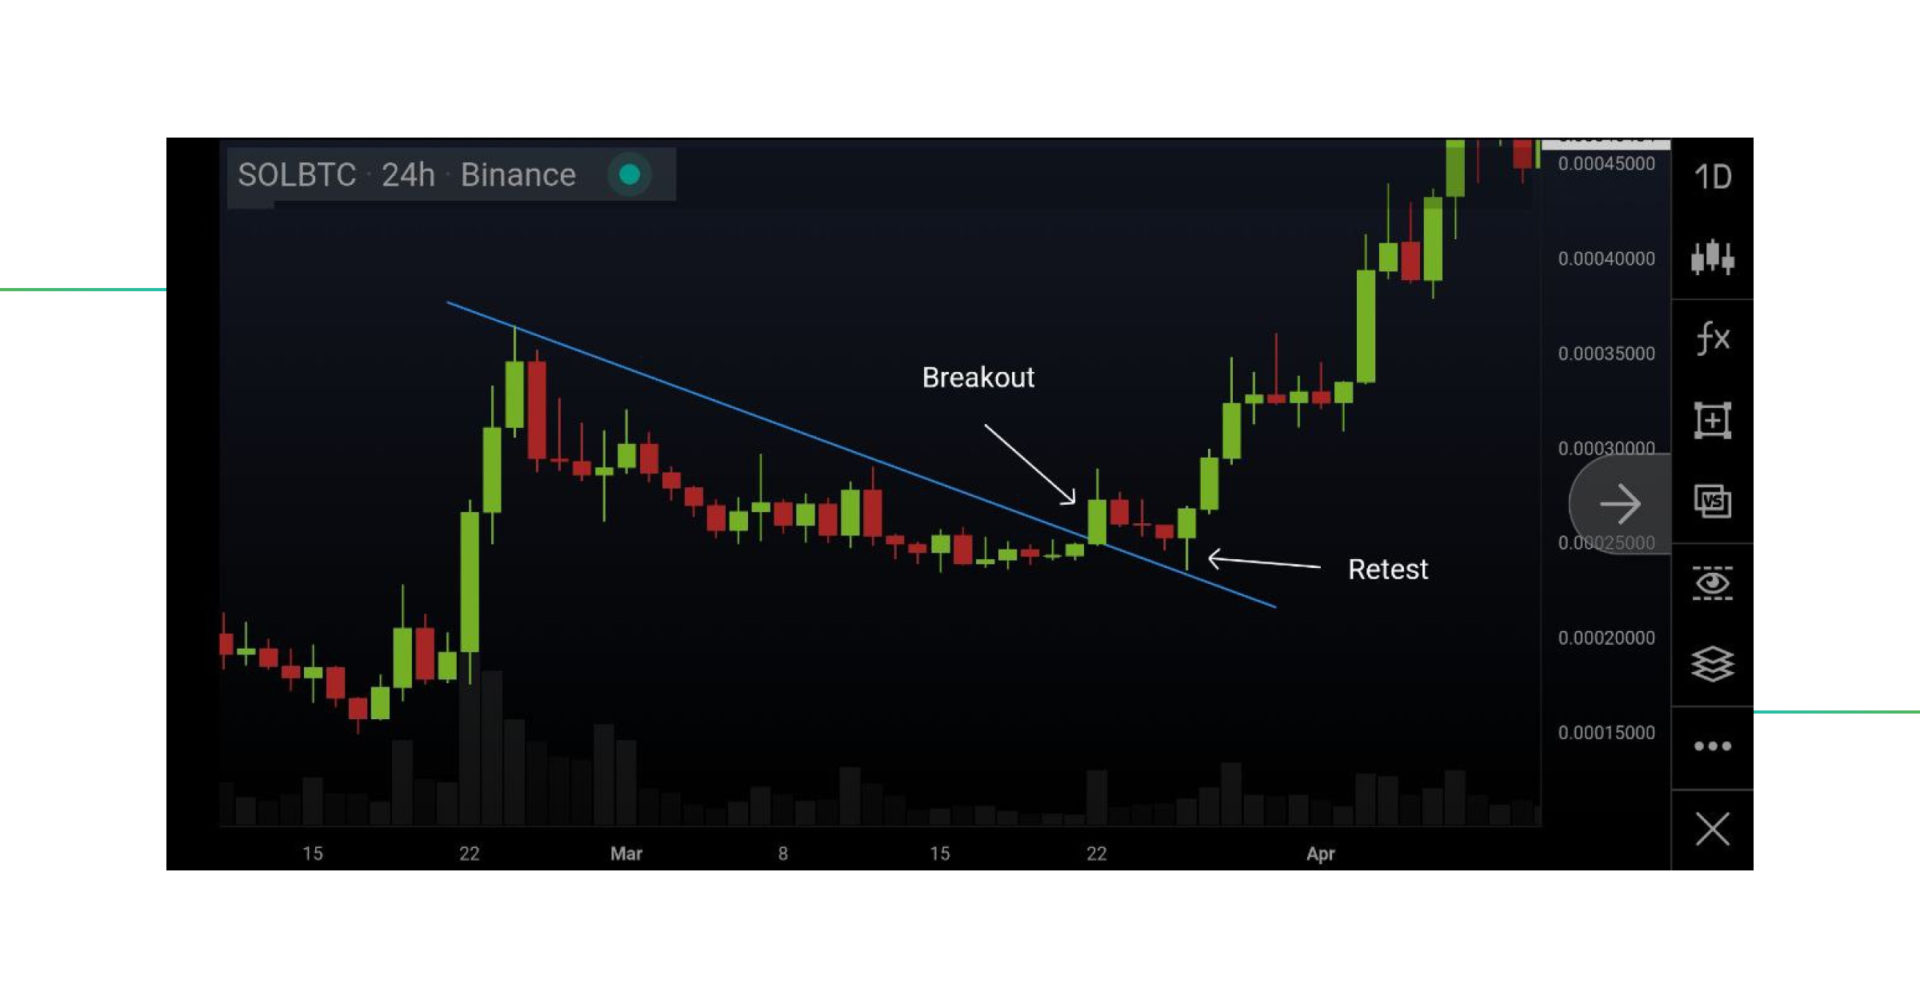
Both the charts above from DOT/USD and SOL/BTC show a breakout with a retest.
What is a retest? It is the moment when the price breaks out of a trend line (resistance level) and returns to that line in the opposite direction (which is now support level). If the trend line then becomes a support trend line instead of a resistance trend line, you can expect greater odds of seeing a continuation of the breakout.
By waiting for confirmation, you allow yourself to be patient and only act on facts and not emotions. Trading with trend lines only is perfectly possible and it helps to reduce FOMO and greed.
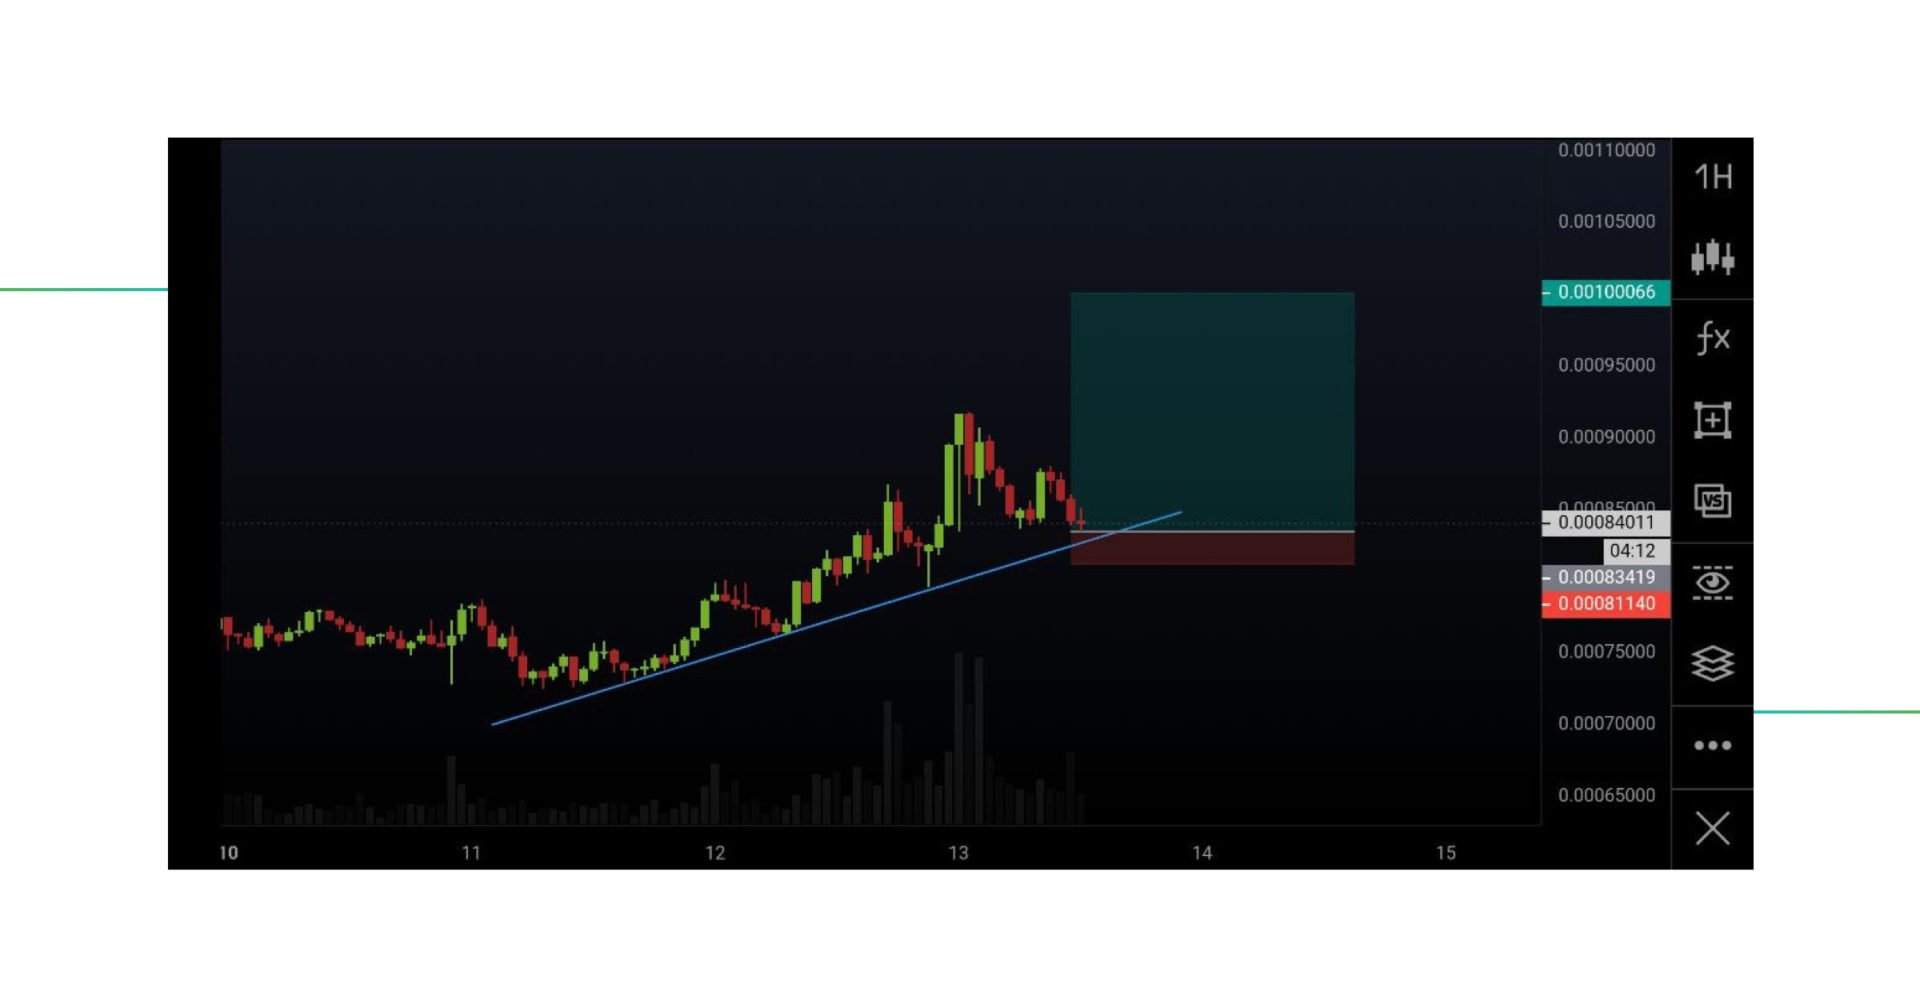
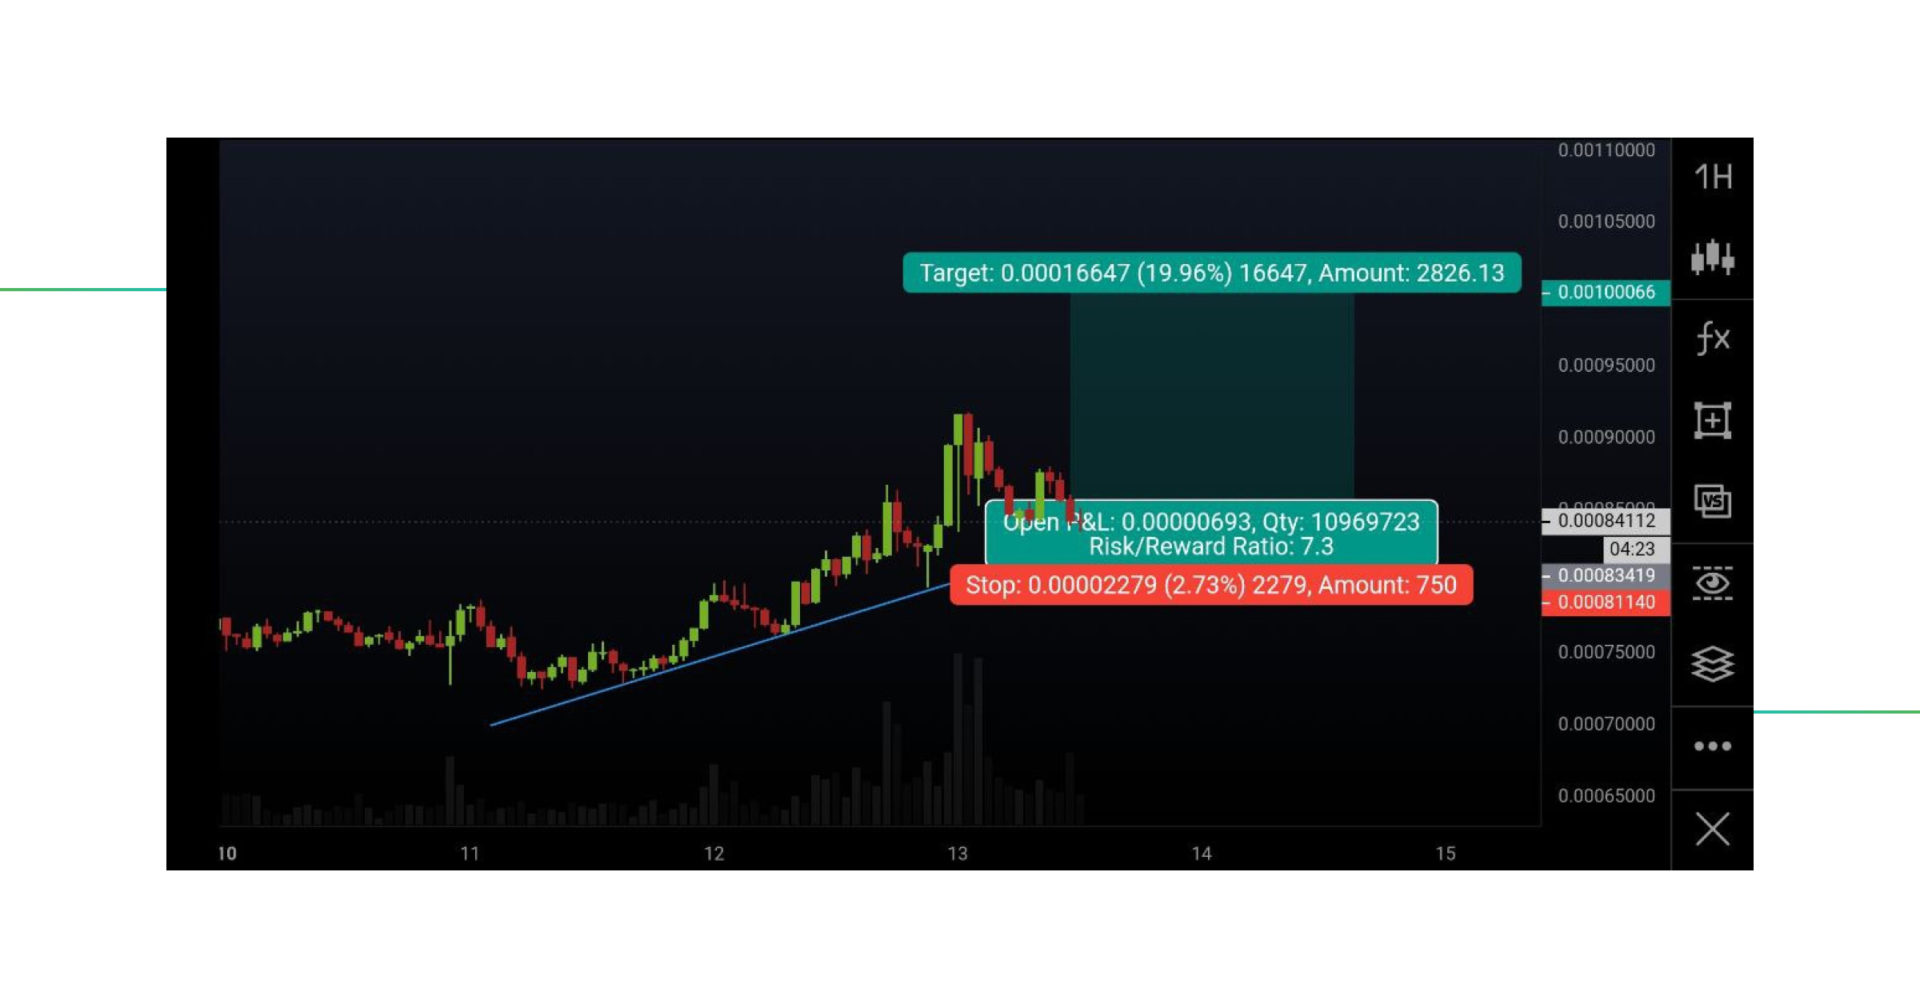
This is an example of SOL/BTC on the 1H chart. Let’s apply the t line strategy!
The trendline gives us a defined edge, which means we can place a trade knowing that the odds are in our favor. We can expect a greater chance for the trendline to be supported. If it’s not supported, our theory is not valid, and we will have a Stop Loss in place.
Remember the 1% rule: when placing a Stop Loss order it should not risk more than 1% of your total portfolio! Read our article on portfolio management to learn more.
This exact trade setup has a Risk-Reward ratio of 7.3. Not too bad! We can enter the exact values in Good Crypto, and immediately place a Stop Loss and Take Profit order along with our Limit order.
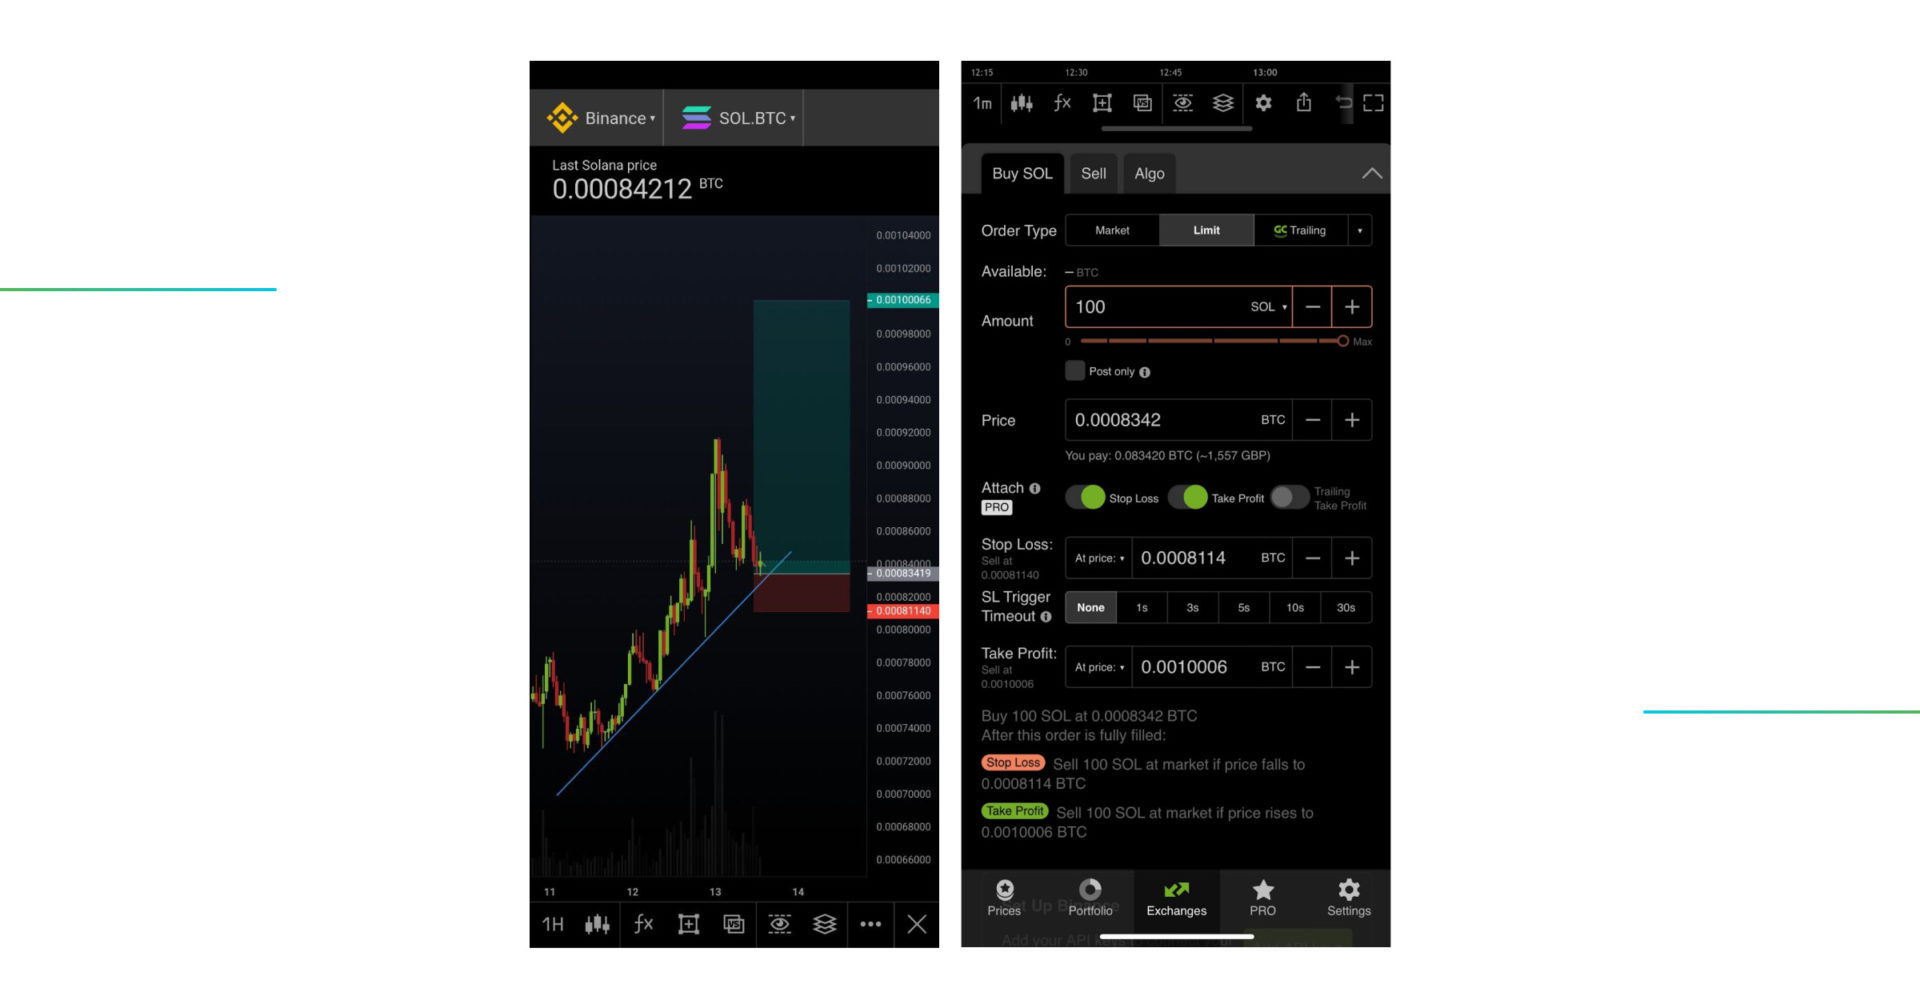
Great! Once the order is filled, you will receive a notification and the trade can run its course. Entering a trade in the app can also be done based on the exact price values, or the % values.
As you can see, placing trades with Good Crypto is as easy as it can get. Once the orders are placed, you are stress-free and can leave the screen.
Trend lines are a vital part of market movements. They are respected by many traders, which enforce its effect. When a breakout happens, strong and fast moves are providing traders with an opportunity to make profits almost instantly.
Creating an objective system like trading with trendlines helps traders to stay objective and not to follow emotions.
Good Crypto is the perfect application to discover the markets, create a trade, and generate profit.
Try out the free Good Crypto application on both the iOS App Store and the Android Play Store and discover the most advanced cryptocurrency application on the market.
Do you have questions?
Connect with our public chat room in Telegram and ask anything, 24/7.


Share this post:
April 3, 2023

We’re proud to be the first to launch a DCA bot for DEXs! Enjoy the same DCA trading experience you’re used to on CEXs but with no technical limitations.

Discover the power of MEXC with GoodCrypto! Advanced tools like bots, trailing stops, and smart TA signals and TradingView webhooks at your fingertips.

Dollar Cost Averaging (DCA) bot has become an increasingly popular trading tool due to its convenience, the versatility of its modes, and trading efficiency....

Dollar Cost Averaging (DCA) bot has become an increasingly popular trading tool due to its convenience, the versatility of its modes, and trading efficiency....