
We’re proud to be the first to launch a DCA bot for DEXs! Enjoy the same DCA trading experience you’re used to on CEXs but with no technical limitations.
July 2, 2025
When learning about technical analysis, it’s impossible to miss the Relative Strength Index indicator.
In this article, we will learn why the Relative Strength Index, or RSI, is one of the most used momentum oscillators that exists.
Momentum oscillators are a group of indicators that are used to give you an idea of how overbought or oversold a market is. They are based on the price but are scaled in such a way that they “oscillate” between a high and a low value (0 – 100).
Good Crypto allows you to use professional trading tools like the RSI indicator to create a consistent and profitable crypto trading system.
The RSI indicator is a momentum oscillator. Created by J. Welles Wilder in 1978, it has gained a lot of popularity for its effectiveness in showing if a market is overbought or oversold.
Let’s list a few characteristics that make up the RSI:
The formula for the RSI calculation is quite simple. The reason we share the calculation is not that you will need to manually calculate it. We show you the formula so you can understand the underlying mathematics and approach to the market data, however, to trade based on it you do not need to know the exact RSI calculation, you just have to understand what it indicates.
RSI = 100 – 100 / (1 + RS)
What is RS in the RSI indicator formula?
The RS is the average of absolute upward price changes divided by the average of absolute downward price changes across 14 most recent periods/candles.
This shows you that the price change is the foundation of the RSI indicator. RSI in effect measures how strong were the up movements vs the down movements in the period in question. The standard RSI period is 14 and we recommend you to keep the standard RSI settings. RSI settings for crypto are the same as for any other type of market.
The Relative Strength Indicator explained. What is RSI in crypto? And most importantly how to read RSI crypto? Reading the RSI requires some practice, and we hope that this article will guide you. Like most indicators, the RSI can give many false alarms, and it’s very important to identify the really important bullish or bearish indications. For RSI trading to be successful, you want to combine its signals with other indicators to eventually get the highest probability of being correct. Once you have learned the RSI in crypto, you can apply it to any other market.
Did you know?
The word bullish indicates that buying is stronger than selling, and the market sentiment is positive.
The word bearish indicates that selling is stronger than buying, and the market sentiment is negative.
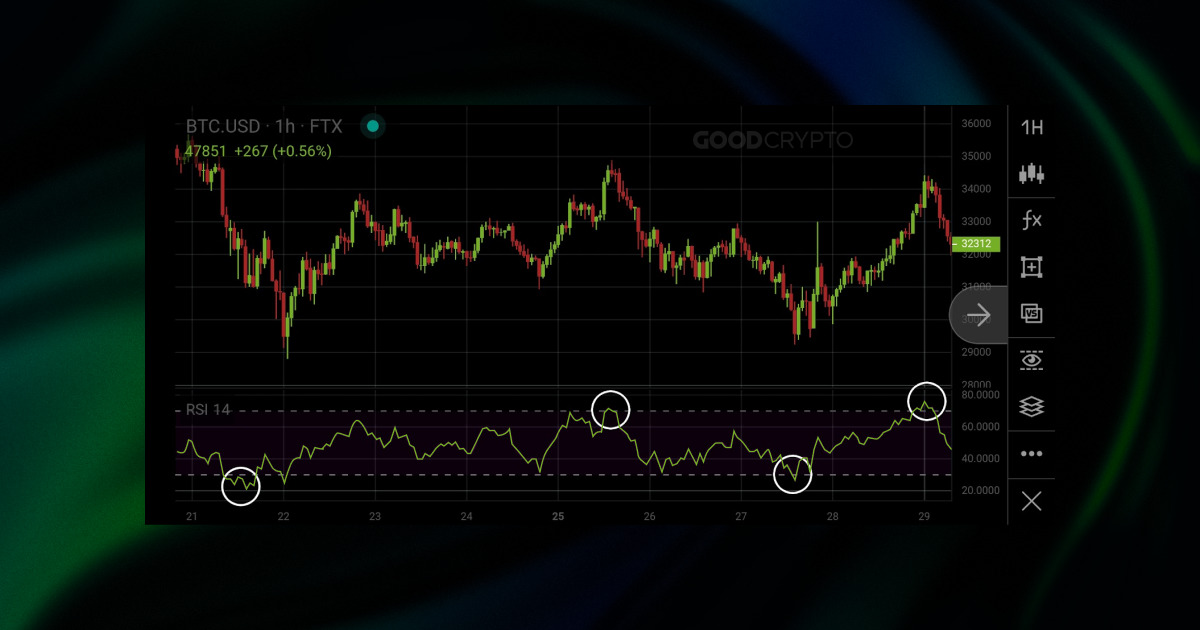
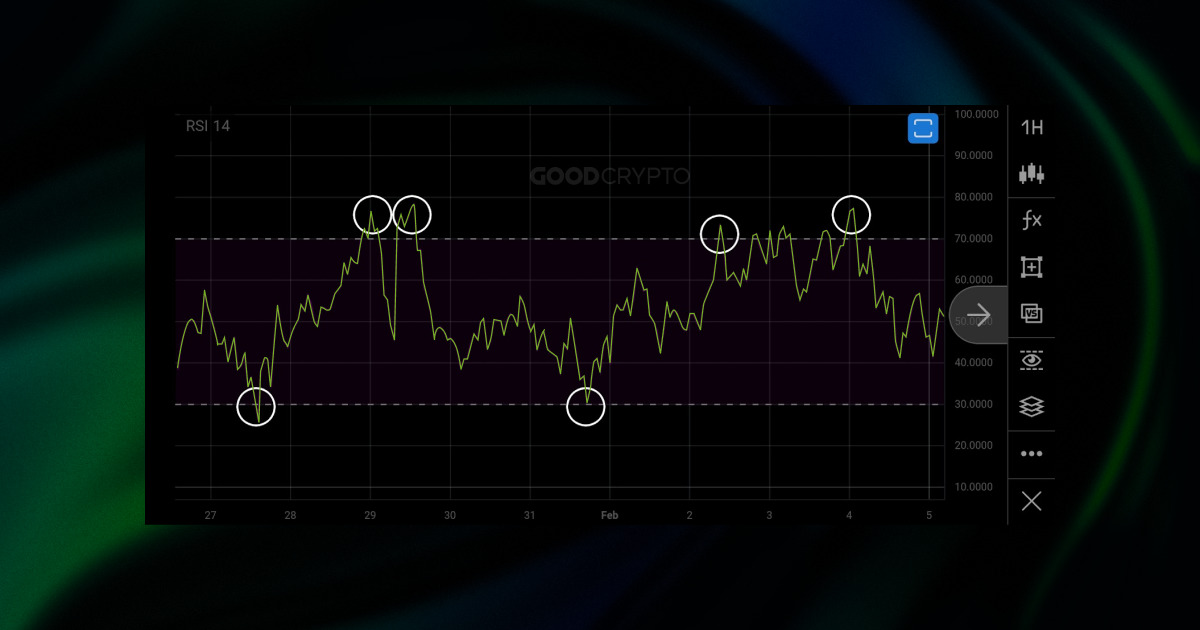
BTC/USDT 1H – the RSI indicator. The best RSI settings for 1 hour chart are the standard settings, and fit for any timeframe.
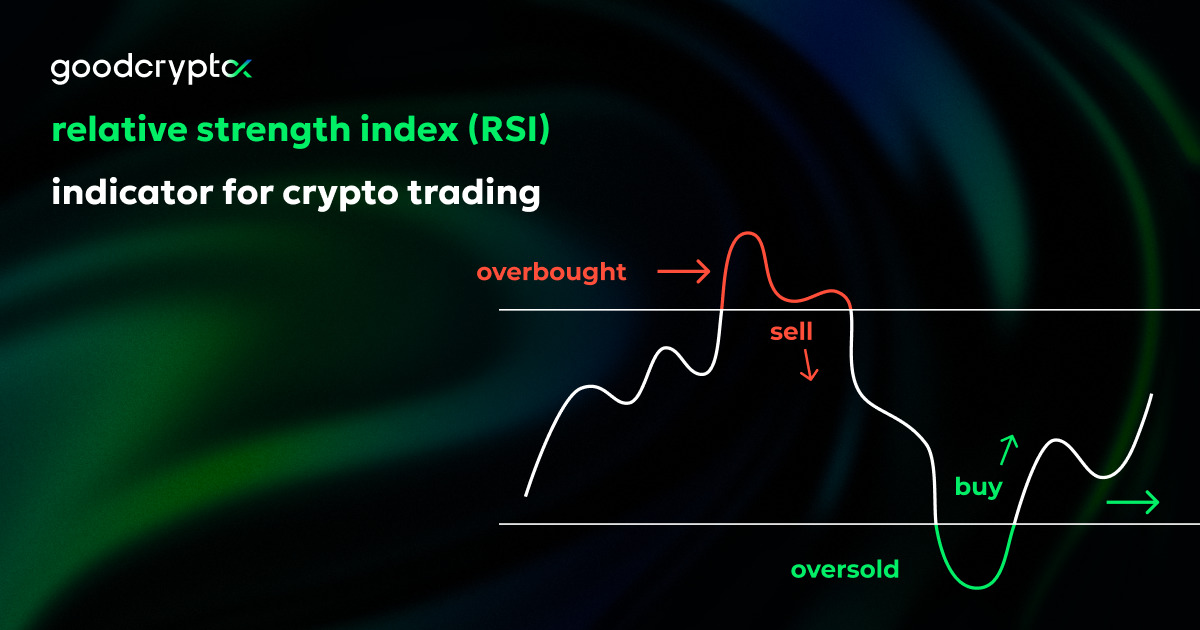
When looking at the RSI indicator, you can see a bar or a band, indicating the zone between values 30 and 70. Overbought signals are given when the indicator rises above 70 RSI level, and oversold signals are given when the indicator drops below 30 RSI level.
Simple!
Wait, but, if it’s so simple…
Ok, it’s not SO simple. Let’s dive deeper.
When a market is trending, the sentiment goes beyond indicators. What does this mean? In theory, a market can be overbought for a long time, and also it can be oversold for a long time. There is no certainty that the market has reached its peak or bottom by simply looking at the RSI indicator while trading crypto.
Mostly, signals will be more valuable when you see the price ranging. Ranging means that the price is going up and down in a certain zone, creating resistance above and support below. When price action is in a range, it is also said that the market is going sideways. There’s simply no significant moves upwards or downwards, no continuation.
When the price is trending, which means it is creating new highs or new lows, the RSI is less reliable. Why? Because, when the market is making new highs, we cannot predict with the RSI where it will stop. And likewise, when the market is making new lows, we cannot predict how low the market will eventually go.
RSI for crypto is likely the most used indicator besides moving averages, but it works on any kind of chart, including stocks.
To conclude: when a market is in a range, you can use the RSI crypto indicator to buy low and sell high.
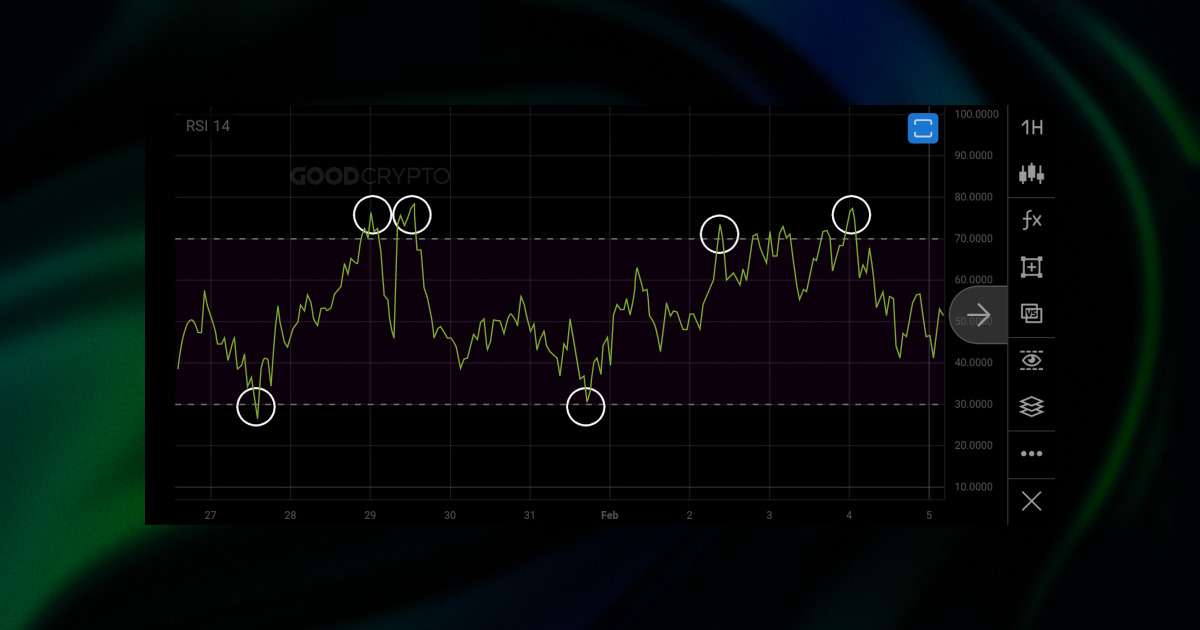
In this example, we can see the RSI aligns with the price action, giving you buy and sell signals. A typical chart where the price goes “sideways” or simply ranges. This is the perfect moment to interpret RSI overbought and oversold signals as buy and sell signals.
This is one of the most important RSI crypto signals that the RSI indicator can give you. Some traders are always on the lookout for divergences. What makes this signal so strong, and how do you see it?
Let’s have a look at the cheat-sheet we made for you.
HH = higher high
HL = higher low
LH = lower high
LL = lower low
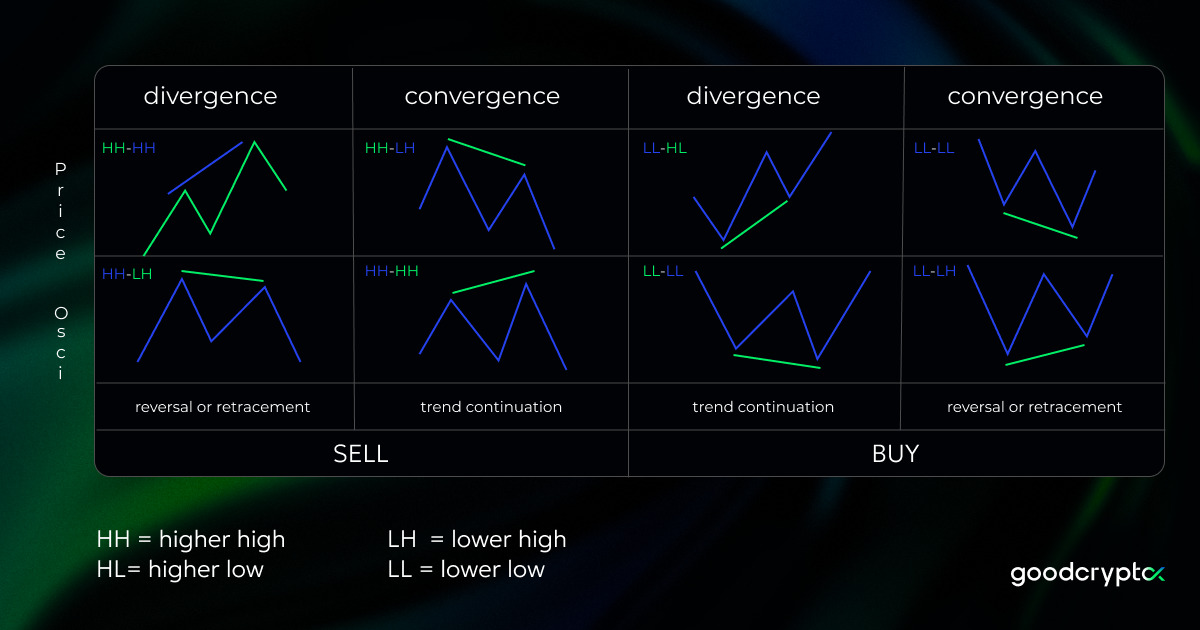
The RSI convergence and divergence definition: Convergence and divergence reflects the directional movement of the market price and the RSI oscillator. When price and RSI move in the similar direction, they are converging, and when they move in opposite directions they are diverging.
RSI Divergence is when the price makes a higher high or a higher low, and the oscillator makes a lower high or a lower low in the meantime.
RSI Convergence is when the price makes a lower high or a lower low, and the oscillator makes a higher high or a higher low in the meantime.
Imagine the market is making a peak. After a little retracement, the price makes a new high yet again, but the RSI is showing less strength, which would mean fewer people are willing to buy the asset at a higher price and so it is more likely to go down.
It might be even easier to understand it when explained in another way. Imagine on a physical market someone is selling apples, and the salesman is raising the price. But the higher the price goes, the fewer people are willing to buy. As a result, the salesman will need to lower the price of the apples to find new buyers.
Technical analysis is exactly this, looking for indications that the price will change, and you make a calculated bet on the expected change. However, it’s not an exact science, and you should know that these indications can always turn out to be false.
Ideally, you find as many indications as possible to strengthen your opinion. For example, when trading with the RSI indicator it’s most ideal to find divergence exactly when the RSI is below 30. By combining these indications, you can get more confirmation that there is a possible reversal in price.
Seeing these high and lows is the key to identify divergence or convergence. Let’s take a look at the RSI Bitcoin chart below.
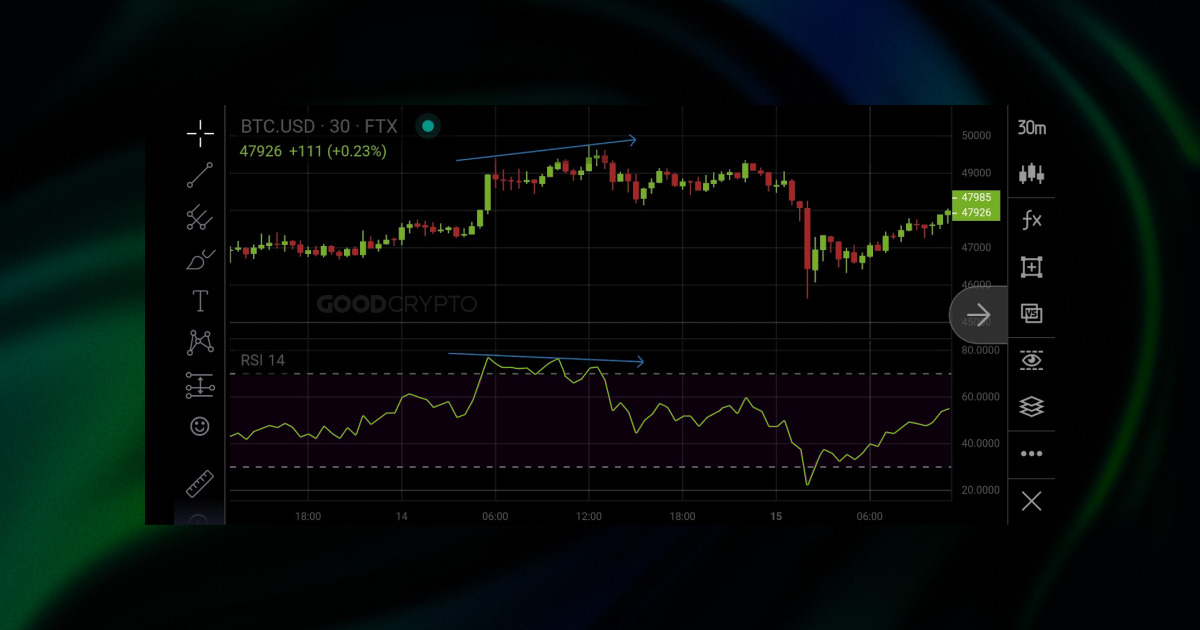
Bearish divergence, price makes HH and RSI makes LH.
An example of “bearish divergence”, when the price makes higher highs but the RSI is overbought and shows lower highs.
In the chart we can see the price making a higher high (marked by the blue arrow), while the RSI is making a lower high. Although the price traded sideways for a little longer, it eventually dumped as the buying power was too low to sustain it.
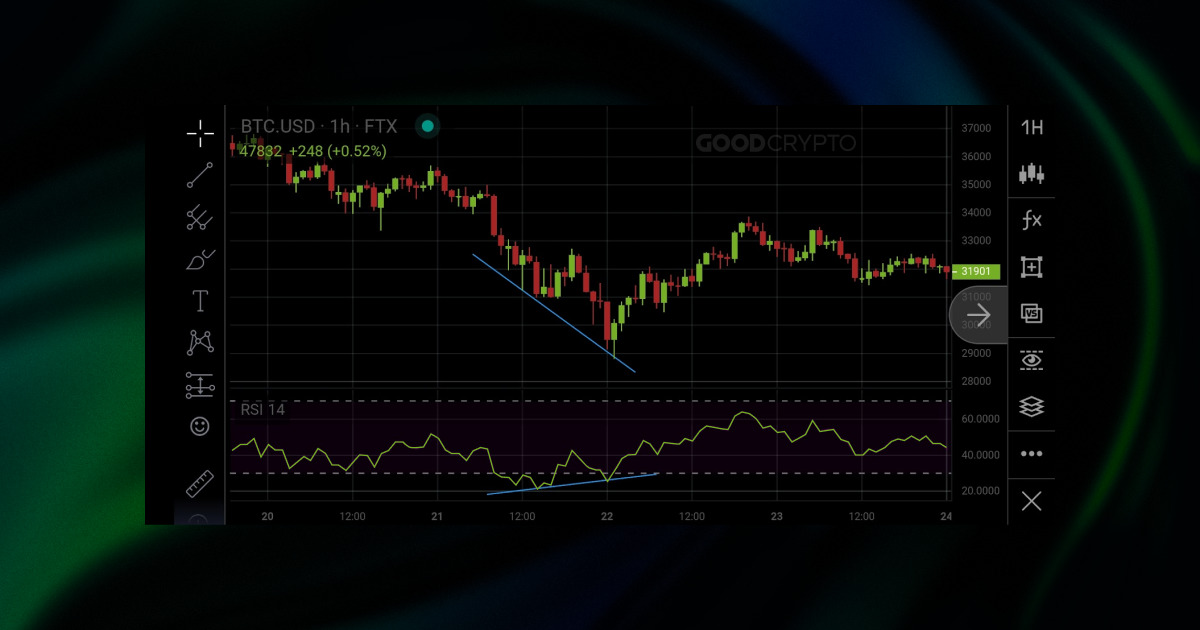
Bullish convergence, price makes LL and RSI makes HL.
An example of “bullish convergence”, because the market is showing to be oversold, and makes lower lows, yet, the RSI indicator is showing higher lows.
We can read this in another way. Although the price is going down, there seems to be a stronger buying strength as RSI is moving up. This means that the dip is likely going to be supported, and price will move up again after.
RECAP: When we see divergence or convergence in the tops (both in the price and the indicator) we are seeing sell signals. When seeing divergence or convergence appear in the bottoms (both in the price and the indicator) we are seeing buy signals.
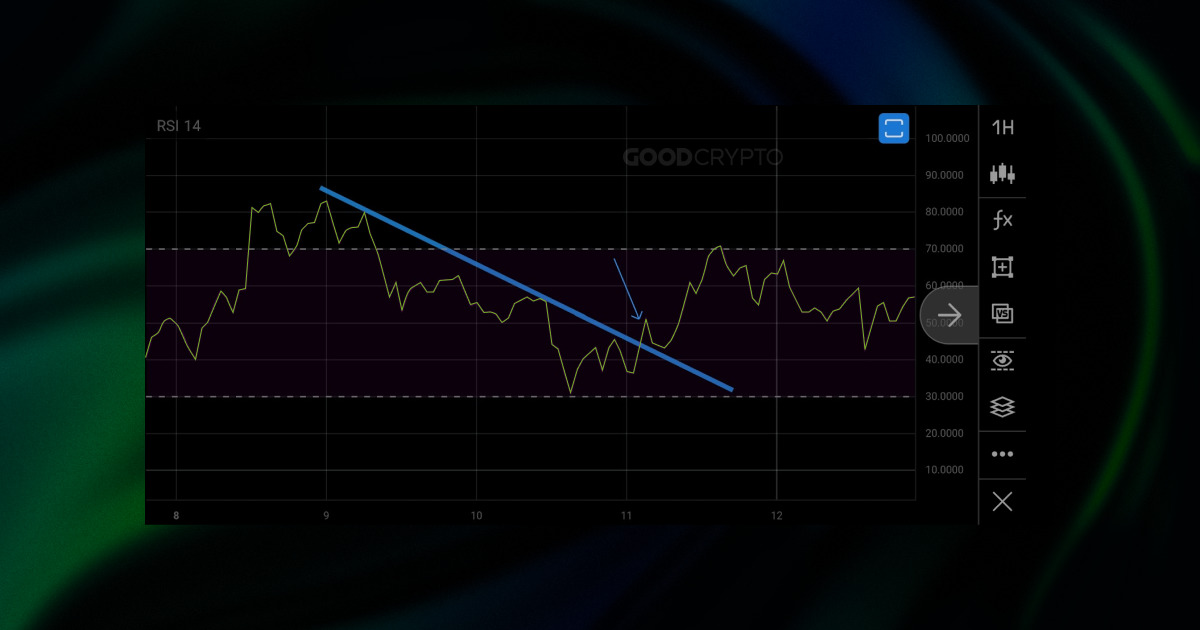
The RSI indicator can be used to analyze a trend and thus you can create trendlines. A trendline is a straight line that is touched 2 times or more. More touches mean the trendline is stronger. When the RSI breaks a certain trendline, we call it an RSI indicator breakout. The example below shows how the RSI broke out of a downtrend, retested the trendline, and then made an upwards continuation.
Inside the Good Crypto application, navigate to the trading terminal. Choose the exchange and trading pair you want to trade, then tap the “fx” icon below the chart to add RSI indicator.
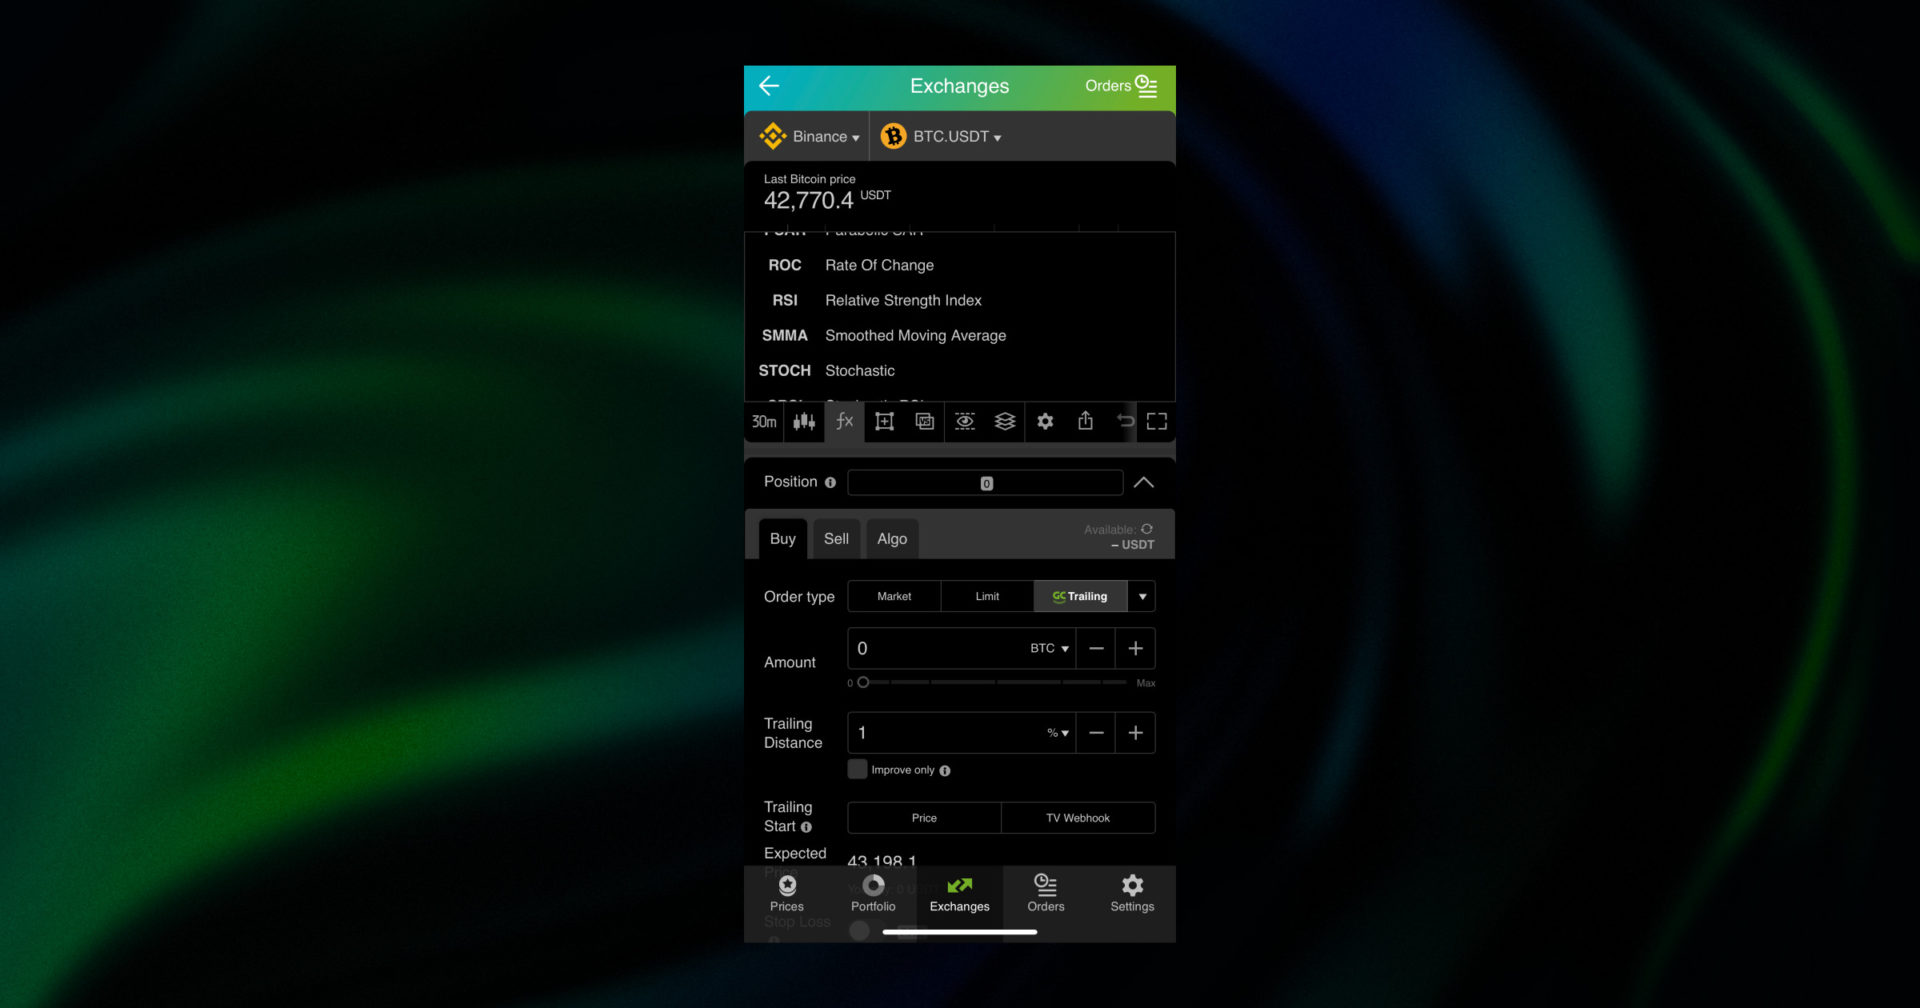
Once you enable the Relative Strength Index indicator, you can start looking for signals.
Don’t forget that the RSI period is always 14, since it’s a standard, we recommend you to keep it at those RSI settings.
Signals given on a higher timeframe will be stronger than signals given on the lower timeframes. This is very important because once you start using the crypto RSI indicator, you will notice that you could for example see a bearish divergence on the 15-minute timeframe, but not on the 1-hour timeframe.
Or another example, if you see a bearish divergence on the daily timeframe, it will be significantly more meaningful than bearish divergence on the 5-minute timeframe.
Now, let’s take a look at two RSI strategies that will help us better understand how to make a trading decision based on this crypto indicator.
One method, as described on the crypto RSI chart above, is looking at overbought and oversold signals when the market is in a range. There’s no guarantee that you will catch the absolute bottom nor the absolute top. It is dangerous to simply buy based on an oversold signal since as we described, a market can keep falling even when the oversold signal was already given. Using the RSI alone is not enough, and therefore it’s not recommended to create a trading strategy based on this indicator alone. However, it helps you make decisions and gain insight, which is very useful. You can use different types of Moving Averages and Bollinger Bands together with RSI to confirm signals appeared and make a more informed trading decision.
The second method, trading based on divergence, can be more interesting. When you are noticing a re-test for example in a bottom or a top formation in price, you can look for divergence in the RSI momentum indicator. When a double top shows bearish divergence, it’s a potential indication to sell. When a double bottom shows you a bullish divergence pattern, you potentially could place a buy order. Your stop loss can then be placed below the previous low since your analysis is based on the fact that there will be no new low. If there is a new low, then the analysis is proven to be wrong and your stop loss will be hit.
Having your Stop Loss hit should not be a big issue. Risk management is a vital part of trading. Essentially, you allow yourself and your strategy to be wrong now and then. A market is an unpredictable place, so you need to allow yourself the possibility to accept any outcome and still win over the long term. That’s why your Stop Loss should not cost you more than 1% or 2% of your trading portfolio. Ideally, you test and retest a strategy without using your money. Once, let’s say, RSI trading strategies are profitable on paper, you can use your money and win consistently.
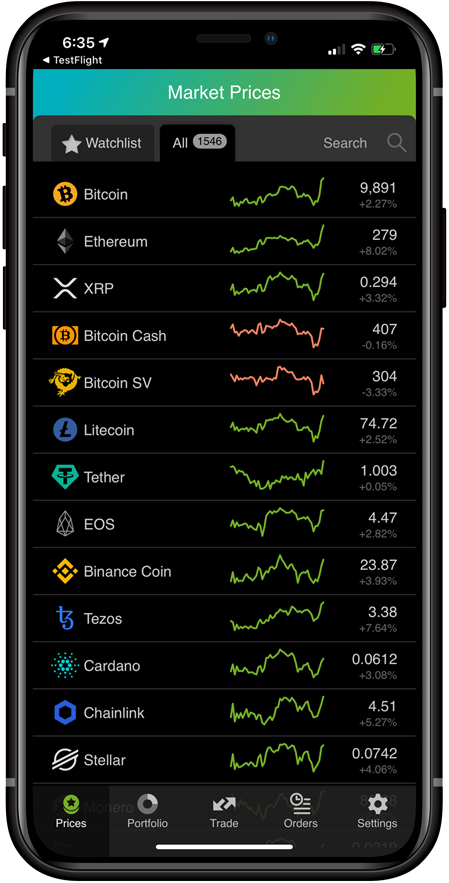
Good Crypto, the perfect trading terminal for exploring new crypto coins, is dedicated to providing you with all the tools you need to be profitable and successful in trading crypto. The application combines all your exchange accounts into one place and allows you to trade anywhere you go. Your trades and transactions are combined into a beautiful portfolio overview, allowing you to track your performance over time.
Over 20,000 markets on 30 exchanges can be discovered inside the app. Organizing these markets by performance will make it possible for you to find the most promising coins and tokens, and trade them.
When you don’t have the time to scan the markets for opportunities, you can simply place price alerts and wait for the perfect moment to trade. The Good Crypto team has even provided you with new exchange listing alerts, and a daily market update.
Once trading, you can create orders that go way beyond the possibilities of an exchange. The architecture of the application allows you to create an unlimited amount of conditional orders without freezing your balance. When placing an order, you can then attach a Stop Loss and a Take Profit order all at once. And even better, a Trailing Stop order can provide you a lot more profits, by following the trend for as long as possible. What is more, Good Crypto is adding trading algorithms to the app from Grid and DCA to Infinity Trailing and much more – all accessible from the palm of your hand with real-time on-chart visualizations of every move your trading bot would make, giving you complete control.
Find Good Crypto on both the iOS App Store and the Android Play Store and discover the most advanced crypto trading terminal on the market!
Do you have questions?
Connect with the public chat room in Telegram and ask anything, 24/7.


Share this post:
January 2, 2023

We’re proud to be the first to launch a DCA bot for DEXs! Enjoy the same DCA trading experience you’re used to on CEXs but with no technical limitations.

Discover the power of MEXC with GoodCrypto! Advanced tools like bots, trailing stops, and smart TA signals and TradingView webhooks at your fingertips.

Dollar Cost Averaging (DCA) bot has become an increasingly popular trading tool due to its convenience, the versatility of its modes, and trading efficiency....

Dollar Cost Averaging (DCA) bot has become an increasingly popular trading tool due to its convenience, the versatility of its modes, and trading efficiency....