
Intro
How many times have you experienced the frustration of being stopped out in a volatile market, only to witness the market abruptly reverse in the very direction you had initially anticipated? Getting stopped out is an inevitable part of trading, but nothing stings more than being whipsawed by random market noise, leading to missed opportunities and dashed expectations.
What if there was a way to know exactly where to set your Stop Loss? To have an indicator
that tells you the exact position where to place it, significantly reducing the chances of it ever getting hit. Well, the good news is that such an indicator exists, and it is called Average True Range, or ATR for short.
If you don’t know anything about the indicator, don’t worry, you are not alone. In this article, we will highlight what is ATR indicator and why it is so special. Step-by-step, we will guide you through what does ATR mean, how to read it, and what traders use it for.
Without delay, let’s get into it!
Understanding ATR: Meaning And Purpose
Key takeaways:
- ATR is a technical analysis indicator that provides information about market volatility.
- ATR can help traders predict how far the price of an asset might move in the future. This can be helpful when deciding where to set Stop Loss and Take Profit targets.
- Using ATR for SL/TP placement allows you to avoid any market noise.
- ATR indicator can be used to form an exit strategy by placing Trailing Stop Losses.
ATR (Average True Range) is a commonly used technical analysis indicator, the main purpose of which is to determine the volatility of the market in terms of pips or movements in price. Originally developed by a market technician J. Welles Wilder Jr. in the 1970s, ATR was utilized to measure the average volatility of an asset over a given time period.
Even though the infamous indicator doesn’t provide any buy/sell signals, it does tell whether the asset is trending or consolidating, and, most importantly, it assists traders in placing stop losses. At the core of the trading ATR indicator lies its primary role – to showcase the level of volatility in the market for the past N periods.
The Average True Range (ATR) is everyone’s go-to technical analysis tool as it illustrates the extent of an asset’s price fluctuations. This information gives traders insights into the usual price range of an asset, which can be effectively utilized in establishing optimal levels for their Stop Loss/Take Profit orders, reducing their exposure to risk.
By default, ATR trading indicator shows the average of the last 14 periods on a specific currency pair and time frame. The calculations of the indicators heavily rely on the True Range – a concept that deserves to be explored separately.
True Range
If you want to calculate Average True Range, you need to find out a True Range (TR) first.
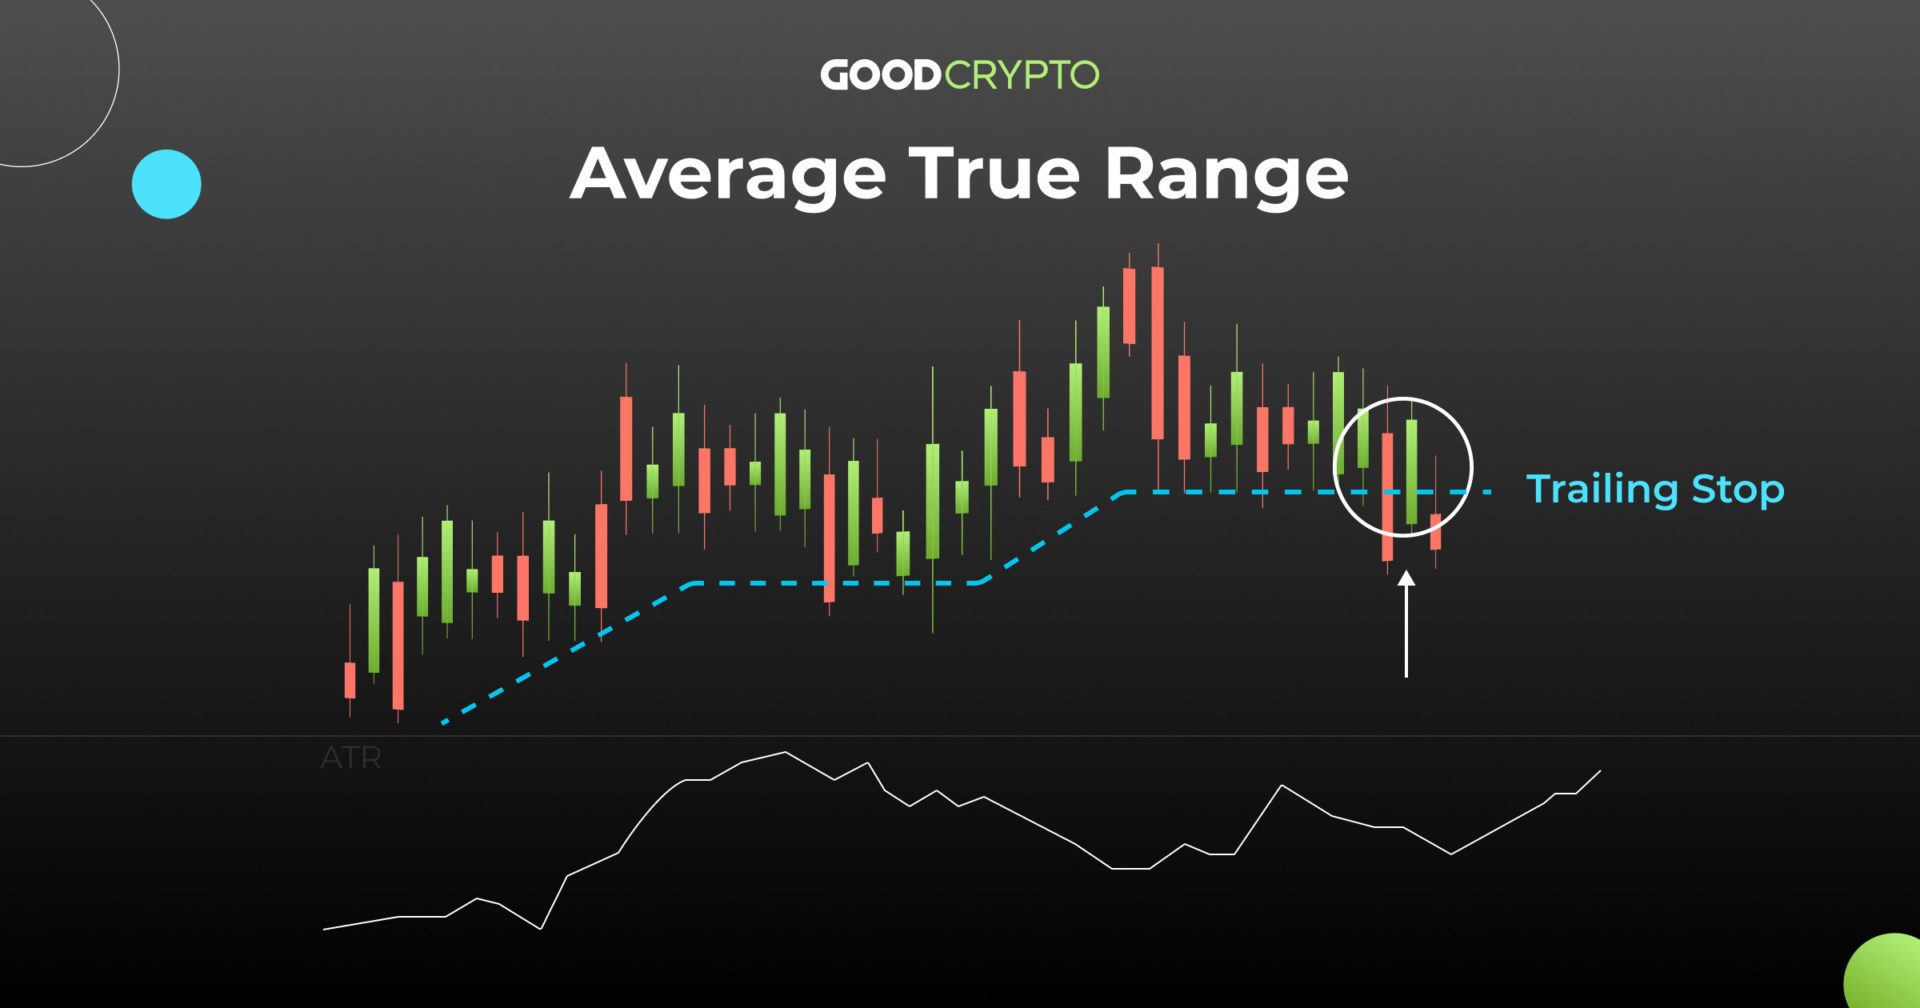
While developing ATR, J. Welles Wilder Jr. realized that measuring volatility using only price closes won’t bring accurate results. The need for a more complex system arose, which led to the creation of three different ATR calculation scenarios:
- Current High – Current Low
- Current High – Previous Close (absolute value)
- Current Low – Previous Close (absolute value)
Applying absolute values to the second and third calculation methods ensures we get positive values, which is important for the comparison (the greatest value out of the 3 calculated ones will make it to the Average True Range formula).
Thanks to the new methodology, previous limits regarding the True Range were expanded. Wilder ensured the metric captures an asset’s true volatility regardless of its direction.
If you are determined to explore the world of technical analysis, comprehending the concept of the True Range will definitely pay off in the future. Besides ATR, the True Range appears frequently in more complicated indicators, not just as a notion but also as a fundamental calculation. So, learning about the topic one thing or two wouldn’t hurt.
Now let’s proceed to the actual ATR calculation.
ATR Formula & Calculation
The ATR averages out these TRs over a preset period of proceeding time periods. The typical setting for the indicator is a 14-period look back. Other commonly used ATR periods are 20 and 22 days/weeks/months. The formula for the Average True Range calculation is following:
Current ATR = ((Previous ATR x 13) + Current TR) / 14
You might be asking yourself: “How to calculate Average True Range if every time I’m trying to find the value of the indicator, the previous ATR is involved?” Since you don’t have a previous ATR, you need to use the next ATR formula:
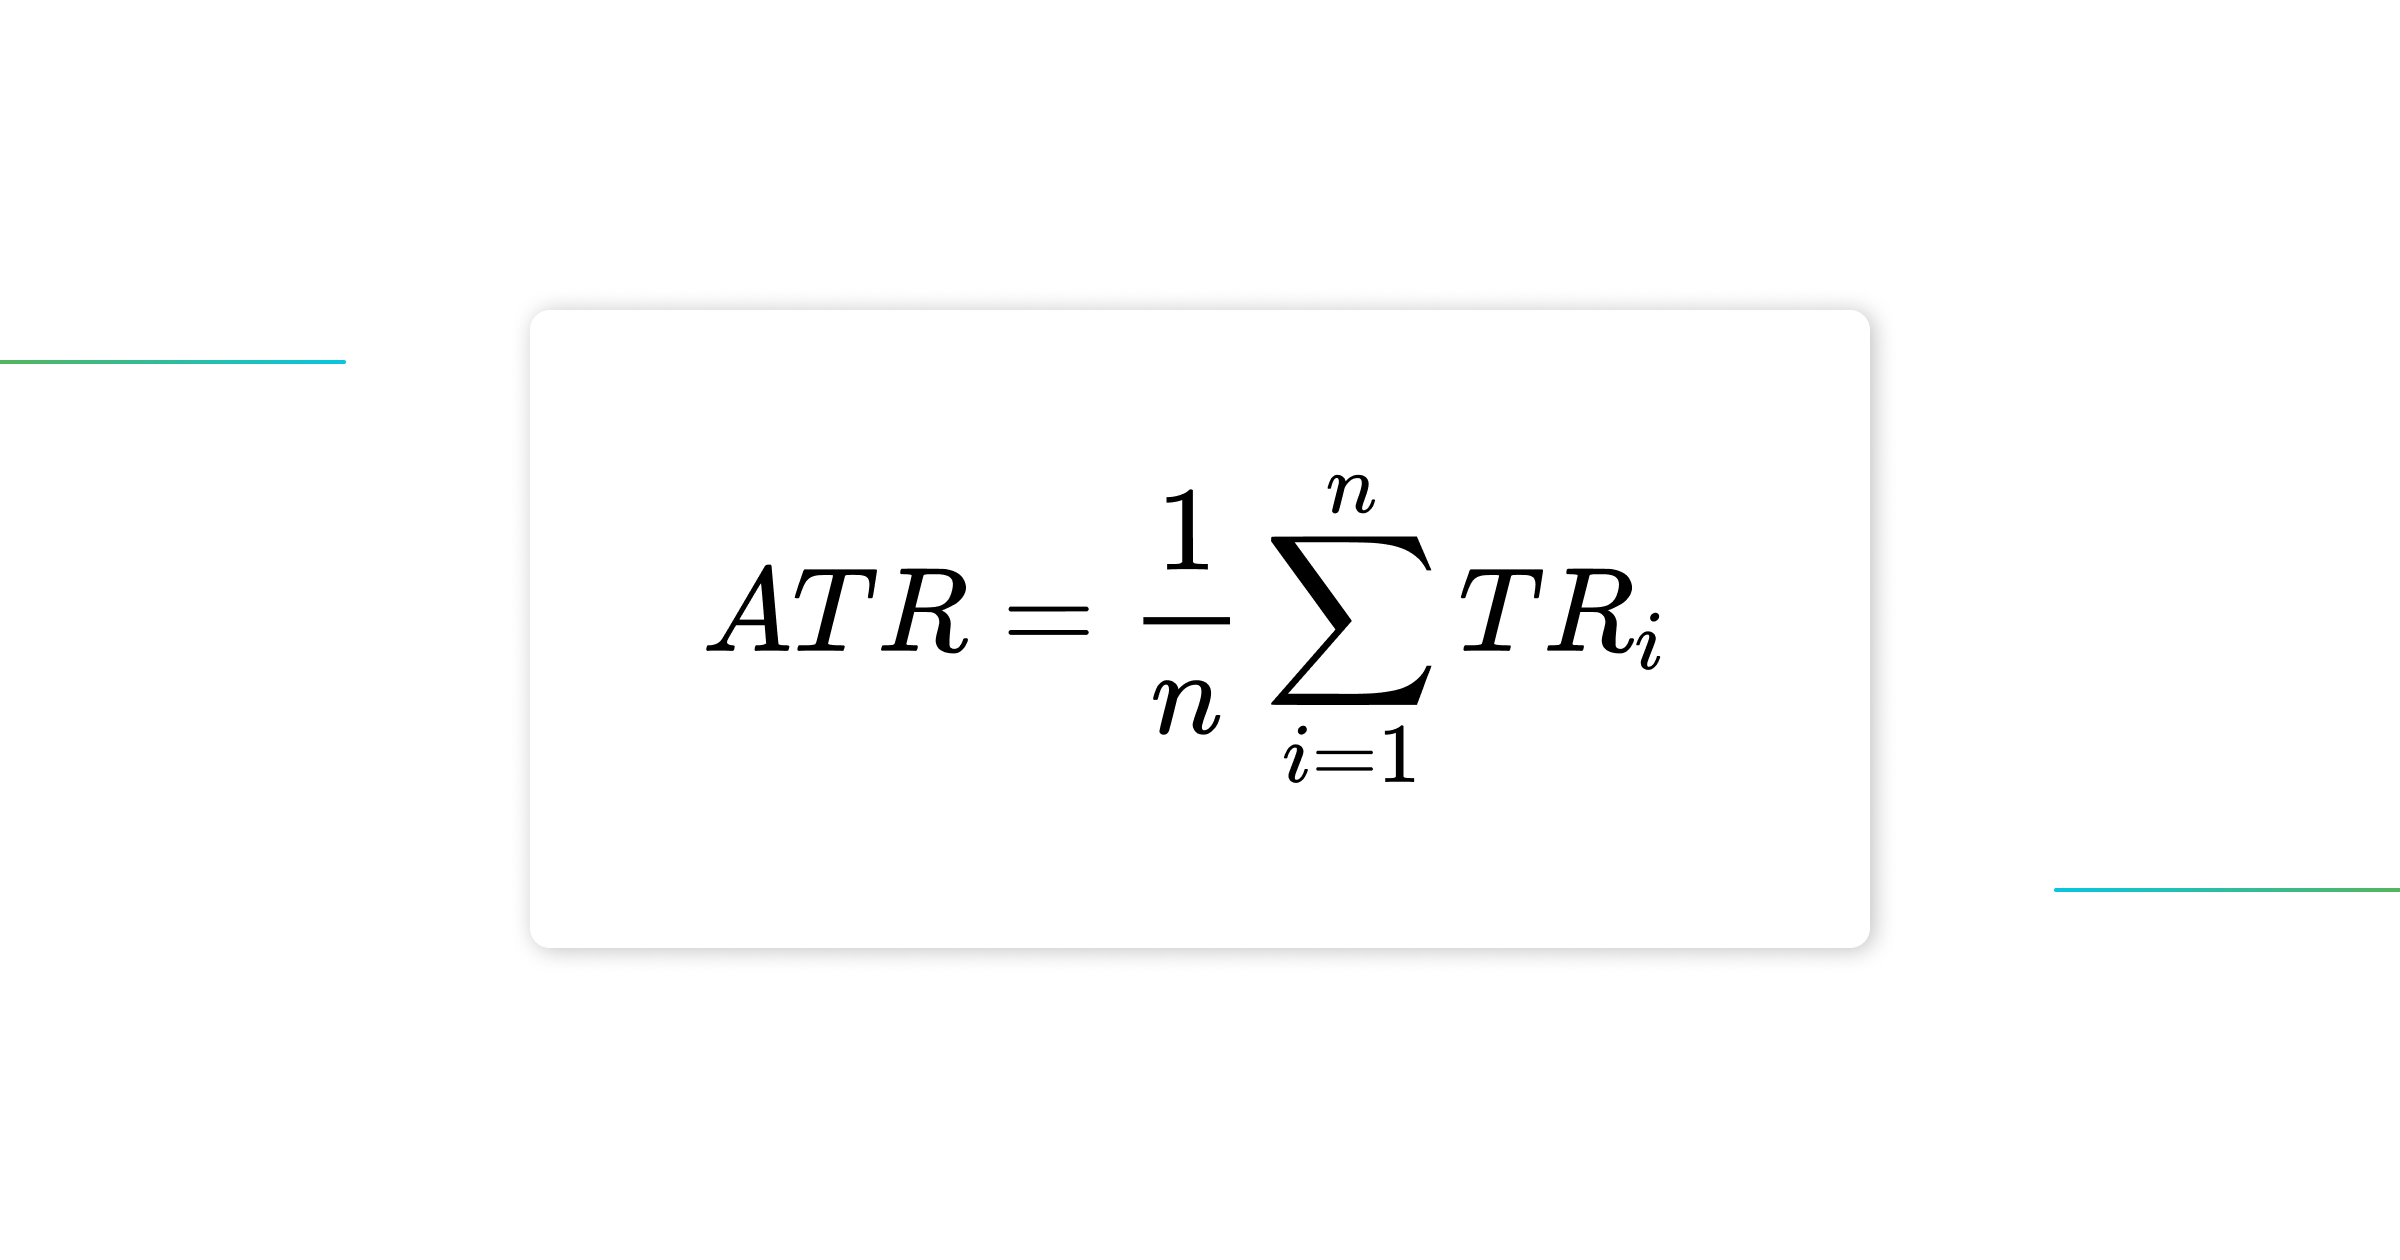
Depending on the period setting of your ATR indicator, you’ll have to calculate ATR for each day/week/month, sum up all the values, and multiply the outcome by 1/n (where “n” is a number of periods).
Once you’ve identified the previous ATR, calculating the current value of the indicator will be much easier since you don’t have to measure the TR for all time periods, but only for one.
How to Read ATR Indicator?
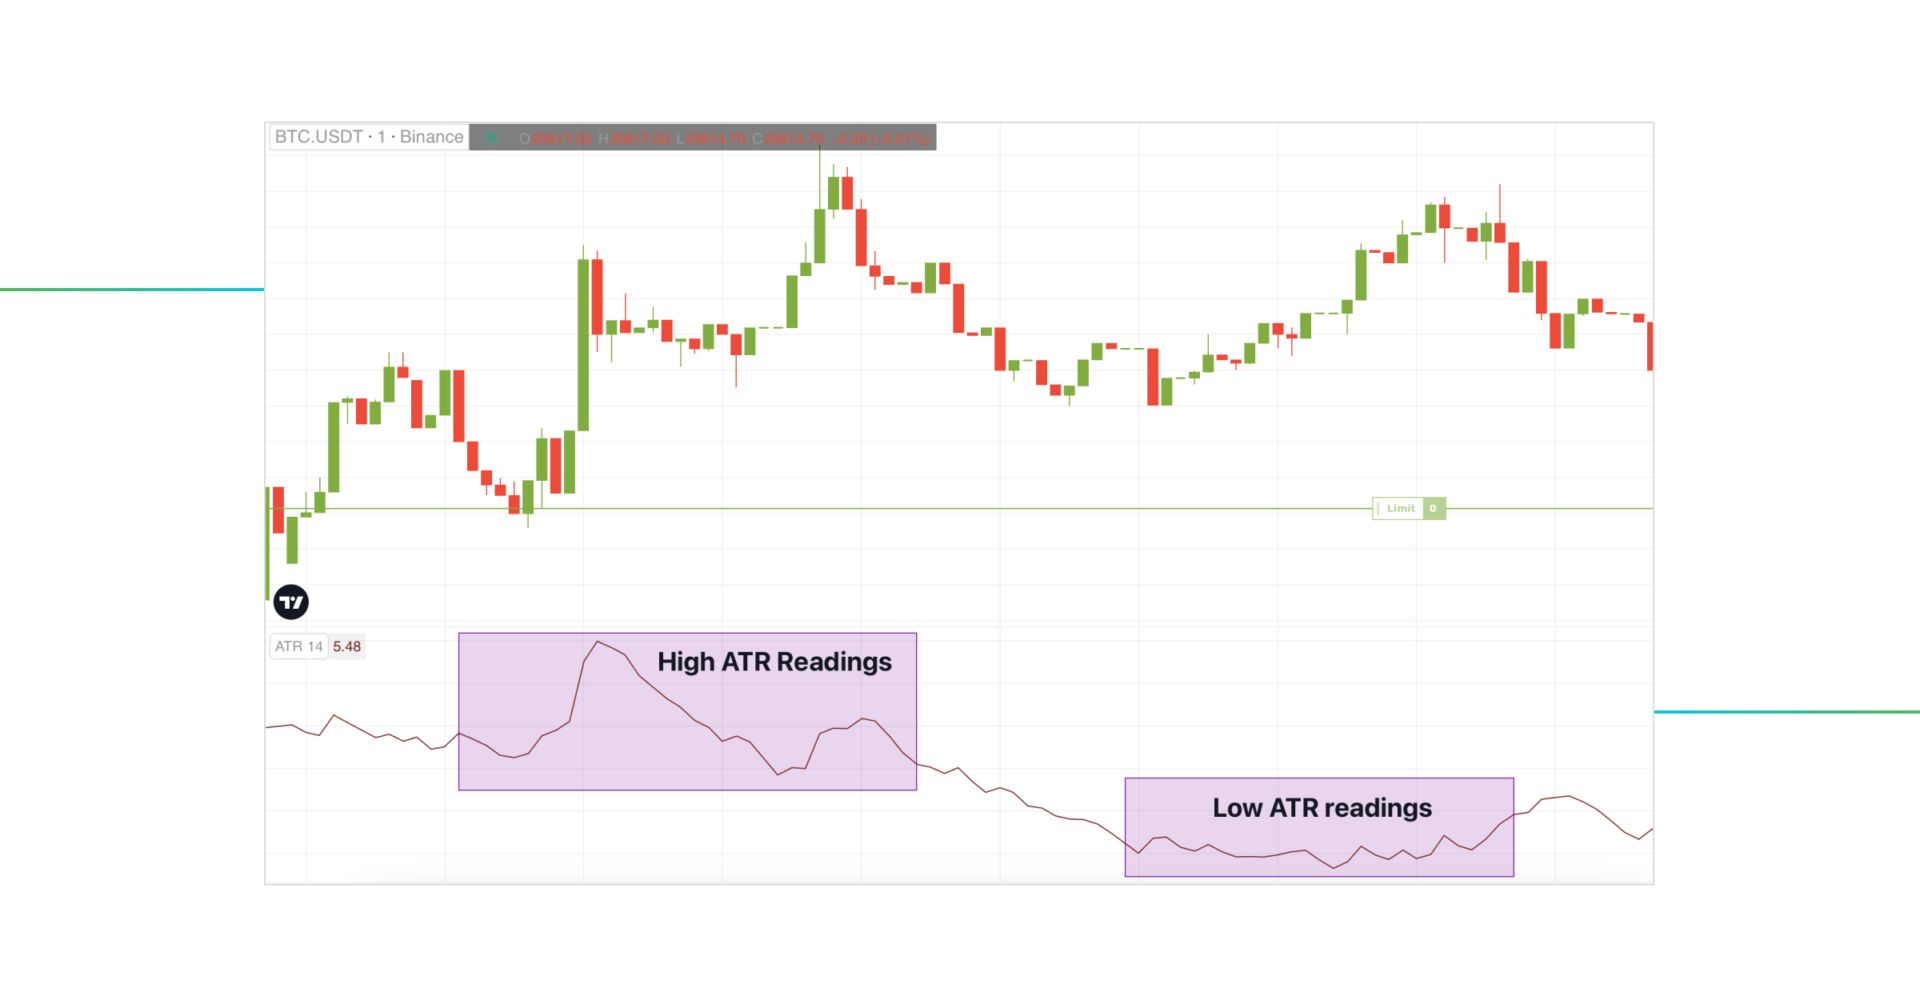
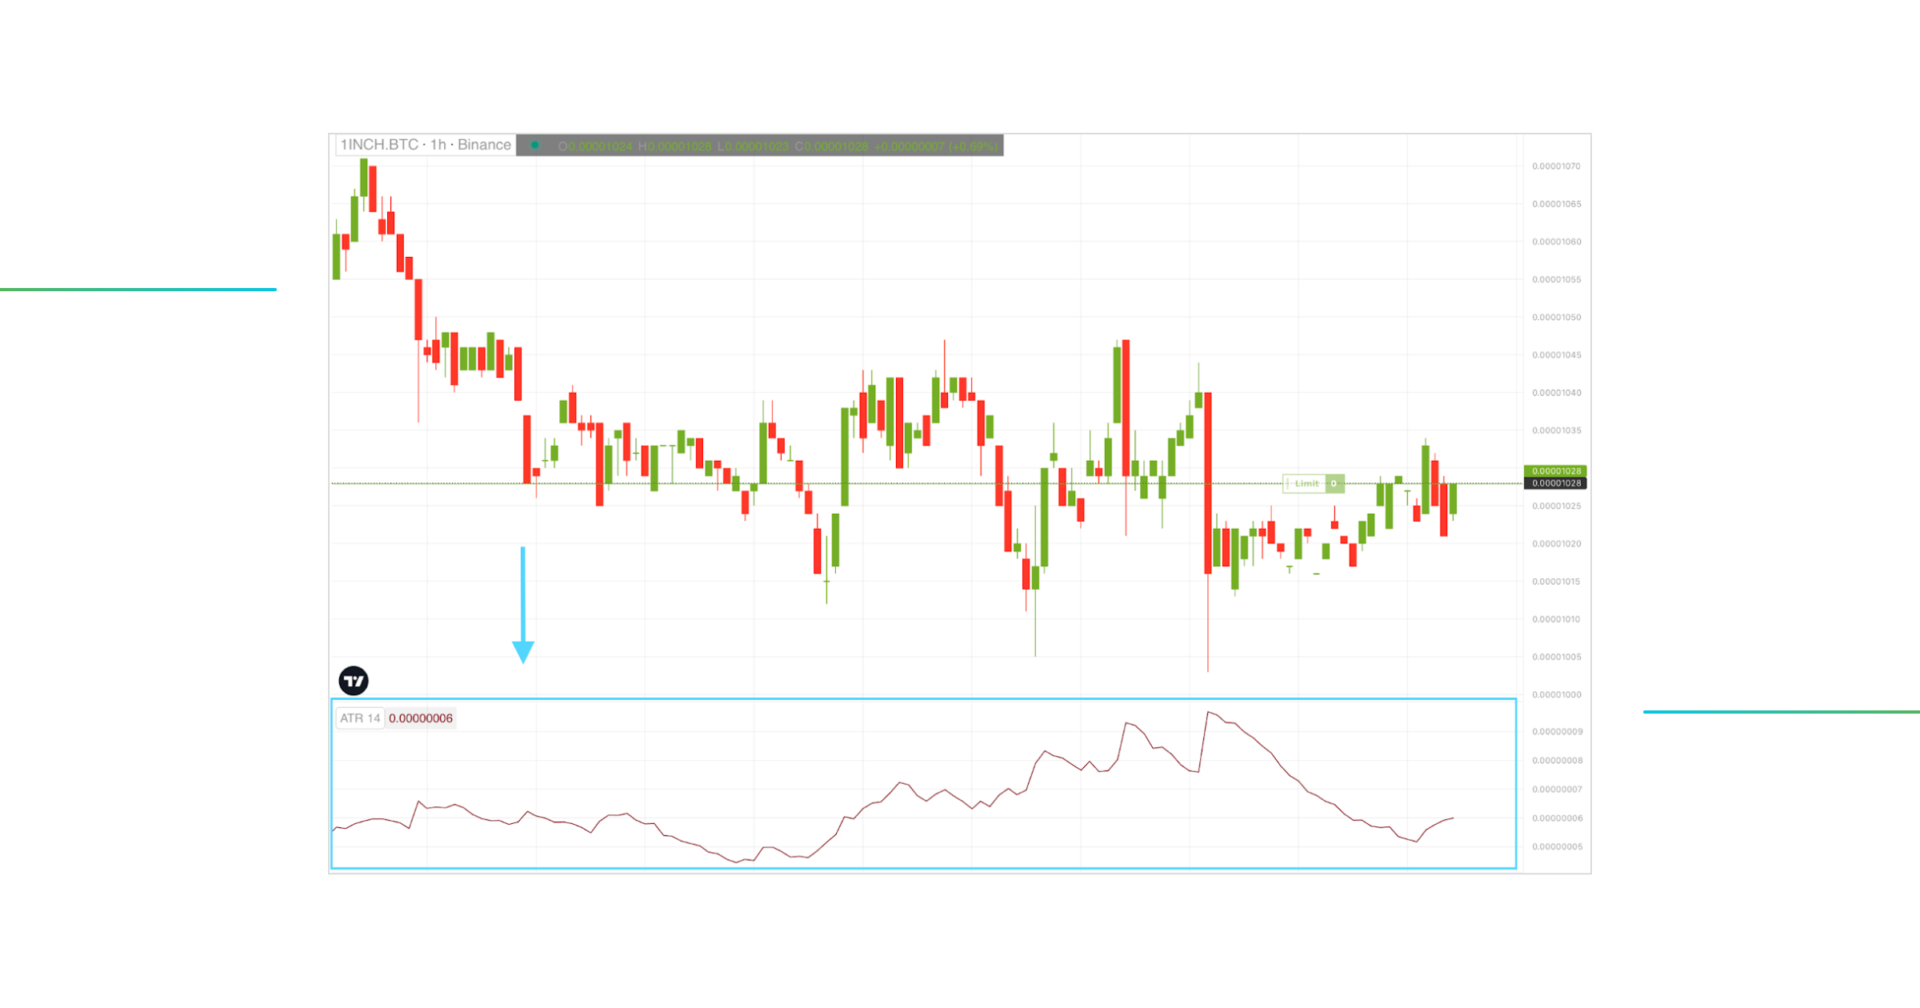
On the chart above, the ATR is displayed as a line graph with the line oscillating up and down. Because the Average True Range showcases the degree of price volatility, traders use it for predicting long-term and short-term market trends.
Here are 2 ways the ATR reading can be interpreted:
- Low ATR readings correspond with smaller price swings in the same area of the chart and can be a sign of a consolidating market. A situation when the indicator falls or remains flat means a lack of price action in either direction – the market basically sits in a tight range.
- The increase of ATR on the chart corresponds with the increased magnitude of price movements in the exact same area. A rising ATR could indicate a strong trend in the market. You can’t tell the direction of the trend unless you look at the ATR in conjunction with price action.
A higher ATR value suggests greater volatility, indicating larger potential price swings and the need for wider stop loss and take profit levels. Conversely, a lower ATR value indicates lower volatility and may lead to tighter stop loss and take profit levels.
Now it’s also important to note that the value in the top left corner of ATR settings will change based on where your cursor is. So if you have your cursor in the middle of the chart, it bases its calculations on the past 14 periods to the left of that bar. Make sure your cursor is all the way to the right of the price or off the chart completely when reading the ATR.
How to Use ATR Indicator?
Average True Range is a fundamental indicator that has been utilized in technical analysis for half of a decade now. As far as we know, it is included in most of the trading platforms’ toolsets, which only highlights its effectiveness and broad adoption among traders from different markets.
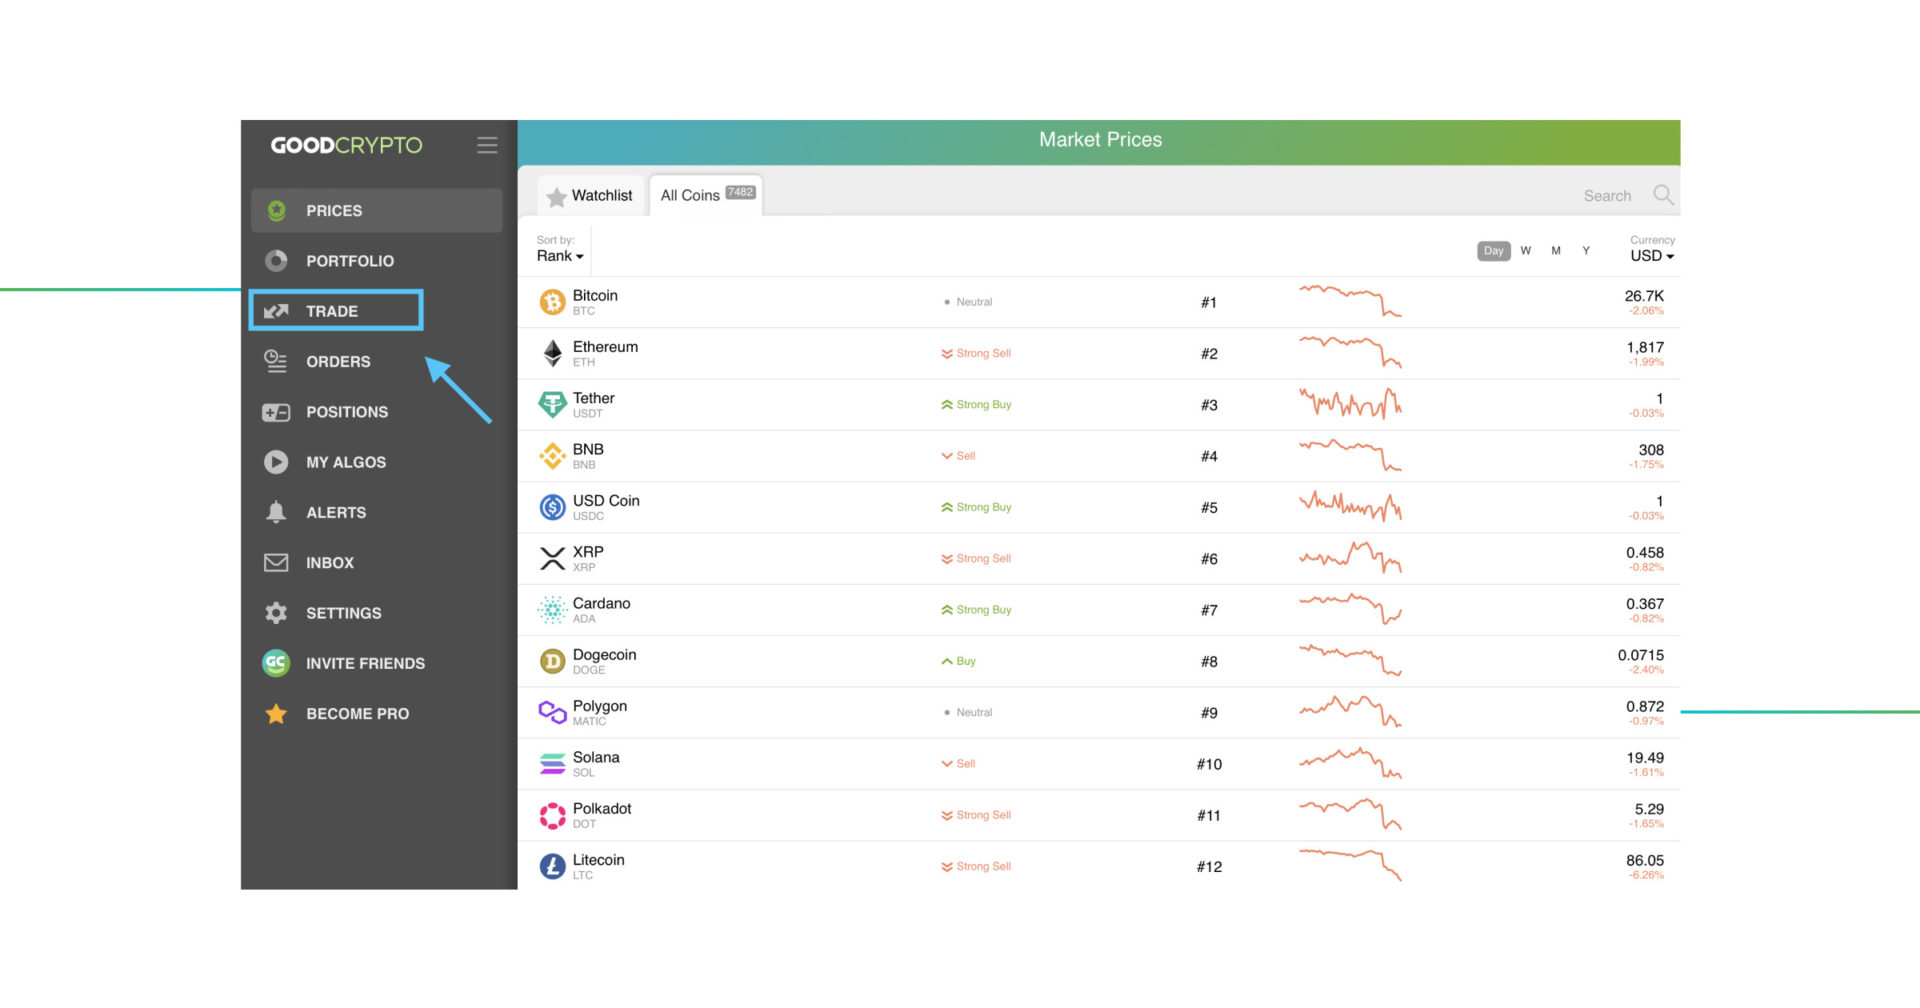
Here is a brief step-by-step guide on how to use Average True Range on one of the best crypto portfolio management tools – GoodCrypto.
Step 1: Click “Trade” on the left sidebar to open the trading chart (if you are using the GoodCrypto app, click “Exchange” at the bottom of the screen).
Step 2: To access the comprehensive list of all available indicators, find and click the “fx” button.
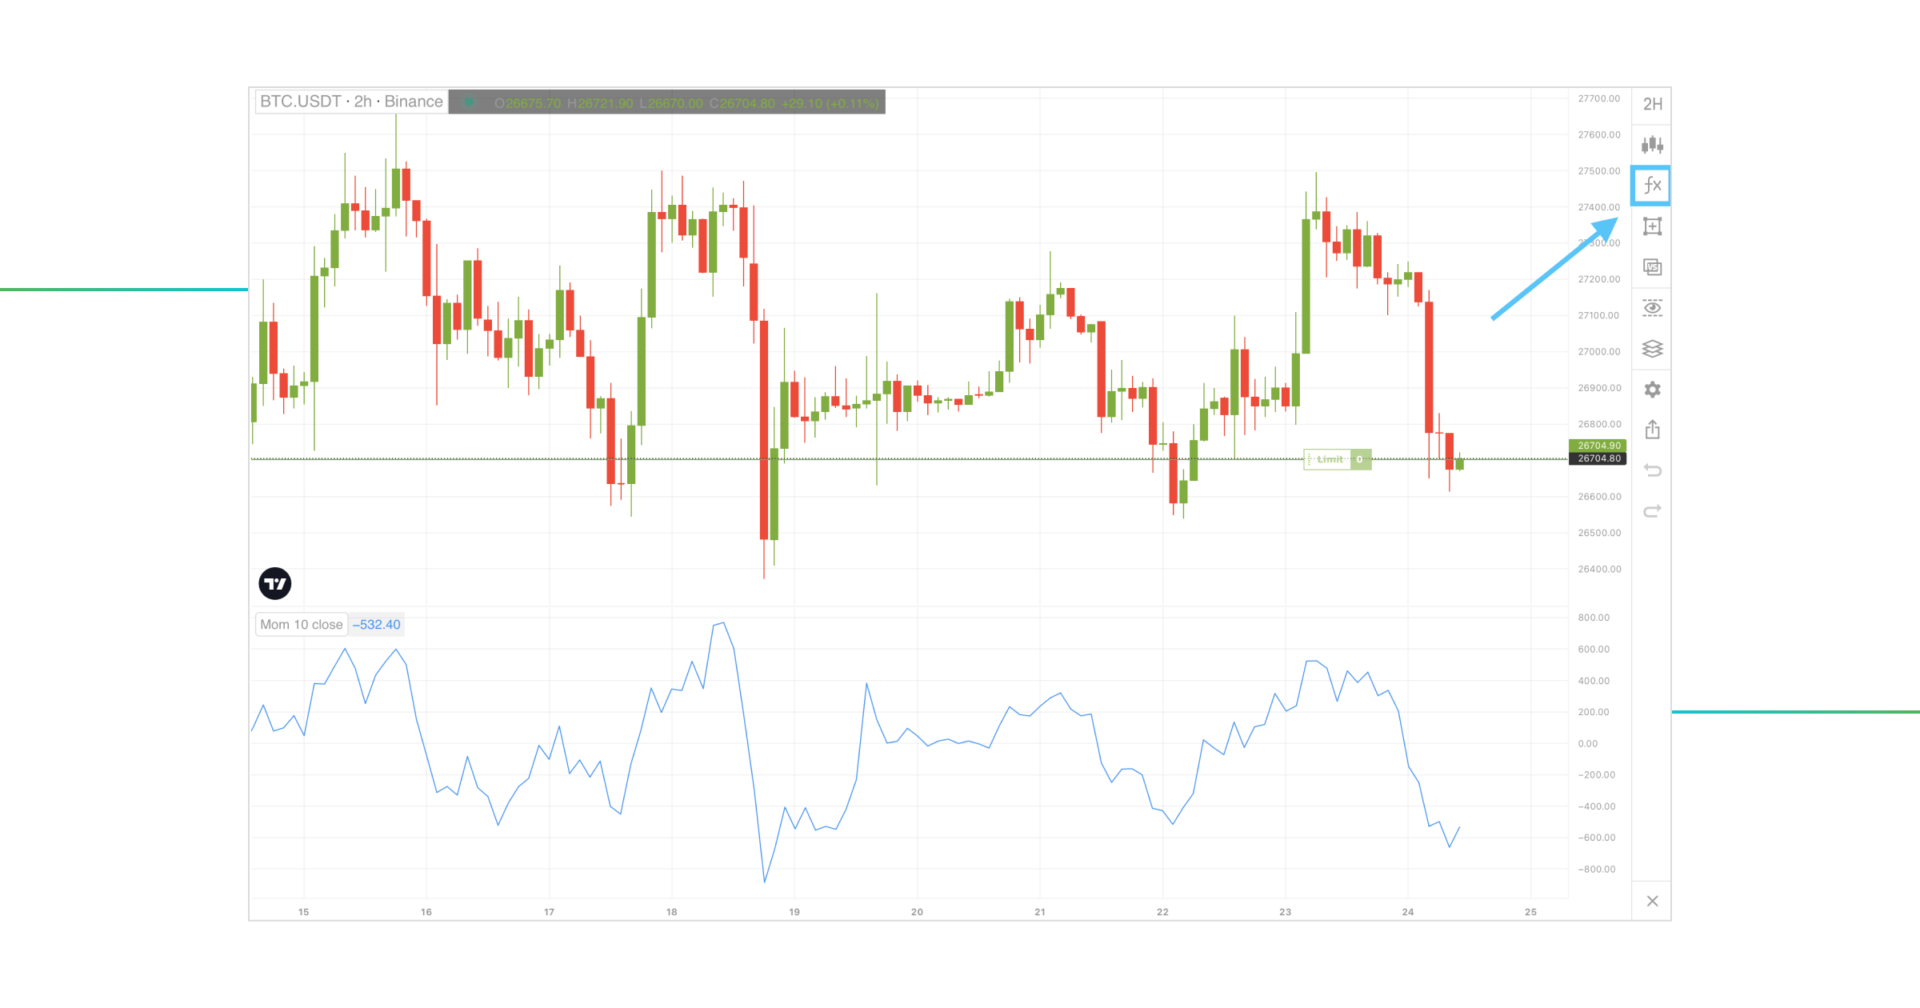
Step 3: Click on the indicator to be displayed on your trading chart.
As simple as that! Once you’ve attached the ATR to your chart, it is high time you configured its settings to match your trading preference and goals.
Just like with other technical indicators, we always emphasize the importance of relying on other indicators and patterns alongside the Average True Range. Parabolic SAR, Moving Averages, Bollinger Bands and support/resistance levels are only a few tools that work well in conjunction with the ATR. Combining two and more technical indicators on one chart not only can help you get a better understanding of price volatility, it can also confirm SL and TP levels.
The Best Settings For an Average True Range Indicator
You can modify the settings of the ATR indicator, but it is important to remember that doing so will affect its sensitivity.
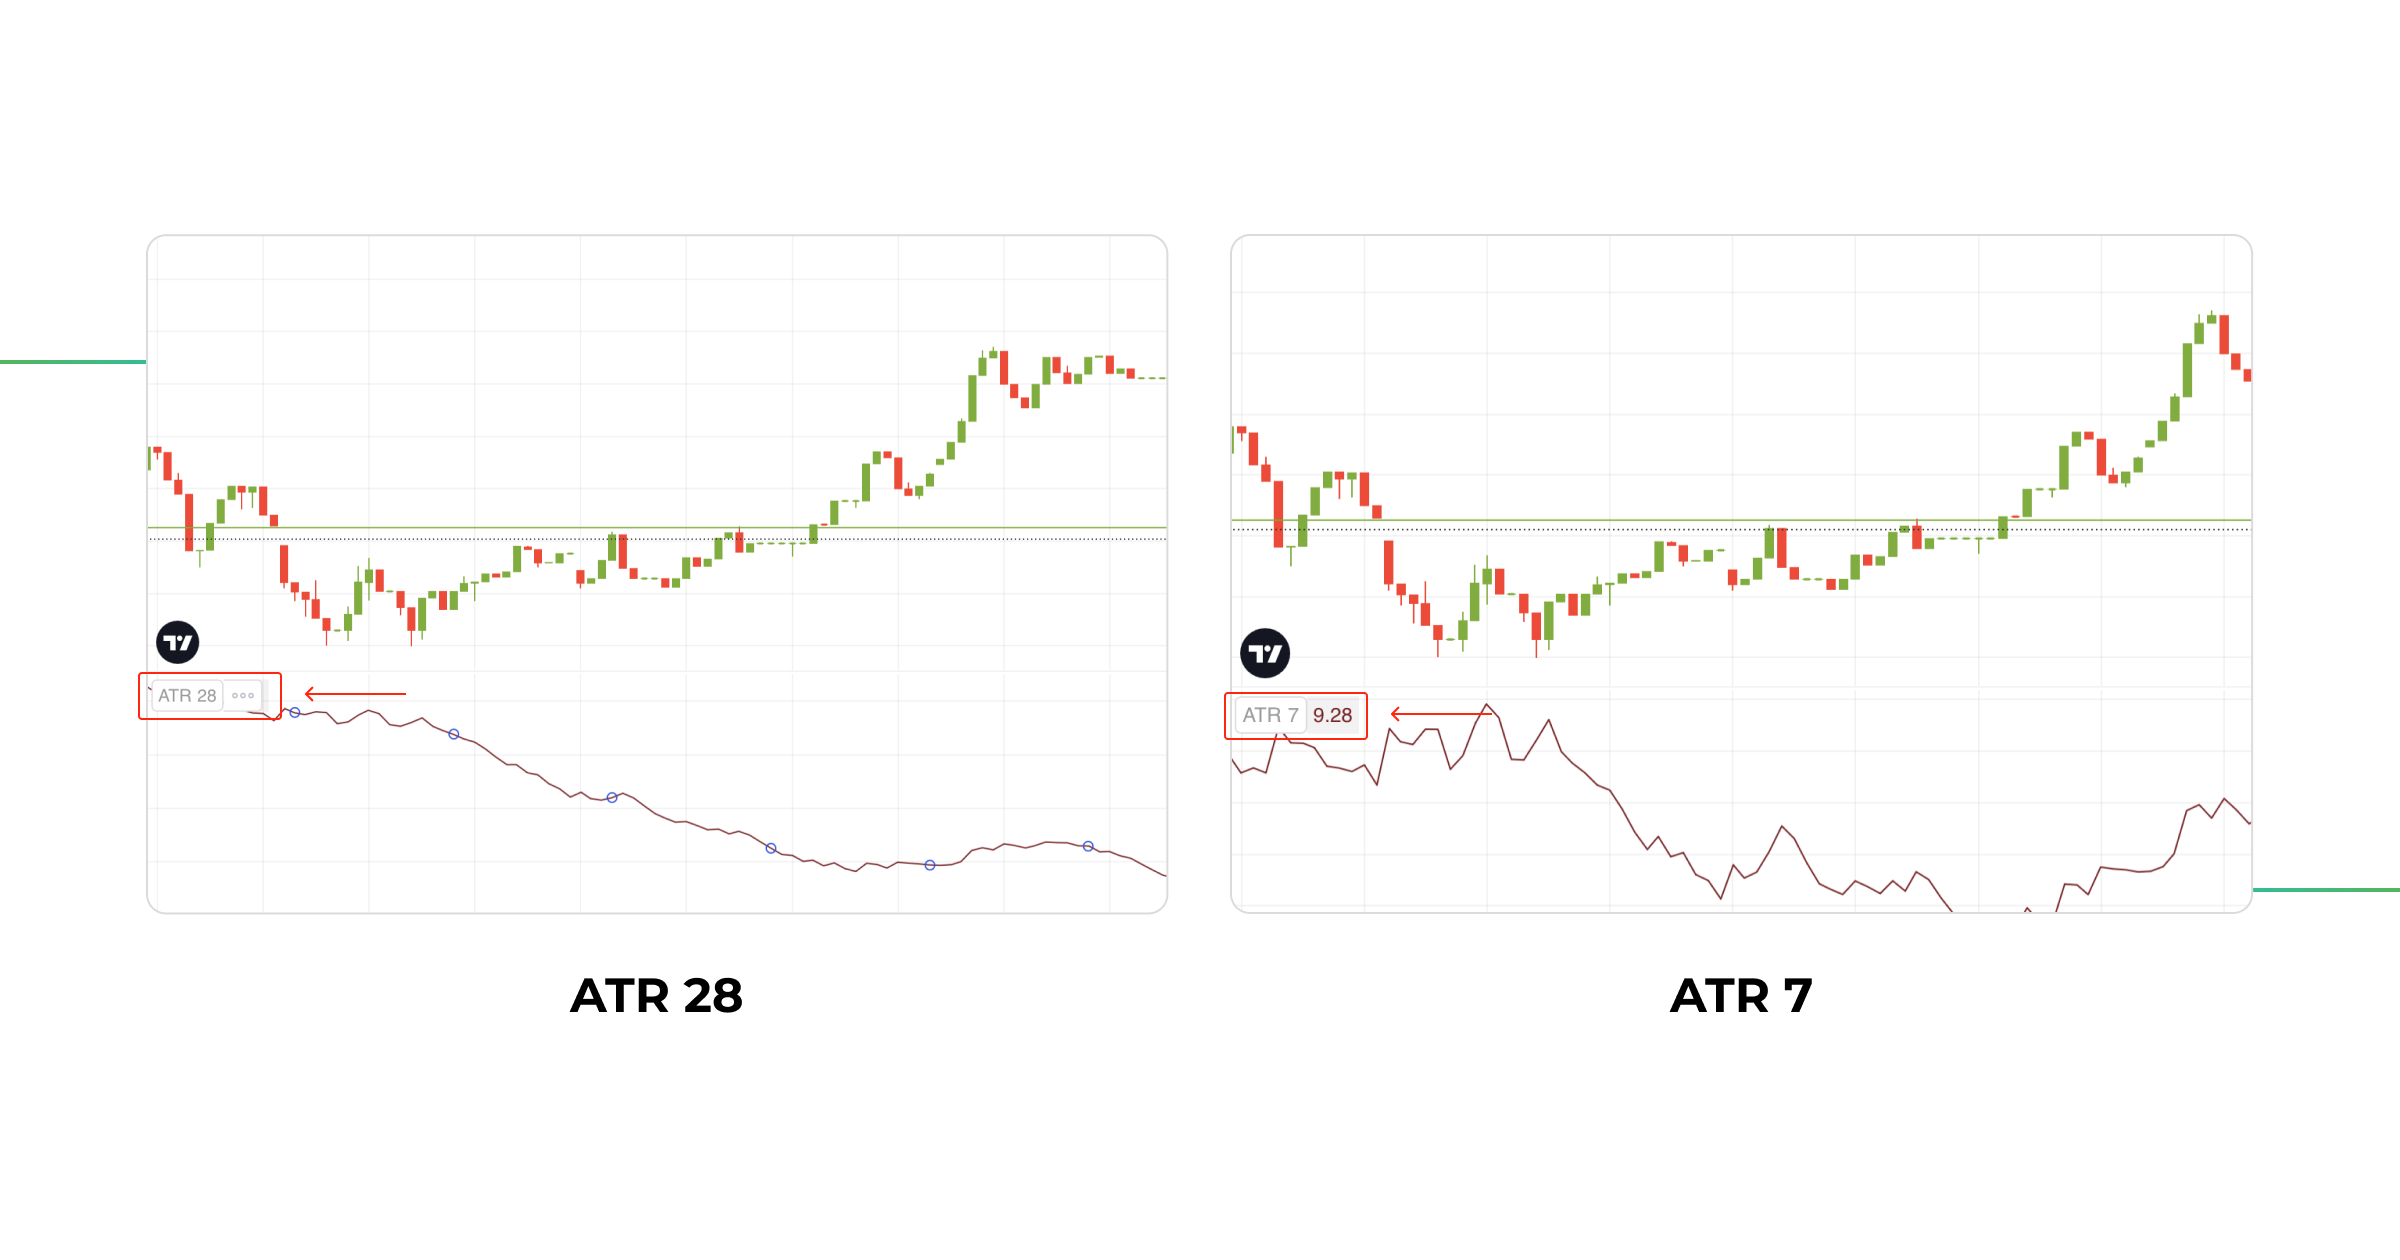
- Adjusting the settings to a value <14 reduces the number of periods used for the indicator’s calculations. As a result, the indicator becomes more sensitive to price movements, leading to a choppy ATR reading.
- Conversely, if you change the settings’ value to >14, this will increase the number of periods on which the indicator bases its calculations. Consequently, this configuration will make the indicator less sensitive to price movements and produce a smoother ATR reading.
Long-term investors may opt for a larger number of periods to obtain a more holistic overview of the market trend, while day traders prefer using a short period-based ATR to effectively grasp the recent market volatility.
The image below demonstrates how these two opposites look on the ATR chart:
If you change the settings of your ATR indicator, always check the impact the change has on results. To do this, after you’ve made a modification, log a series of your trades in your notes and compare the outcome with other ATR settings to see which actually improves or worsens your trades.
Now let’s move on to the reason why we are here – the practical use of ATR!
ATR Trading Strategies
As soon as you hear about stop loss and take profit orders, the fair question arises in your head: “On which levels should I place them?”
Since certain currency pairs are more volatile than others, placing static SP/TP orders isn’t efficient and will bring you more harm than good. Think about this, a 20-pip Stop Loss might be optimal for a EUR/US trading chart as the assets are not very volatile and have a low ATR value. However, in the naturally highly volatile cryptocurrency market, setting a 20-pip Stop Loss or take profit target will result in premature stop-outs or missed profit opportunities.
Same goes with different time frames. Let’s look at the example of BTC price movements on the 15-minute and daily time frames.
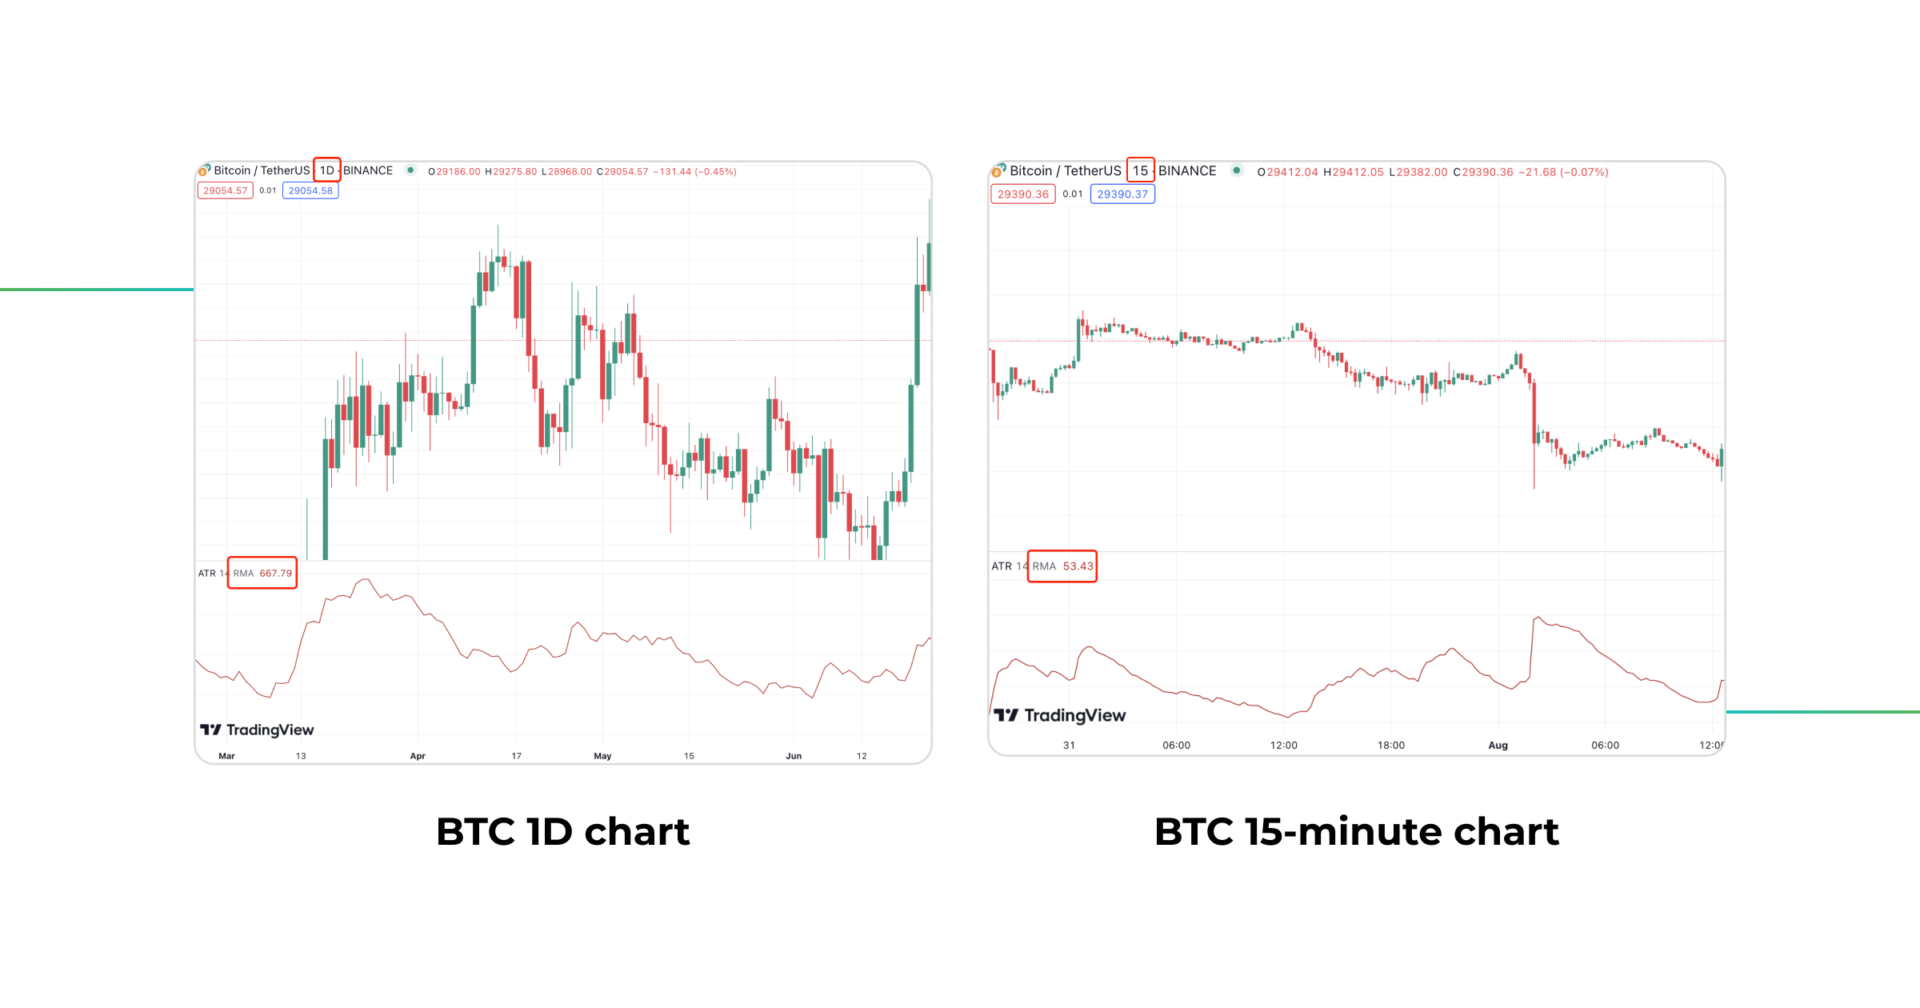
In the 15-minute time frame, the average size of each candle (RMA) is 53.43. However, when we shift our focus to the daily time frame, we observe that the average candle size increases significantly to 667.79. This indicates that price fluctuations within each 15-minute interval tend to be relatively smaller compared to the daily time frame.
Consequently, using a smaller stop loss on the 15-minute time frame can be effective in managing risk because the price is expected to experience smaller intraday swings. At the same time, employing small stop loss as used in the 15-minute time frame would be inadequate on the daily time frame, as it would be easily triggered by the larger price fluctuations that are characteristic of this longer time horizon.
So this is a perfect example of why you need larger stop losses on higher time frames than smaller ones.
Enough with the details, let’s get to the action!
#1: Setting ATR Stop Loss & Take Profit Orders
So, as we described earlier, depending on the market and a time frame you trade on, you might need to set wider or tighter Stop Losses that are adapted to current price volatility.
There are two approaches to determining SL/TP levels using the ATR indicator alone.
Approach 1 – The Simplest Use of ATR
The first approach involves placing Stop Loss and Take Profit orders solely based on a price’s current ATR. A rule of thumb is to determine both SL/TP levels by looking at the indicators reading when you enter your trade and then place your Stop Loss and Take Profit orders at an exact ATR value from your entry or exit. Let’s check 2 possible scenarios – for entering long and short positions.
The use of ATR indicator in your long entry strategy can be seen on the following 1-hour BNB/EUR chart:
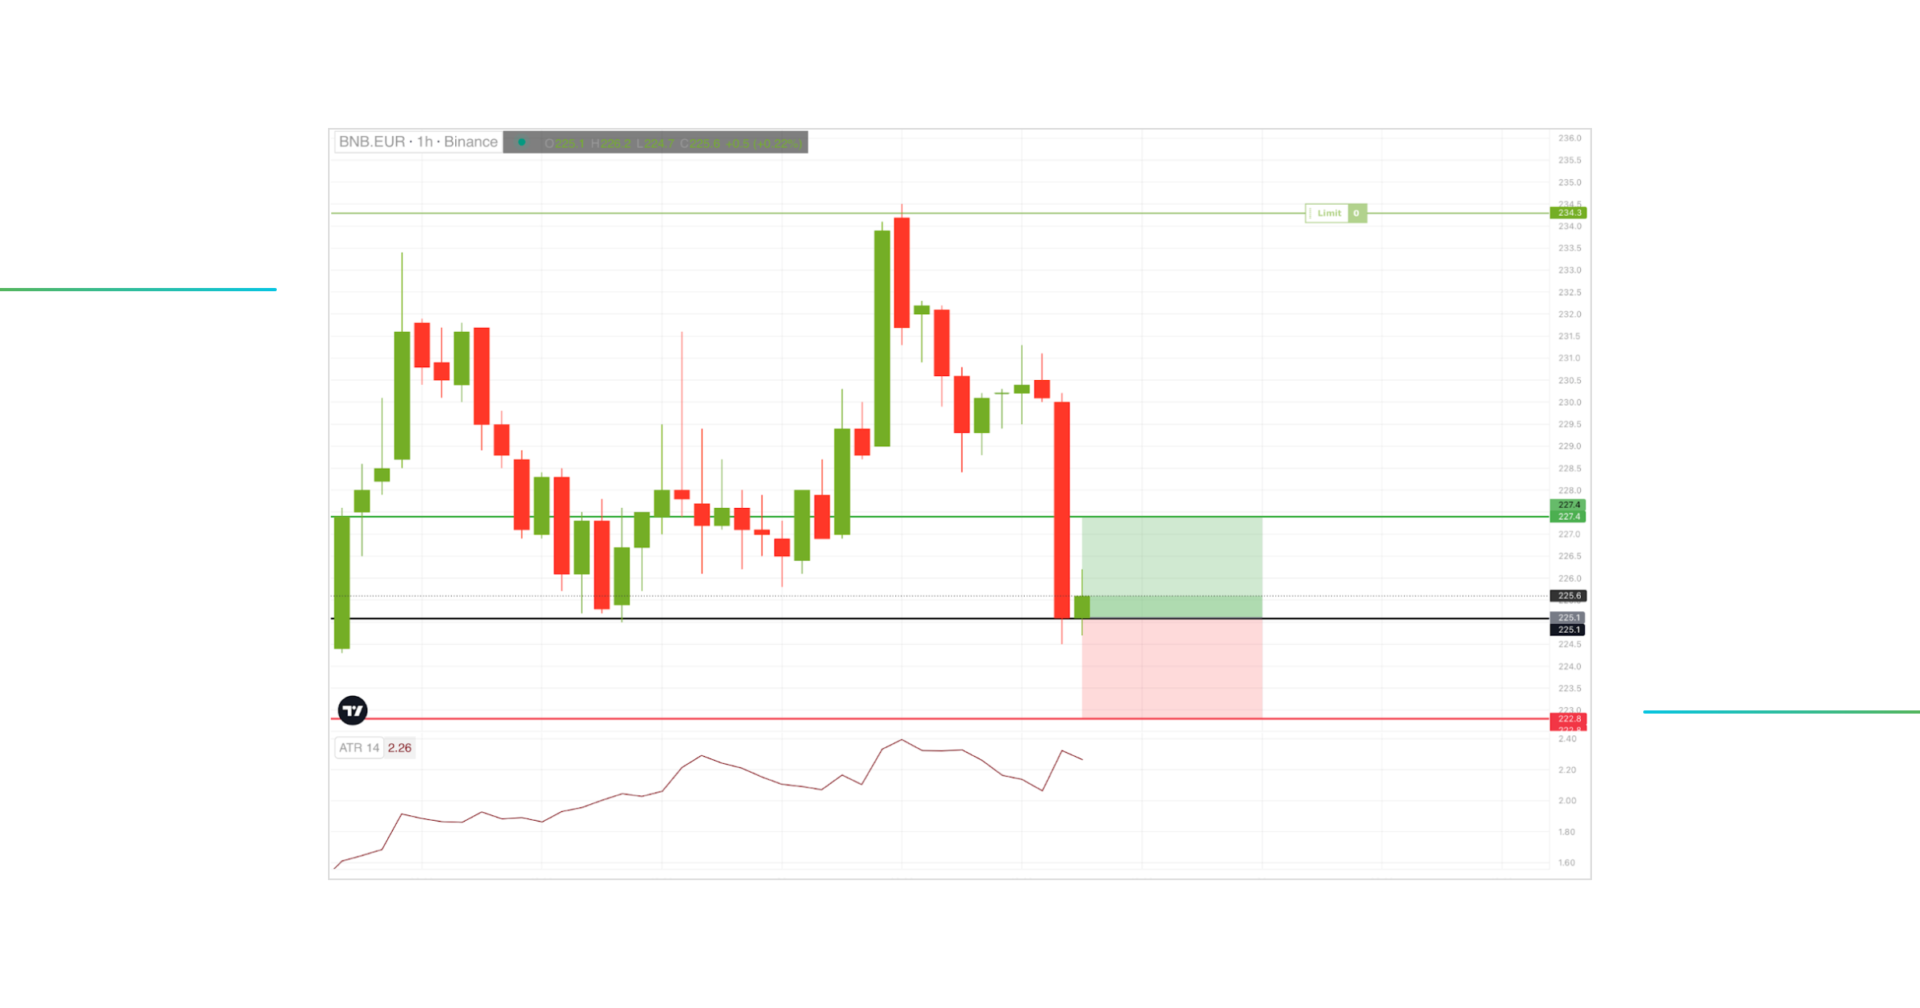
In this particular example, if you want to enter a LONG trade, you should look at the current ATR reading and place your Take Profit $2.26 above your entry price, which equals $227.4. The same rule applies to setting a Stop Loss order. Considering the current ATR value of $2.26, the SL order will be attached to the $222.8 price level.
The reverse is true for entering SHORT positions. Let’s analyze a 1-hour ETH/BTC chart to understand how ATR can be incorporated into your short entry strategy:
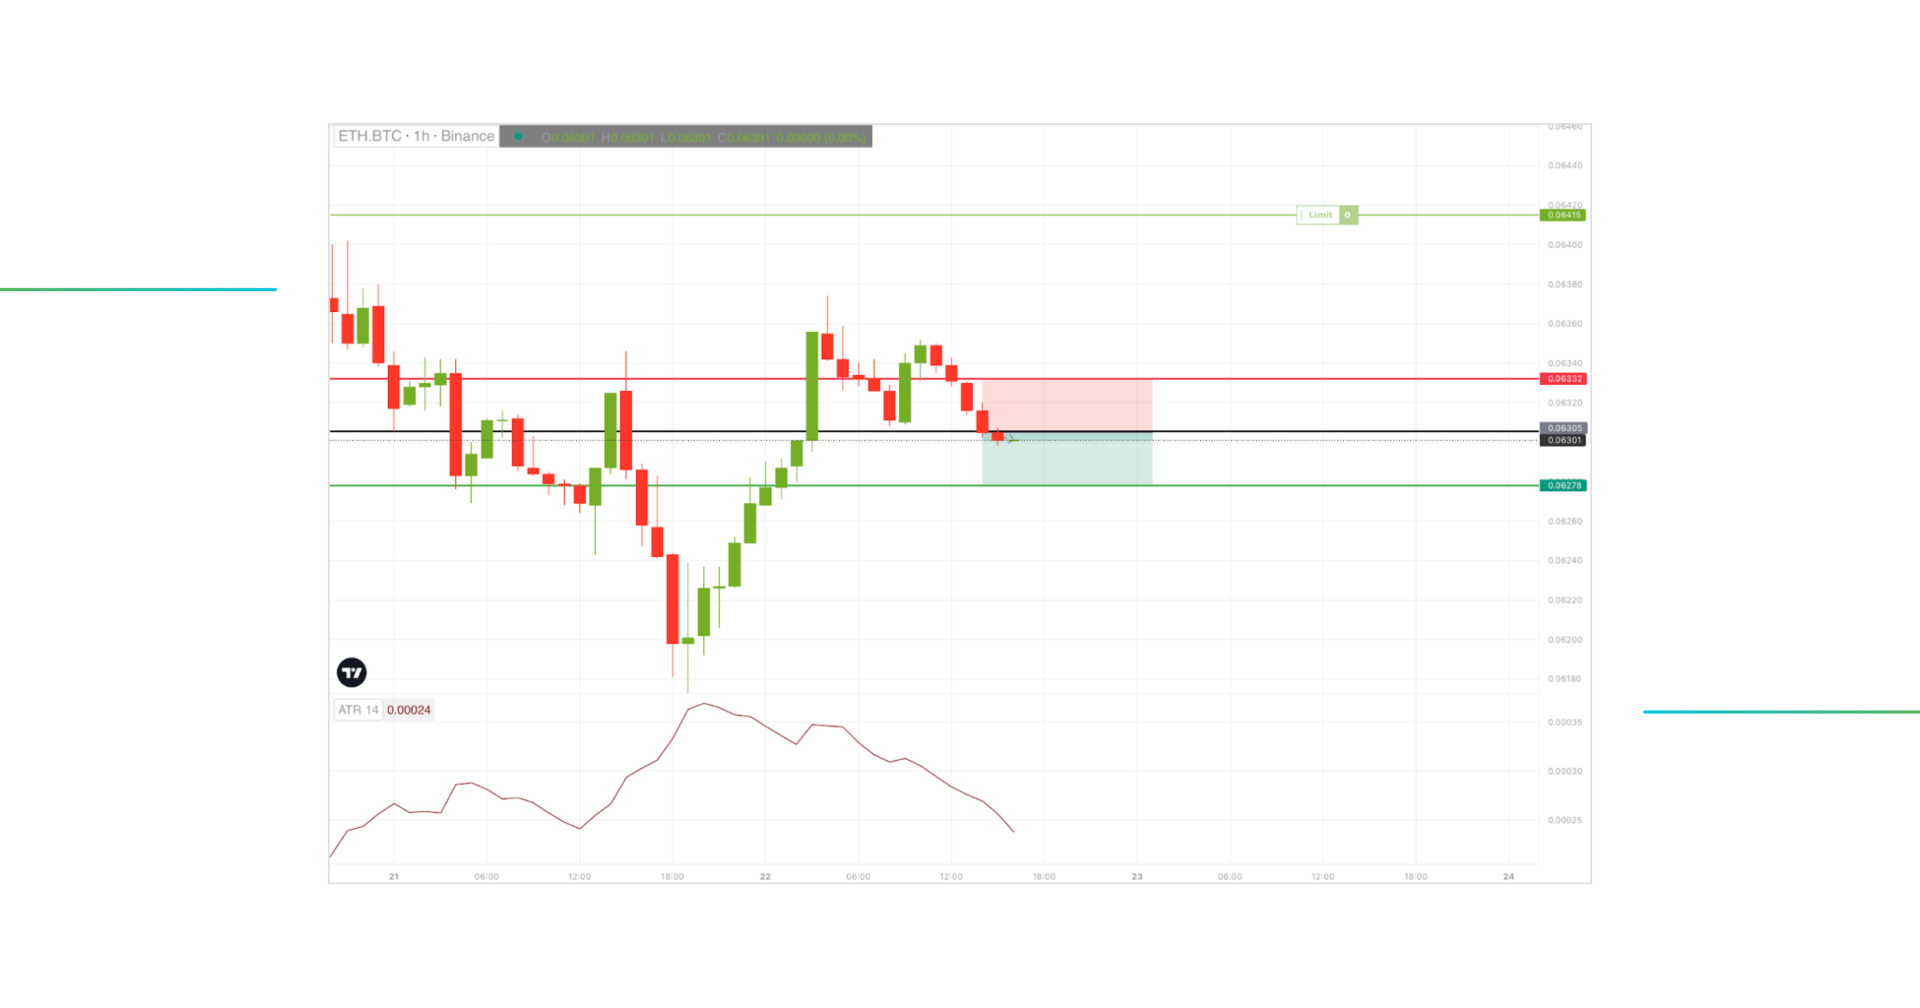
Since the current price bar is still forming, we will use a previous close price as our entry. First things first, you should find out the ATR for the previous bar, which is 0.00026 BTC, and then place a Take Profit order at a distance of ATR above your entry price, equivalent to 0.06278 BTC. Similarly, the Stop Loss will be placed at the price level of 0.06332 BTC for 1 ETH.
As simple as that, your SL/TP orders won’t be hit as often, resulting in more winning trades.
Approach 2 – Placing SL/TP Orders Using a Multiplier
Moving on to the second approach, which also involves the ATR and a multiplier.
Essentially, ATR helps prevent trades from getting stopped accidentally due to temporary price fluctuations. However, whether such a Stop Loss will be enough for you or, on the contrary, it will turn out to be too large, depends on the ATR trading strategy being used.
That is why, to calculate the stop, the ATR indicator is multiplied by a coefficient.
A common strategy is to multiply the ATR by 1.5, 2, or 3 and then use this number to place the Stop Loss and Take Profit below or above your entry price. The daily volatility should not approach your SL/TP trigger price; if it does, it is an indication that the market is rapidly changing directions. The multiplier provides some cushion to adjust for market changes while maintaining a reasonable risk management strategy.
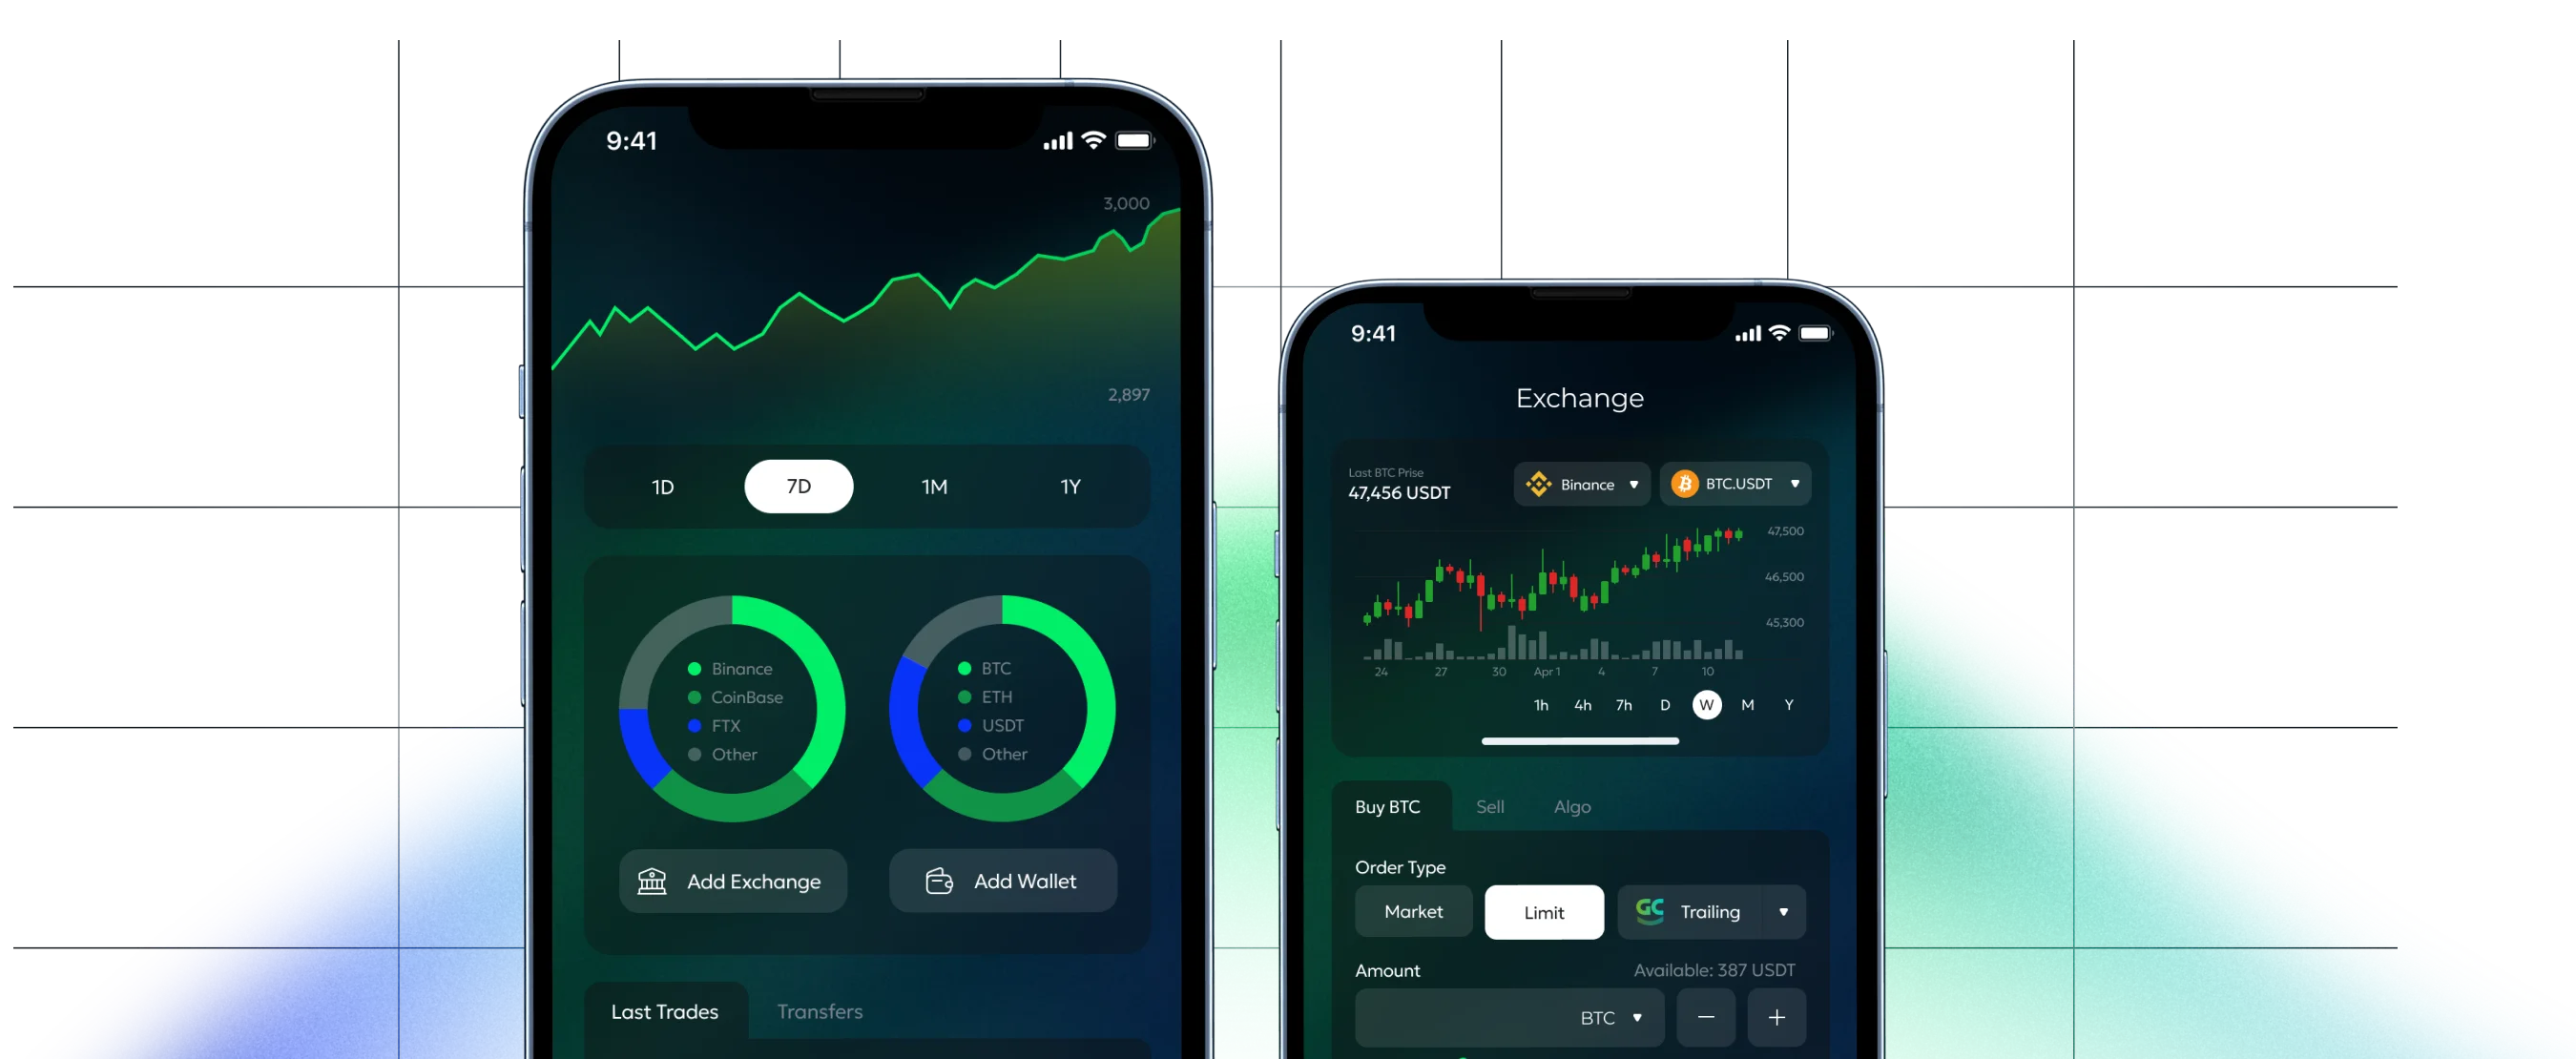
#2: Setting ATR Trailing Stops
Traders can also use a strategy called a Chandelier Exit, which uses ATR to set Trailing Stops and is designed to help traders ride a trend while managing the risk of an early exit in the event of a temporary reversal.
Unlike a traditional Stop Loss order, which is set to be executed at a fixed price, a Trailing Stop order allows the stop price to adjust dynamically based on the movement of the asset’s price.
A common approach is to set a Trailing Stop three times a 14-day ATRs below each new high in an uptrending crypto market, or over each new low in a downtrending one:
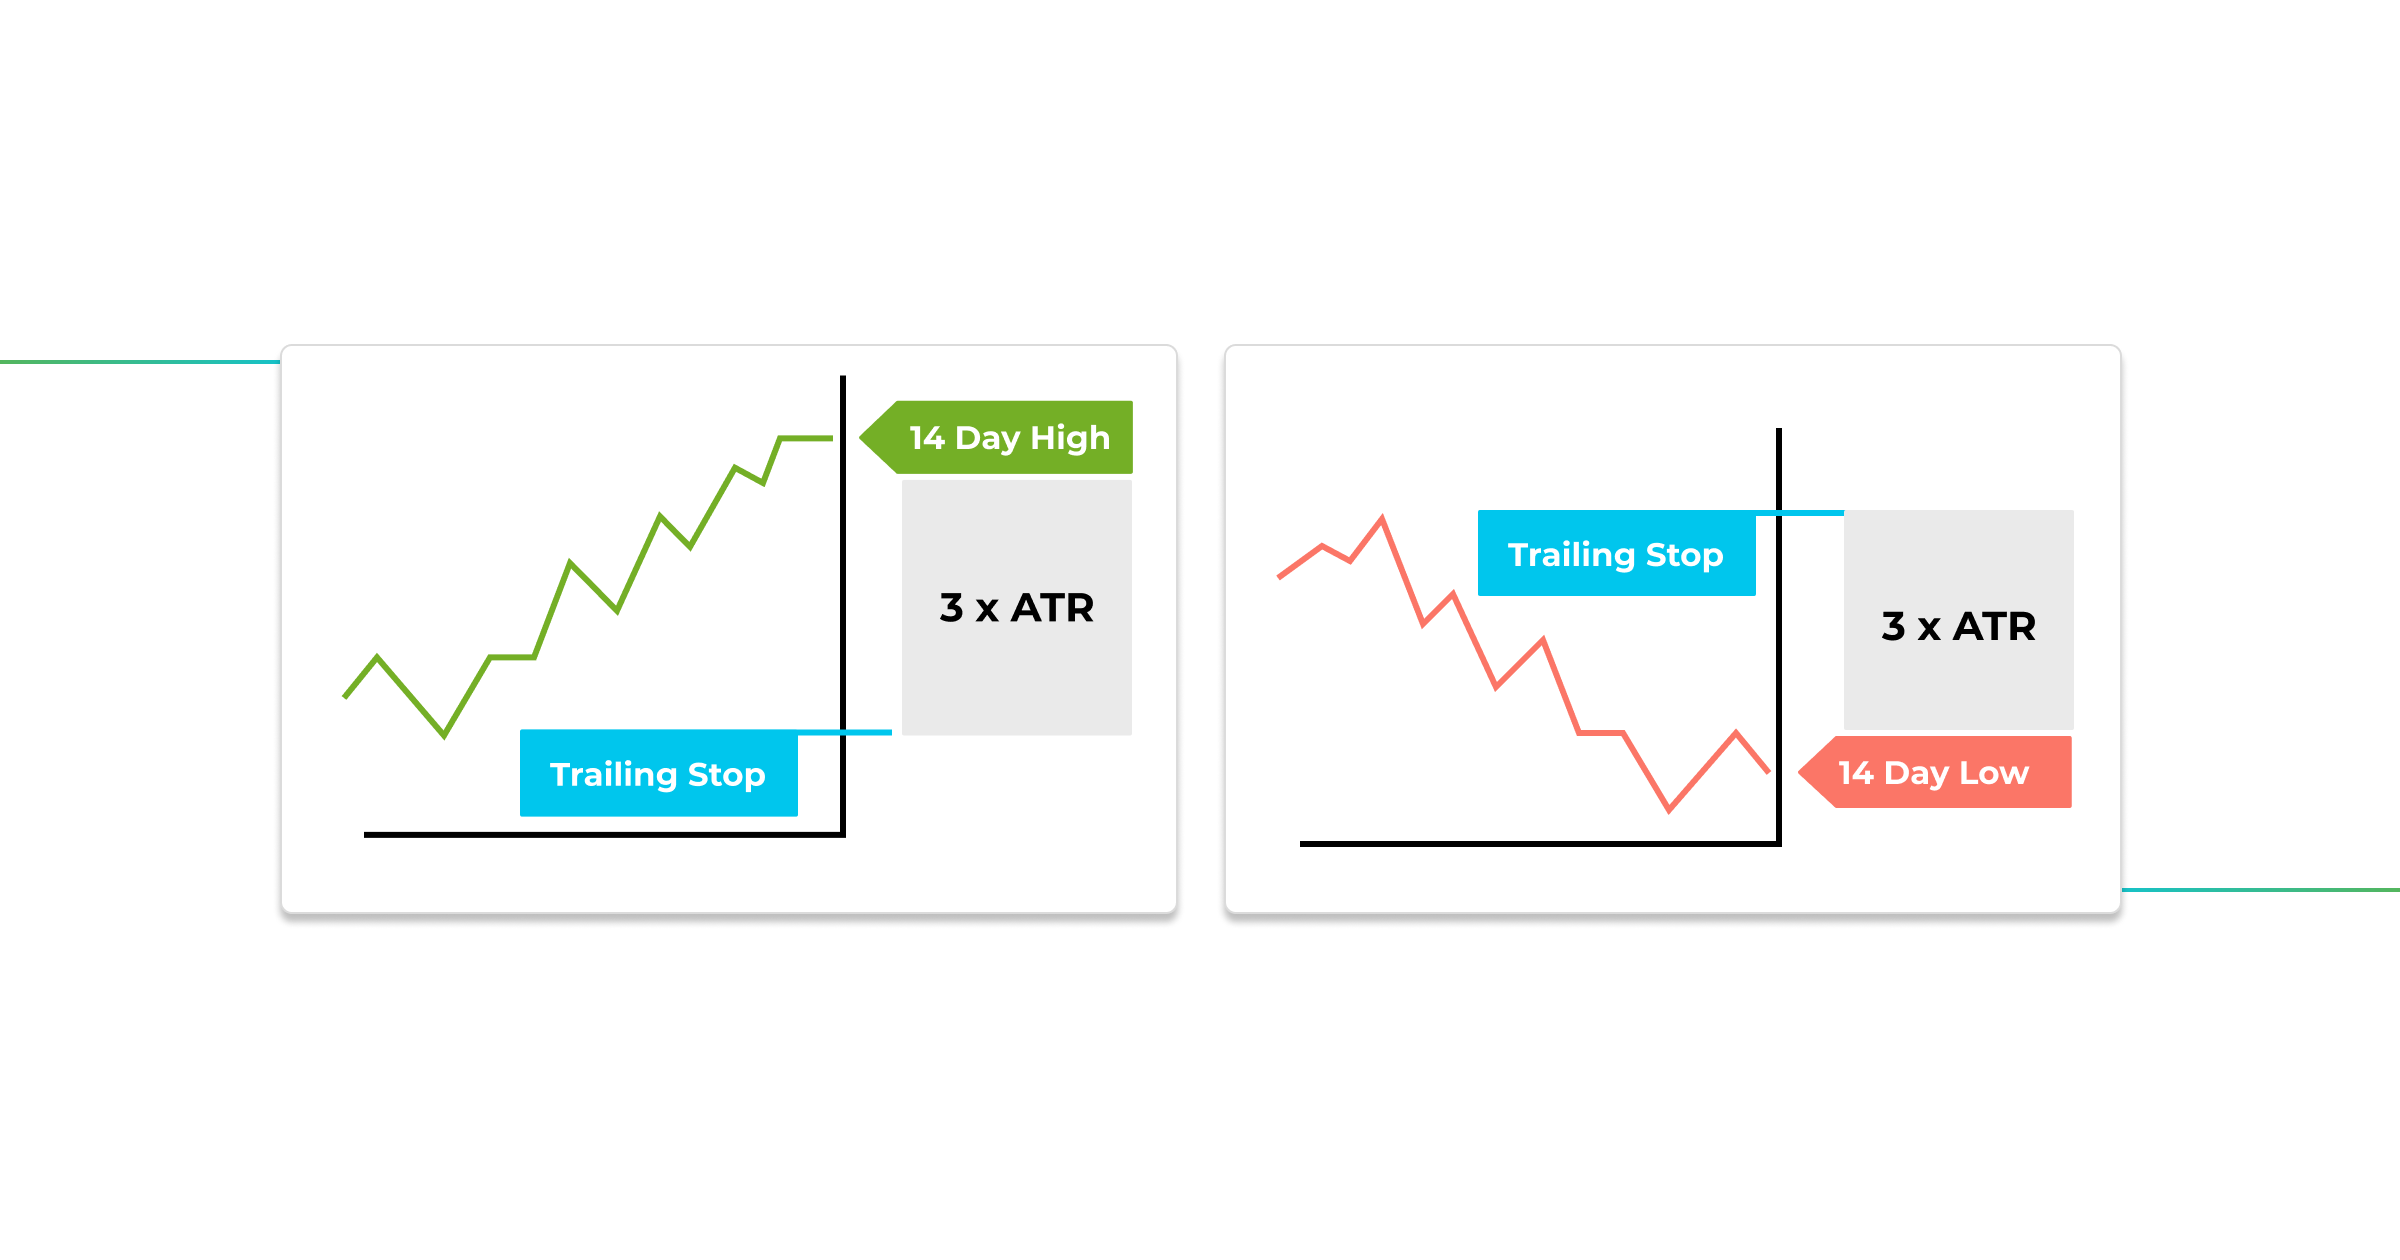
With a Trailing Stop, the stop price can tick up or down to account for changes in the market’s price. Then, if the market changes direction, the stop price will freeze at its new level — and if the market then hits the new stop price, it becomes a market order.
So, if a market has a 14-day ATR of $2, then you would set your Trailing Stop $6 above
or below the current market price.
The idea is to have a buffer that is three times the current volatility of the market.
As a result, when volatility as measured by ATR is high, you have a larger buffer, which
can give a market more room to swing, so be sure you’re comfortable with that.
Conclusion
So, let’s summarize the key points of this article:
- ATR is a technical analysis indicator that provides information about market volatility.
- ATR can help traders predict how far the price of an asset might move in the future. This can be helpful when deciding where to set Stop Loss and Take Profit targets.
- Using ATR for SL/TP placement allows you to avoid any market noise.
- ATR indicator can be used to form an exit strategy by placing Trailing Stop Losses.
As you might’ve observed yourself, ATR is a very useful tool that, for some reason, is not as popular as MACD or RSI. While many rookie traders struggle to grasp the importance of ATR at first, but as they gain more experience and knowledge, its significance becomes evident.
Often, we find ourselves wishing that someone had shared a valuable trading secret with us sooner or that we had devoted more time to studying and learning about essential indicators. The truth is, the world of trading is vast, and there is always something new to discover.
Why not experiment with ATR and lots of other simple and advanced trading indicators for free on GoodCrypto now?
Start Trading ATR With GoodCrypto!
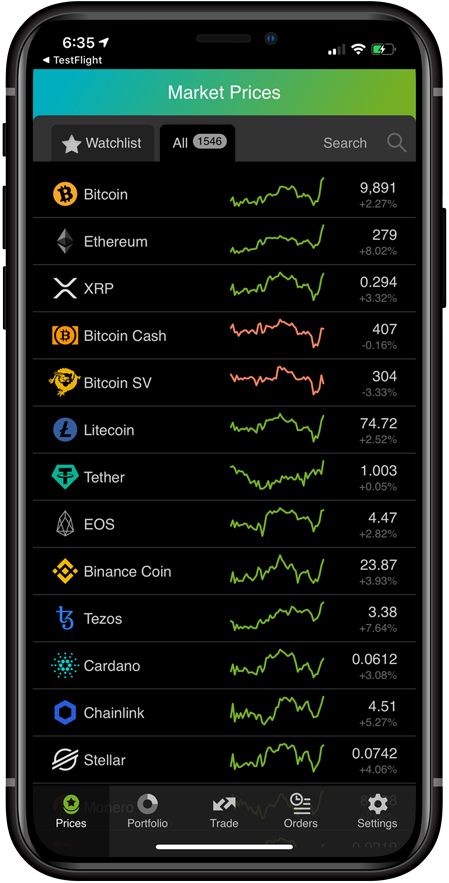
Let us introduce GoodCrypto – a revolutionary app that simplifies trading and portfolio management for anyone who wants to pave their way in the cryptocurrency space. We describe GoodCrypto as an absolute must-have service since it supports a wide range of tools for both trading newbies and nerds like us who are craving an all-in-one feature rich platform.
The platform offers trading on 36 spot and derivative crypto exchanges that can be connected to the app through the API key in just 3 steps. Impressed? As you should!
The Average True Range indicator is just the tip of the iceberg when it comes to the wide array of features and tools available on GoodCrypto, and the best part is, you can access them all for free.
What truly differentiates GoodCrypto from other apps is a comprehensive set of advanced trading tools like Grid Bot, Infinity Trailing, DCA Bot, TradingView Webhooks, as well as Take Profit & Stop Loss combos, and more.
Not only does the Good Crypto app allow trading with Trailing Stop orders on the 36 largest crypto exchanges, but it goes a step further by offering Trailing Stop Limit orders as well.
It is your sign to break free from losing your trades and take full control of your winnings!