Day-Trading Cryptocurrency

Day-Trading Cryptocurrency: a Conjunction of Strategy and Execution

According to the latest report we have, there are about 51 million active crypto traders worldwide. This is an absolutely staggering figure, which amounts to about 0.6% of the worldwide population! For context, there are about 25 million software developers worldwide.

We couldn’t help but think: how many of those 51 million people deploy any sort of strategies in their trading? The answer is, on the balance of probabilities, not many. Which means a lot of people would benefit tremendously from educating themselves about trading strategies and finding what works best for them or maybe picking up a good cryptocurrency trading course.

In this article, we’re going to dwell upon some of the entry-level, yet undervalued crypto day-trading strategies and show why your trade execution and adherence to rules, in most cases, matter even more than the strategy itself.

What are the most undervalued cryptocurrency trading strategies?

You’ve probably done quite a bit of research into what trading strategies are typically deployed when day-trading cryptocurrencies. And thus, you probably know that there are a LOT of strategies out there. Needless to say, most of them are outright useless. So, what parameters should you apply when selecting the right strategy? Well, one thing is for sure: do not overcomplicate. Simplicity is key, and the simpler your strategy, the easier it would be to master (provided it works, of course).

Simple Moving Averages

Here’s an example of a common SMA strategy:
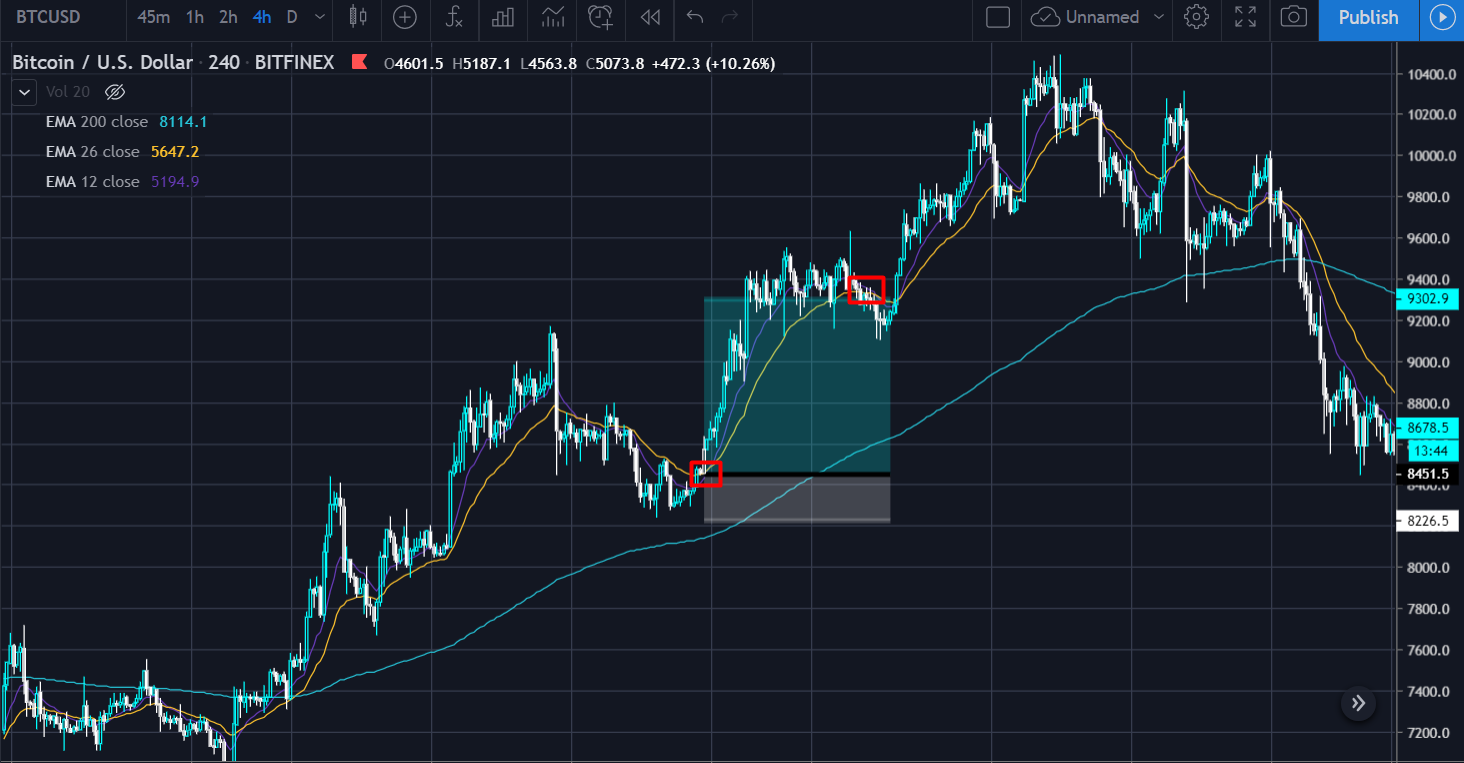
Timeframe: 4H

Moving Averages: 200, 12 and 26-period Exponential Moving Averages (EMA).

Whenever the price is below the 200-EMA, you should trade with a bearish bias (only take short-side trades), and vice-versa.

Whenever the 12-period EMA crosses below a 26-period EMA, this generates a sell signal and you should sell (or cover an existing long position). When the 12-period EMA crosses the 26-period EMA, you should buy (or cover an existing short position). It is also considered good practice to place your stop-loss below a previous low.

This strategy is a great, simple indicator of convergence and divergence between medium-term momentum and the short-term momentum, showing you when the price is accelerating in either direction, up- or downside.

An example of how this could be successfully executed is shown on a screenshot below:

Simple Moving Averages
An example of how this could be successfully executed is shown on a screenshot

A Confluence of RSI and MACD

The two most-used indicators – Relative Strength Index (RSI for short) and the Moving Average Convergence-Divergence indicator (MACD) can be proven very efficient when used together.

But in order to do so efficiently, you have to understand exactly how they work. Let’s see how each of them is calculated.

“RSI is computed with a two-part calculation that starts with the following formula:

A Confluence of RSI and MACD
“RSI is computed with a two-part calculation that starts with the following formula:

The average gain or loss used in the calculation is the average percentage gain or losses during a look-back period. The formula uses positive values for the average losses” (Source: Investopedia).

For the second step, we need at least 14 data-points. Once we have them, we calculate the RSI and plot that along the price-action chart.

The average gain or loss used in the calculation is the average percentage gain or losses during a look-back period. The formula uses positive values for the average losses”
For the second step, we need at least 14 data-points. Once we have them, we calculate the RSI and plot that along the price-action chart.

“MACD is calculated by subtracting the long-term EMA (26 periods) from the short-term EMA (12 periods)” (Source: Investopedia).

Thus, the MACD has three elements: the 12 and 26-period exponential moving averages, and the arithmetical difference between the two.

Both the RSI and the MACD are oscillators, meaning that both indicators calculate their values based on the price.

These indicators are best used when they complement each other. Meaning, if you have a confluence – both indicators are giving the same signal, either to buy or to sell, then you act on it; otherwise – you don’t.

Get the App. Get Started.

Keep your portfolio in your pocket. Trade at any time, from anywhere, on any exchange and get the latest market insight & custom notifications

phone

A basic example would be:

On a 4-hour time-frame chart, when the MACD is producing a bullish signal (the 12-period EMA crosses the 26-period EMA to the upside), you execute a buy order. The trick here is to make sure that the RSI is complementing the MACD: if the price-action is not overbought (RSI is below 70), then you can execute the buy order. If the RSI is >70, this would mean the price-action is overbought and the indicators are conflicting with each other. And vice-versa: if the MACD is showing a sell signal, but the RSI is oversold (<30), you should not follow this sell signal.

Example:

On a 4-hour time-frame chart, when the MACD is producing a bullish signal (the 12-period EMA crosses the 26-period EMA to the upside), you execute a buy order.
And vice-versa: if the MACD is showing a sell signal, but the RSI is oversold (<30), you should not follow this sell signal.

On the example above, we can see how a trader has entered a trade when the MACD gave a bullish signal, placing the stop-loss under the previous low, and the RSI was not in the overbought territory. Once the RSI crossed 70, the trader exited their position and secured a safe, winning trade. You can also simply reduce risk (close part of the position) once the RSI hits 70.

Dollar-Cost Averaging

This one, being the only long-term strategy on the list, is probably the simplest as well. Basically, you just buy a fixed amount (or sell short, but be careful with that) of what you think are the most promising cryptocurrencies over set periods of time, averaging down (or up, if it’s short) their buy-in price.

The strategy has two distinct advantages: you don’t have to worry about the day-to-day price action since you’re buying for the long term, and it’s not as demoralizing if the market goes down – because then you just improve your average buy-in price.

A good example would be buying bitcoin once a week during the first quarter of 2019 when the price was consolidating between $3.3k and $4.3k. If you were actively trading during that period of time, chances are you’d get eviscerated as the price action was extremely choppy. However, if you DCA‘d, you’d be ripping the rewards just three months later, when the price hit $13k.

Why Execution Matters Just as Much as Having the Right Strategy

Why Execution Matters Just as Much as Having the Right Strategy
Probably by far the most overlooked aspect of trading out there: adhering to your game-plan.

Probably by far the most overlooked aspect of trading out there: adhering to your game-plan. While it is detrimental to have an actually working, well-backtested strategy to trade with, it is just as important to always remember that you have to actually play by the rules set in the said strategy.

Many traders suffer from emotional trading, a phenomenon known in the trading community to be the most challenging aspect of trading. This includes things like:

  • Chasing your losers – widening your pre-determined stop-losses to “give the trade more breathing room”
  • Using excessive leverage when being on a losing streak
  • Executing trades before the actual signals are triggered by the indicators you’re using
  • Cutting the winning trades too early

Experienced traders will tell you that the right execution of trades is what comprises most of your P&L. Thus, setting clear rules, adhering to them and constantly checking whether you need to improve your execution is key to the successful deployment of any strategy.

So, what are the questions you should ask yourself when deciding whether you’ve executed well? Here’s a list:

  • Did I execute that trade because my strategy told me to do so, or was there an emotional element to it?
  • If you’re on a losing streak, try to see whether you’re just trying to “get rich quick”, instead of entering and exiting a trade in a systematic way
  • Are you accounting for slippage and trading fees when setting your stop-losses?
  • Are you using the right leverage?
  • Are you overtrading? Even if you’re a day-trader, making 5-10 trades per day is probably too much and you will get destroyed by trade fees
  • Are you proactive when analysing the trades and polishing your strategy? Avoid making the same mistake and thinking that “it was a good trade” in hindsight. If a pattern looks good on paper but fails in action – consider stopping using it

Also, it is a good practice to use a trading journal – novice traders who start making notes about their trades to conduct periodic analysis very often report improved results.

Last but not least, make sure you’re using the right trading software. That’s where GoodCrypto really shines – it is probably the best trading platform for cryptocurrency on mobile devices, allowing you to access 20+ exchanges, set custom alerts, take advantage of advanced order-types available on all supported exchanges and use custom alerts!

Share this post:

March 2, 2020

Recent posts
Navigating the DEX Tools: A Complete Guide to Essential DeFi Tools

The DeFi revolution is roaring, but navigating its vast expanse can feel like charting uncharted waters with a blindfold on. Yet, for the discerning investor...

March 22, 2024
goodcryptoX beta is live! Dive into the exciting world of DEX trading!

Not so long ago GoodCrypto embarked on a mission to revolutionize the DeFi ecosystem by introducing advanced trading tools previously exclusive to CEXs into ...

March 15, 2024
Trailing Stop Loss and Trailing Take Profit Orders Explained

Get the basics of Trailing Stop Loss & Trailing Take Profit orders, use cases, and correct setup in the GoodCrypto app.

February 22, 2024
Got A Successful Trading Case With GoodСrypto Bots? Share & Win Prizes!

Got a successful trading case using GoodCrypto's innovative bots? Share it on Twitter and get a chance a win prizes!

February 8, 2024