We’re proud to be the first to launch a DCA bot for DEXs! Enjoy the same DCA trading experience you’re used to on CEXs but with no technical limitations.
July 2, 2025
Candlestick patterns are universal tools in the arsenal of any cryptocurrency trader. Understanding them, and the various historical chart patterns are what allows crypto traders to interpret and analyze the trend of the market and make pattern trading decisions. Which are hopefully profitable! The better and more experienced you are at technical analysis skews the odds in your favor of making the most from bullish and bearish trends. It’s highly suggested to combine candlestick patterns trading with things like trading based on trend lines for extra confluence.
Anyways, let’s get into the various types of crypto chart patterns that traders use and how to spot them with guides. Hopefully, by the end of this article, you’ll feel like a pro at spotting chart patterns.
Before getting into the various types of trading patterns. Let’s first understand what a candlestick is. It’s just a single bar that shows the movement of a particular asset or crypto’s price over a certain period of time. It shows us the open, high, low, and close for our selected time frame. People typically make their trades based on 1,2, and 4 hour time frames, or candles, as well as daily, weekly, and monthly. However, all of the patterns gone over in this encyclopedia of chart patterns can be applied to lower time frames and candles such as the 1, 15, and 30 minute. Though, one must be careful on such low time frames, as the crypto market is very, very volatile.
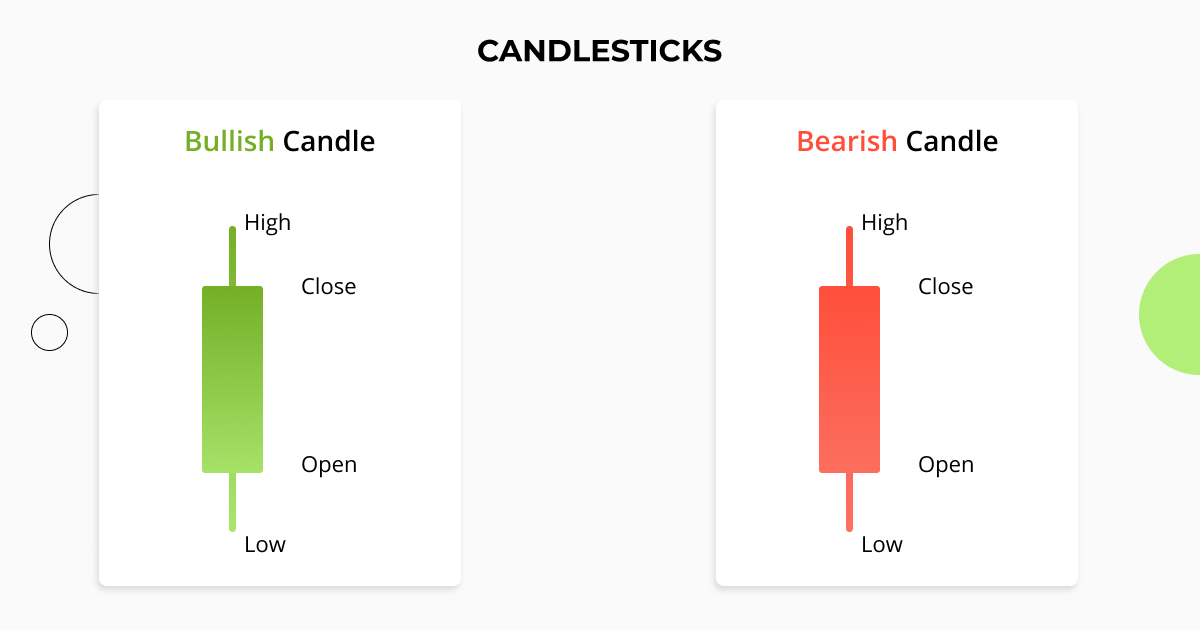
Above is an example of what candlesticks look like and what they represent. Every candle has a low price, high price, and an open and close price, represented by the wicks (or legs) and “body” of a candle, respectively.
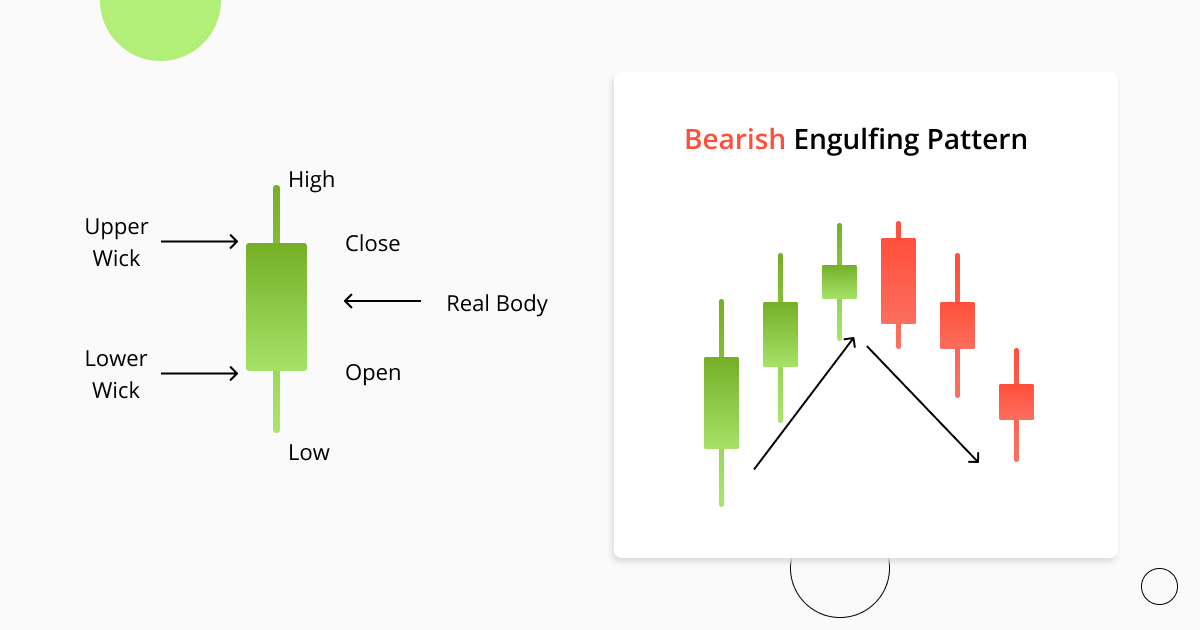
Over time, individual candlesticks form day trading patterns or reversal patterns. As seen in the image above. There are a great many candlestick patterns that indicate an opportunity within the market – some provide insight into the balance between buying and selling pressure, while others identify continuation patterns or market indecision.
With time, these separate candlesticks create different day trading patterns or reversal patterns that are used in trading chart patterns. Traders rely on analyzing these patterns to gauge support & resistance levels and to get a heads up on what’s going to happen in the market next. There are a lot of different candlestick patterns that provide traders with great opportunities.
Typically, in the market, we see the following types of trading patterns:
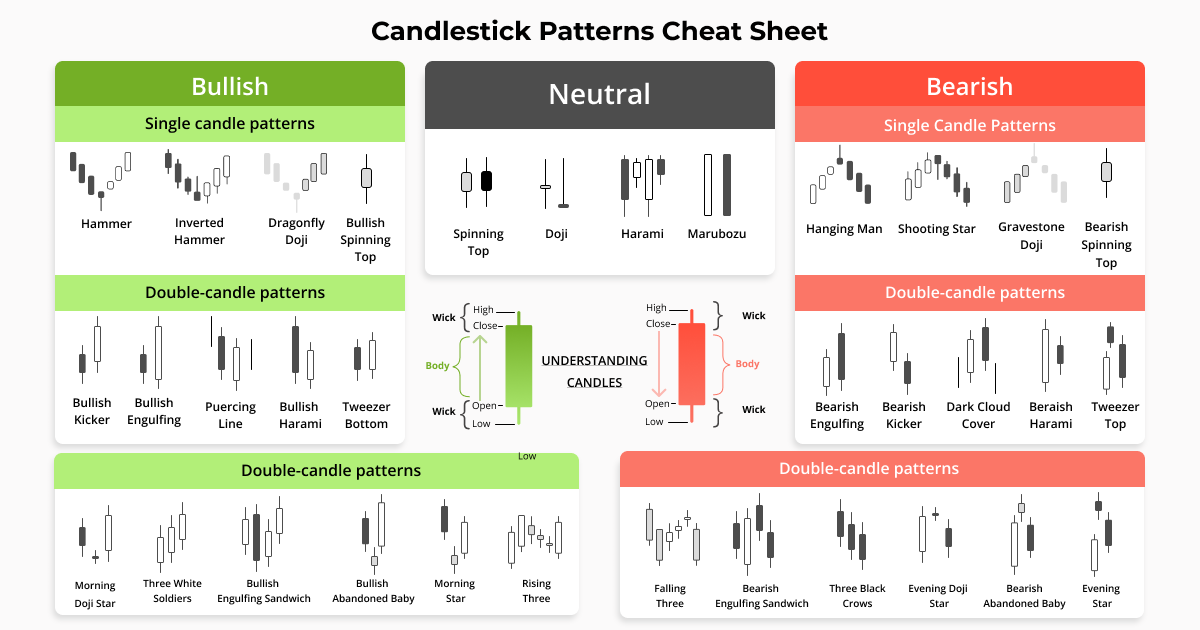
Bullish candlestick patterns form at a market downturn and signal that the price of an asset is likely to reverse. Which would lead a trader to consider opening a long position and profit from an upward move. Whereas bearish candlestick patterns are seen at the end of an uptrend. Which lets traders know that the price of a crypto is at a heavy point of resistance and that price may fall due to buyer exhaustion. Both can be considered trend reversal patterns.
However, candlestick trading patterns don’t necessarily have to indicate a shift in the market’s direction. There exist what are known as continuation candlestick patterns that are considered as a confirmation that the trade will go on. The continuation patterns are also associated with periods of rest and sideways or neutral price movement in the market.
To help you quickly spot all the different types of candlestick patterns, we created this candlestick patterns cheat sheet for a quick visualization of them. Since we will cover a wide range of the most common candlestick trading patterns, having a good overview will be essential.
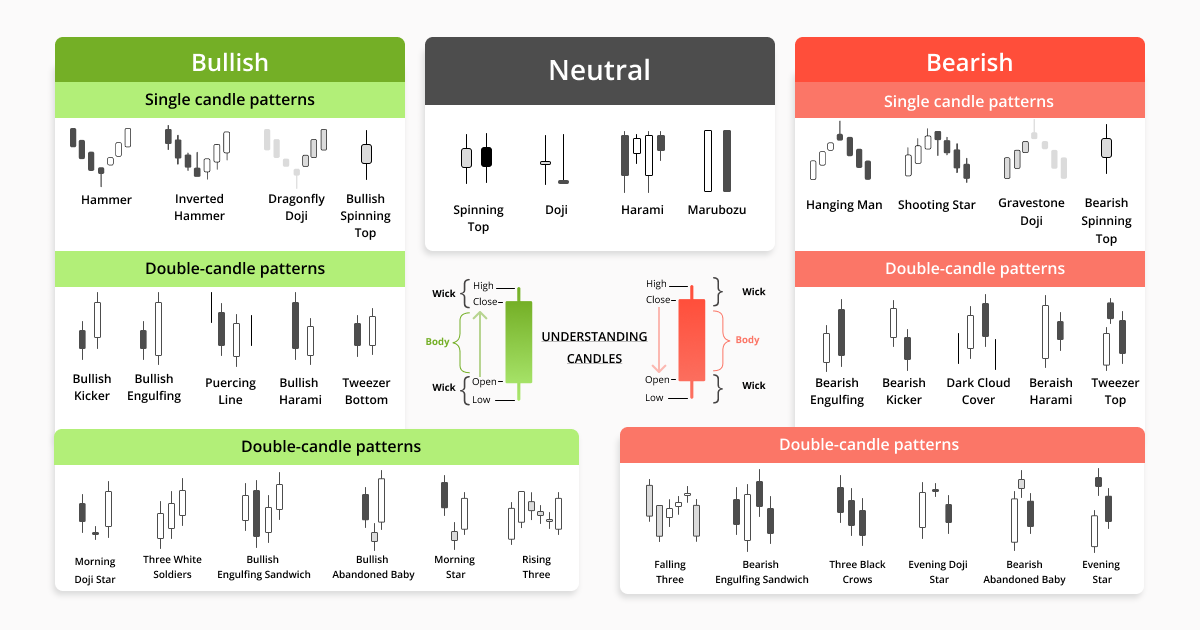
Now, let’s go through the main types of candlestick patterns to learn how to detect and read them on crypto charts.
It’s not a secret that understanding candlestick patterns will make you a powerful trader capable of making an income purely by reading candlestick patterns and trading candlestick patterns and price movements.
The real beauty here is that anyone can apply this technical knowledge and use candlestick trading patterns on any time frame and combine them with any other strategy. After reading this guide with the best candlestick patterns, you’ll easily be able to start spotting and using candlestick patterns for day trading.
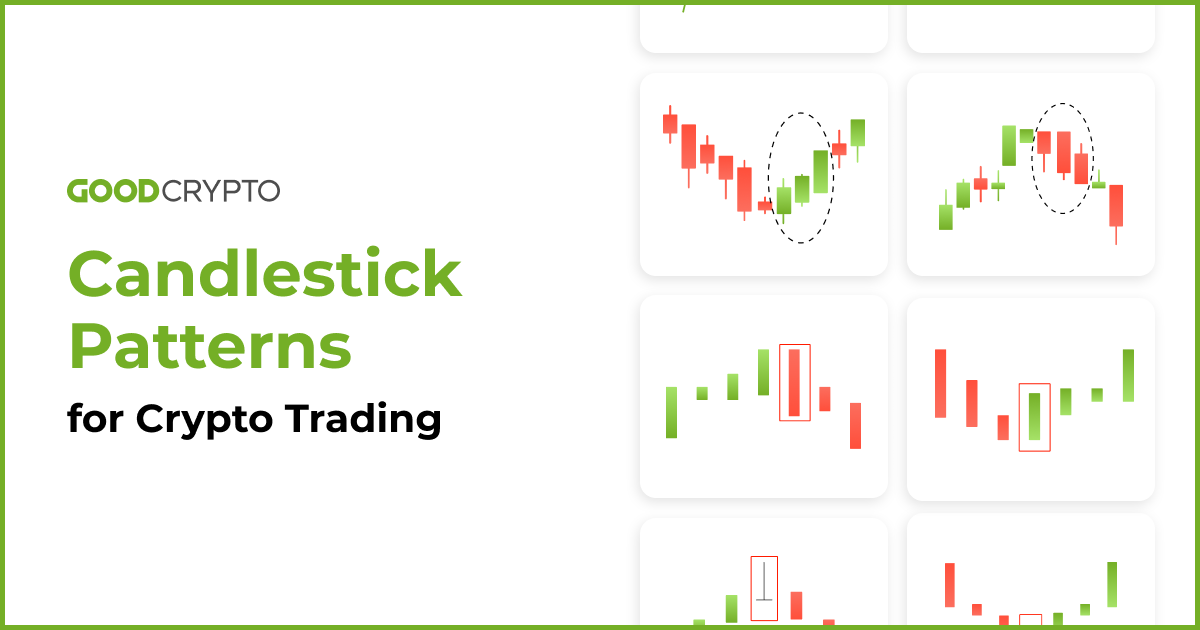
So let’s get to it and over some candlestick patterns explained with examples from the Good Crypto trading app. Get ready and sit back comfortably as you learn about the most reliable candlestick patterns.
If you want to learn how to draw candlestick patterns on the chart and observe various examples, please, read the previous episode of this chart patterns article series.
So, let’s get down to business…
We’ll start things off with the Hammer candle. Honestly, the hammer candlestick pattern is probably the most used and taught trading pattern there is. The reason for that is that the hammer chart pattern is very easy to spot and use. Typically, bullish hammer candlesticks are found at the bottom of a market downtrend. Whereas bearish candlestick patterns are seen at the end of an uptrend.
The hammer pattern is a signal that selling pressure on an asset is weakening and that buyers are stepping in to place bids. Below is an example of a hammer candlestick pattern, which is obviously bullish.
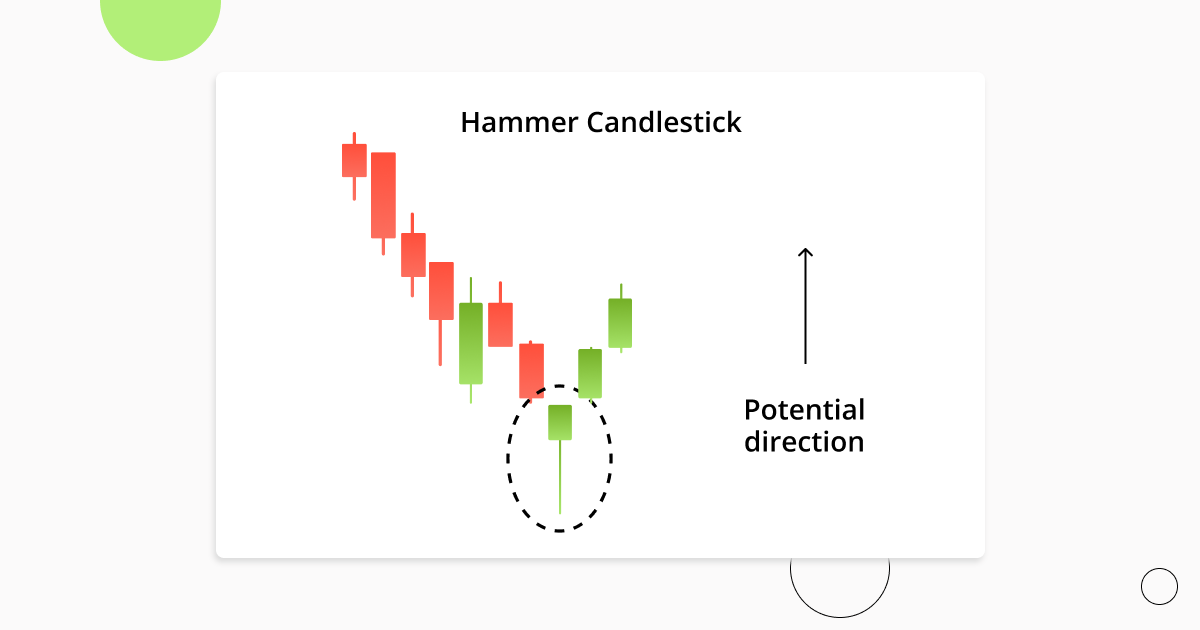
As we can see in the example above. Sellers tried to take the price as low as possible (based on the long wick), however, they were weak and buyers swooped in, resulting in the bullish hammer candlestick above. Notice the hammer-like shape of the candle? Also note that the longer the wick of the hammer in candlestick chart, the greater the buying pressure.
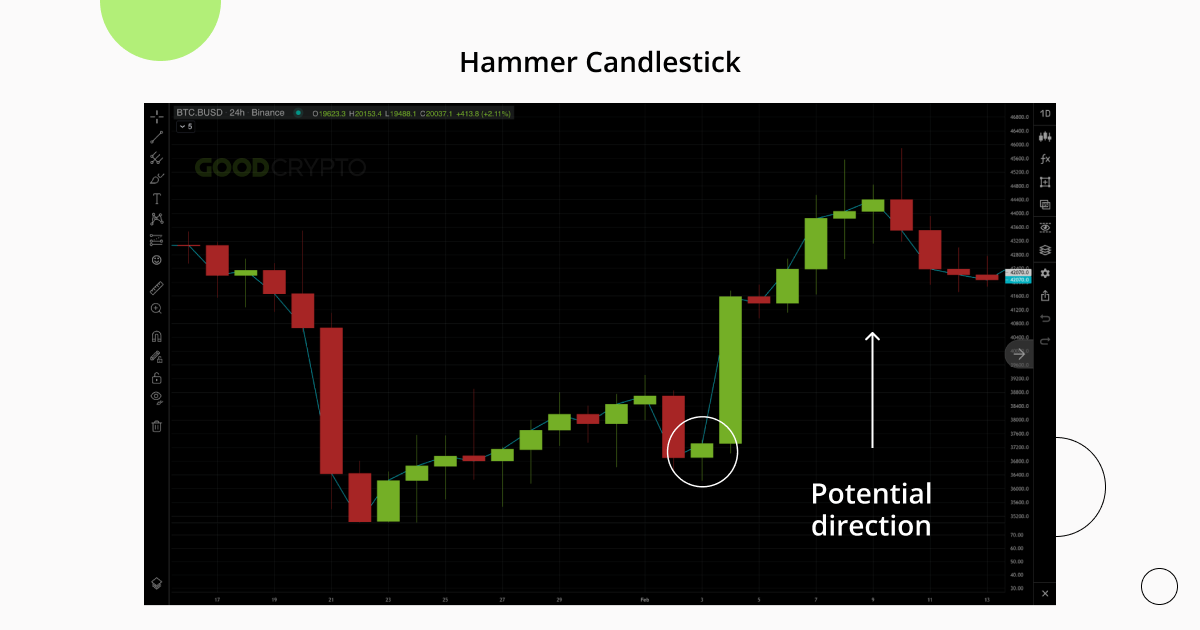
An example of the Hammer Candlestick Pattern on the GoodCrypto chart.
There is also the inverted hammer candlestick. It’s also bullish, but its top wick is long while the bottom one is short. The inverted hammer pattern indicates that there was substantial buying pressure followed by some sell pressure. But ultimately that buyers ended up having greater control.
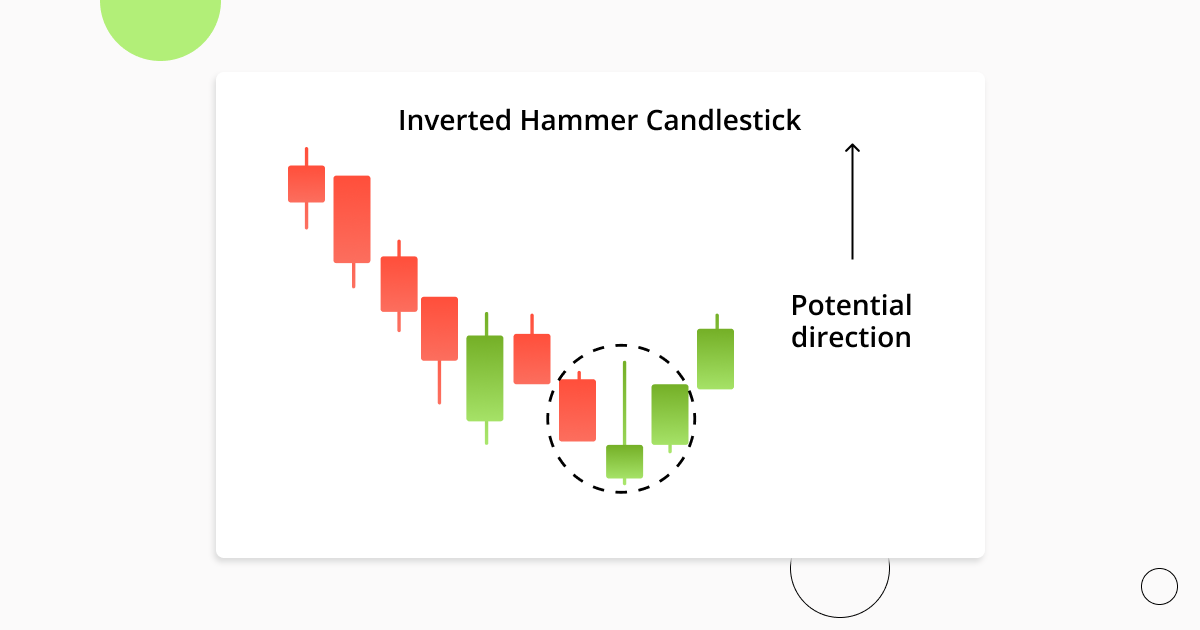
A trader would see the above inverted hammer candlestick pattern or preceding green hammer candlestick and likely feel quite confident in learning bullish and possibly opening a long with a sensible stop loss. Below is an example of how such a trade could be set up using the Good crypto trading app.
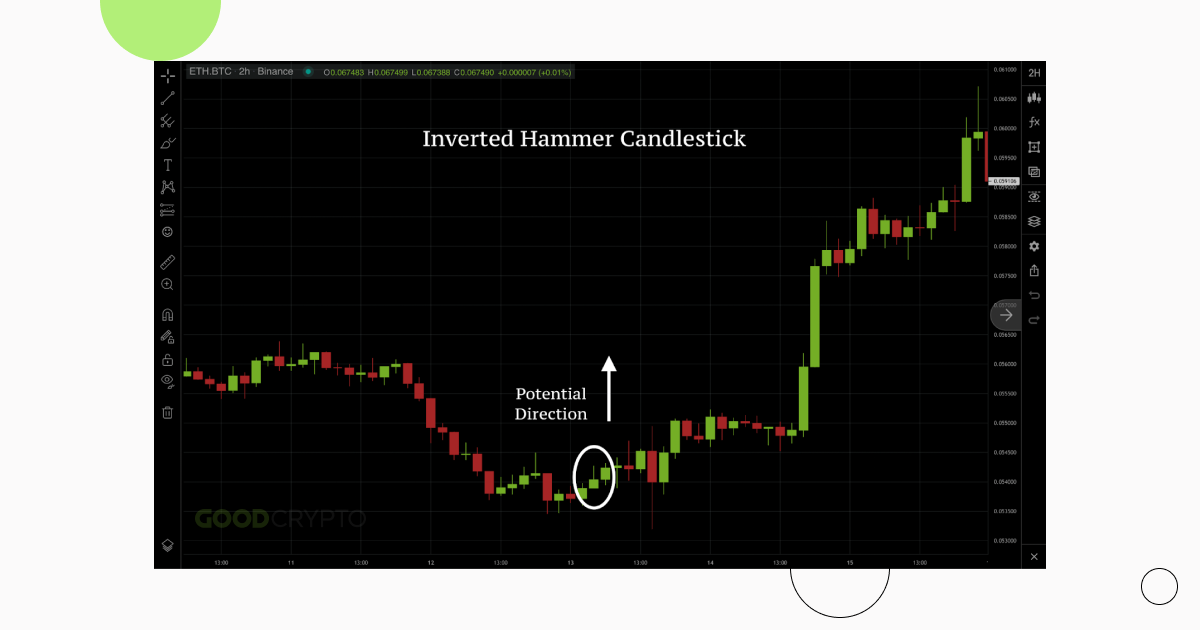
An example of the Inverted Hammer Candlestick Pattern on the GoodCrypto chart.
❗️Mind, as a smart trader, before setting up a position, you should also look for a few more indications of the trend reversal represented by other trading tools: trendlines, technical indicators, like Bollinger Bands, Moving Averages, or Oscillators like RSI and MACD.
As opposed to the previous candlestick pattern, which is formed from one candle, an engulfing candle is actually a combination of two separate candlestick patterns. Traders will see two types of such patterns, either a bullish engulfing, or a bearish engulfing.
An engulfing candlestick pattern is very easy to spot on a chart. It is usually a big candlestick body with very tiny top and bottom wicks. Take a look at an example of a bullish engulfing candle pattern below:
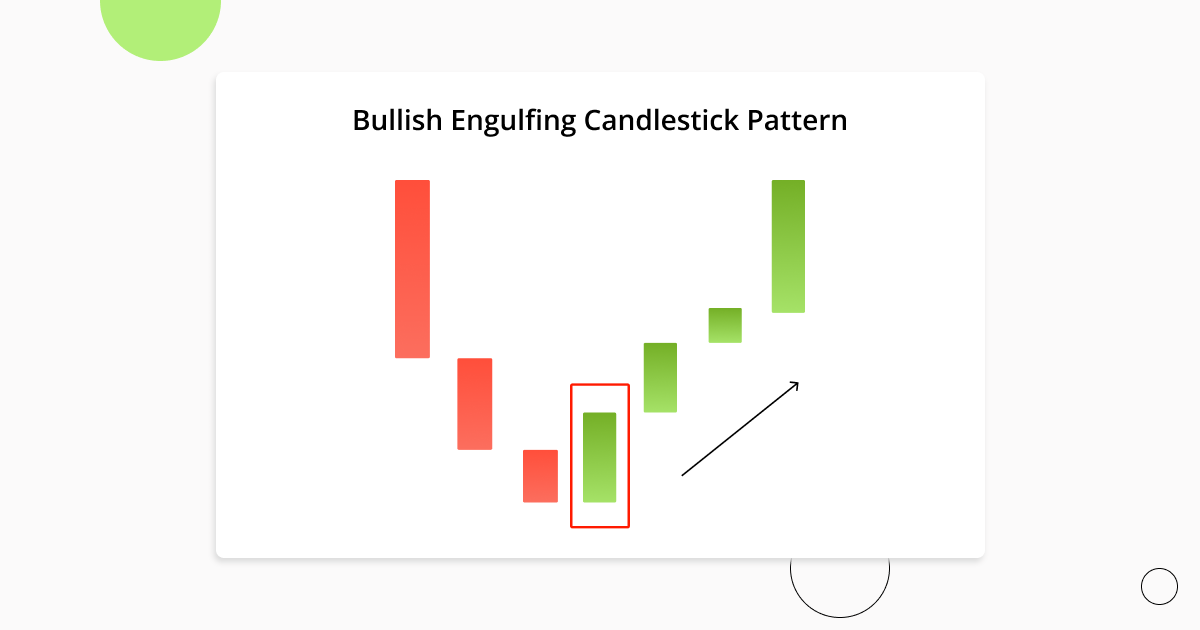
Bullish engulfing candles are typically found at the end of trends and show that bulls have assumed control of a market. As you can see, the bullish engulfing candlestick quite literally consumes the preceding candle in terms of size.
Everything in the exact opposite is true for a bearish engulfing pattern. A red and vicious candle that consumes all of the previous bullishness and reminds traders of gravity.
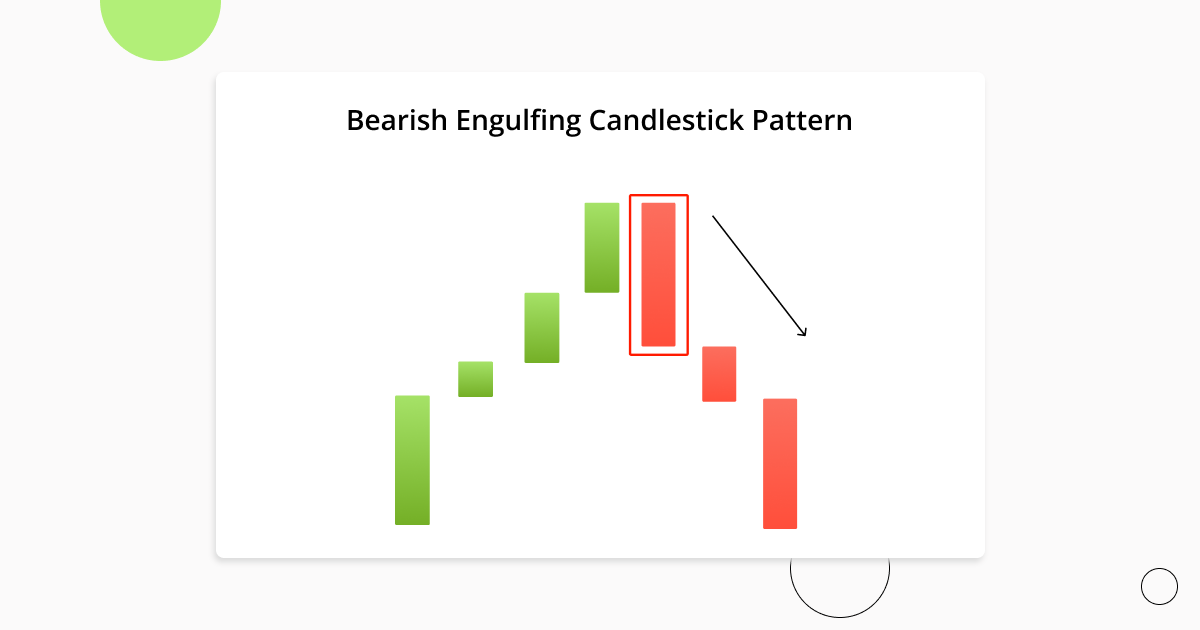
A bearish engulfing candlestick as in the example above would signal to a trader that opening a short position on an asset would be wise due to waning buyer momentum.
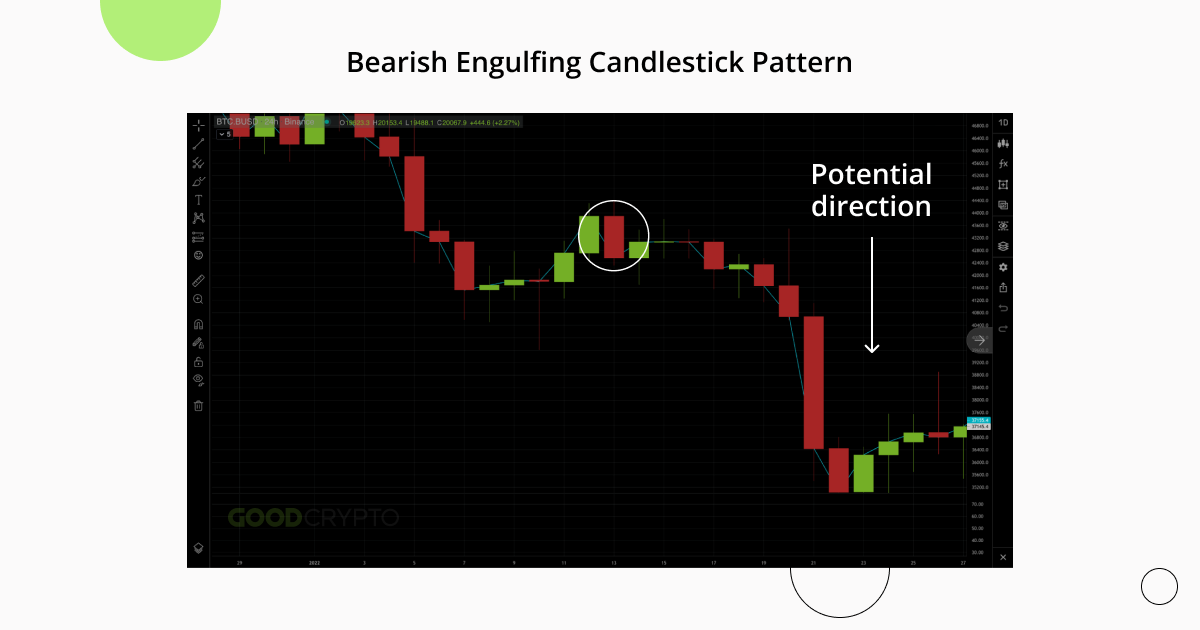
An example of the Bearish Engulfing Candlestick Pattern on the GoodCrypto chart.
The three white soldiers candlestick pattern is a little bit more complicated than the previous ones we covered. It requires more attention to spot and utilize in your pattering trading strategy because three white soldiers require a specific setup.
Although, at first glance, the pattern might just seem like 3 candles that go up consecutively. Context is key here. The three white soldiers candlestick pattern is made after consistent heavy selling.
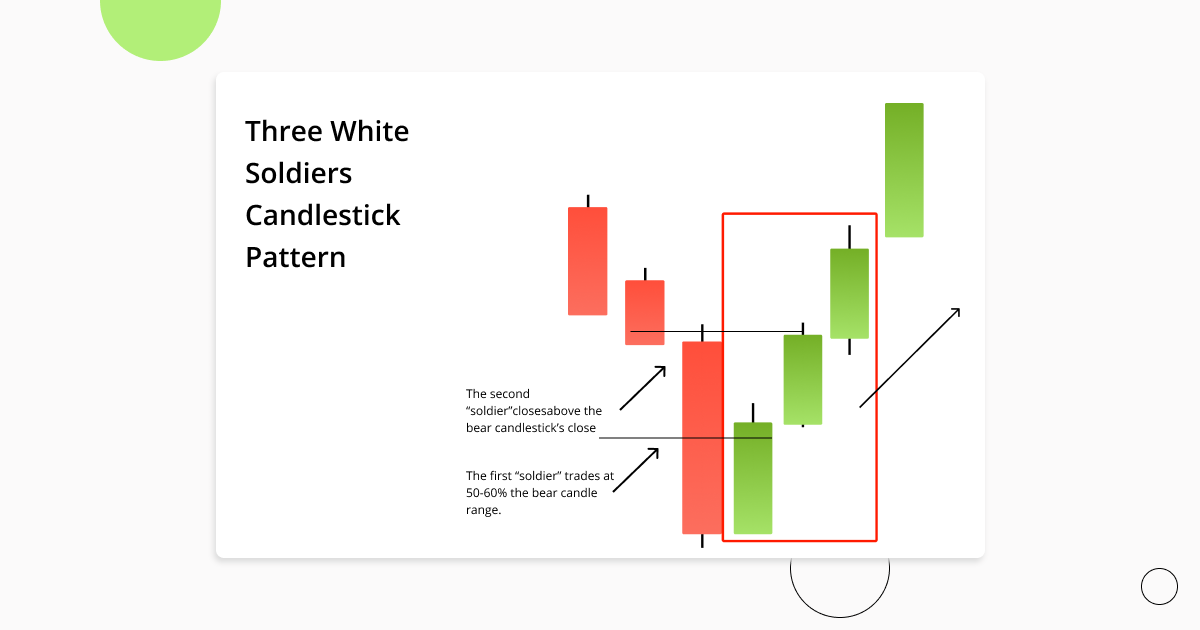
Above is an example of the three white soldiers pattern that marks a shift from a downtrend to an uptrend. Note that the candles become progressively larger too, making higher highs (HH). This is a very bullish and volatile trading pattern, which makes it quite tempting for novice traders to disregard risk management, which is a grave mistake and something that you should definitely have as part of your pattern trading strategy.
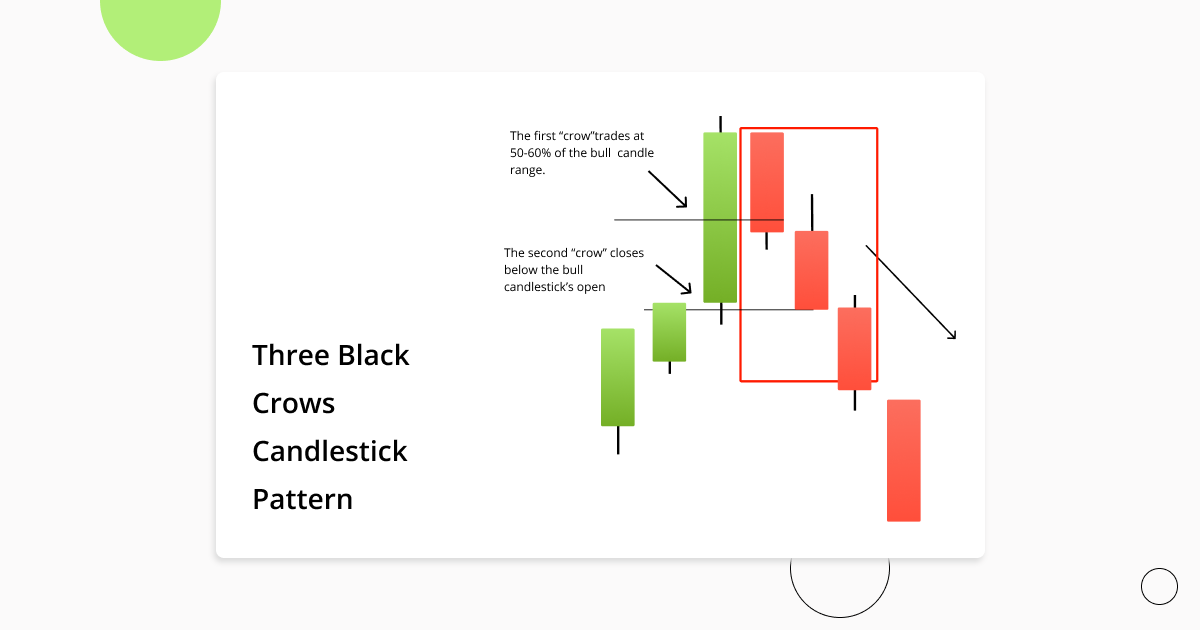
A literal bearish alternative to the previous trading pattern we just covered. The three black crows candlestick pattern consists of three strong black candles known as black crows. Some of these names are quite poetic, aren’t they? This trading pattern has to form after a big push upwards by buyers. Check out this nosedive in the market:
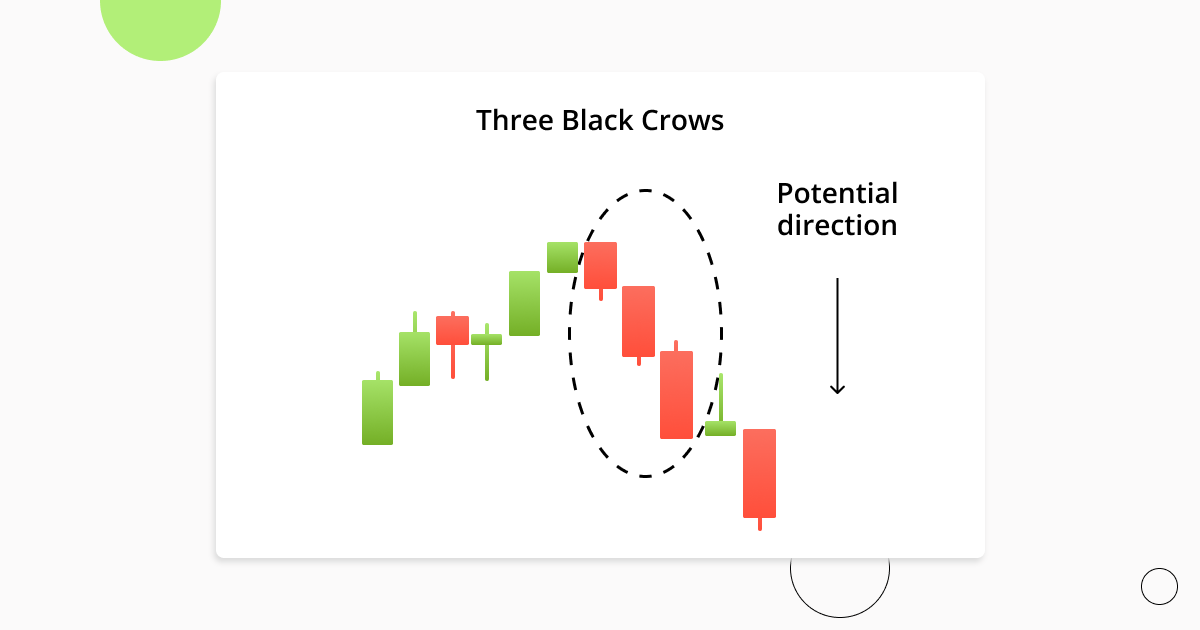
As you’re well able to interpret by now, the above pattern is indicative of sellers seizing control from buyers. Making the three black crows pattern a good short signal. Traders need to watch for the second black crow candle to close below the preceding bullish one. The final crow is around the same size as the one before it and opens at the last bullish candlestick close.
The dark cloud cover candlestick, as you can likely assume from its name, is a bearish chart pattern. It indicates changing momentum to the downside following heavy and active participation by buyers.
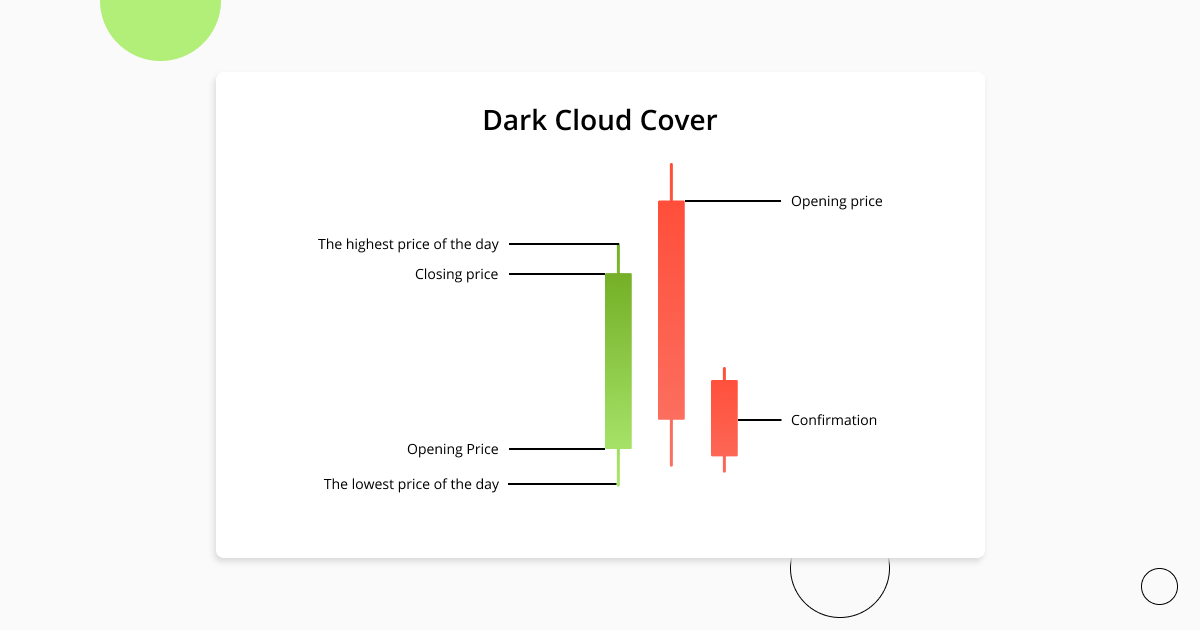
Both candles have to be quite large, as would be the case for candles where there is a lot of participation by traders. The bearish dark cloud cover candle opens higher than the previous bullish candle and closes lower than the midpoint of the bullish candle.
One would confirm this pattern on their crypto chart by being mindful of the candle which forms after the dark cloud cover candle. If it is red, then that acts as confirmation of the full dark cloud cover pattern and is forthcoming of further selling and a great signal to short with confidence. If it is green, then the dark cloud cover candle is not confirmed.
The hanging man candlestick pattern is actually the bearish alternative to the hammer pattern covered just above. It sort of has the same shape but looks like a hanging man because of the small wick that is customary for the hanging man candle trading pattern.
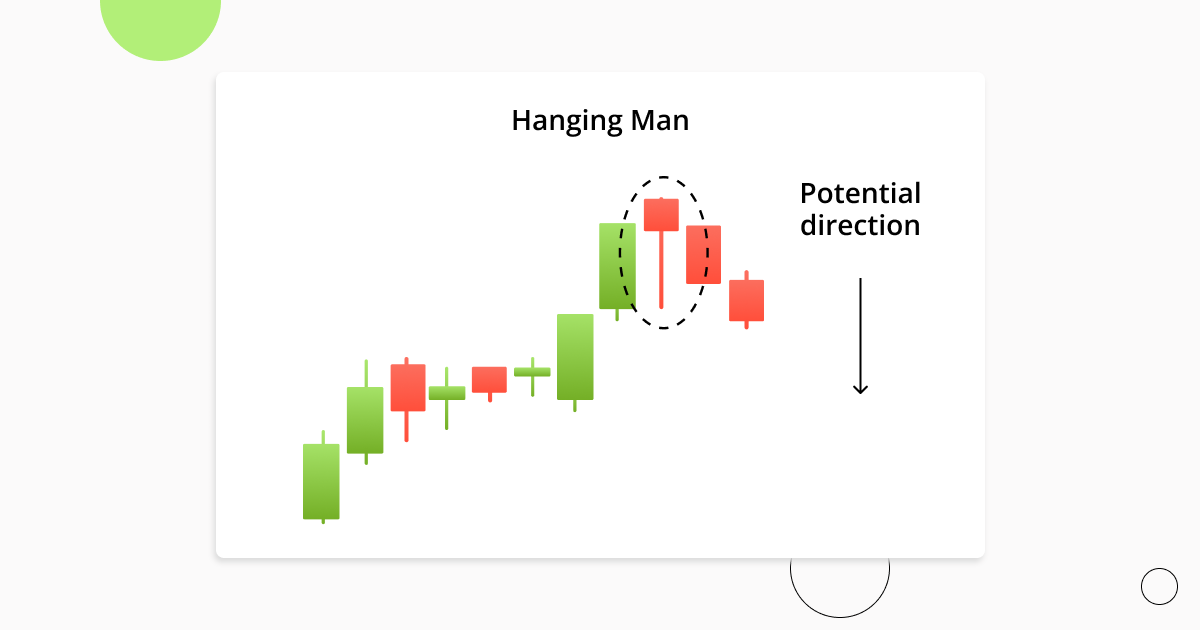
As you can see in the image above, the hanging man candlestick pattern forms at the conclusion of an uptrend. The long bottom wick tells pattern day traders that there was significant selling and that buyers may lose steam for the next couple of days with a bearish continuation.
The spinning top is a candlestick with a very small or short body in between equal bottom and top wicks. The spinning top candle shows that there is indecision in the market and foreshadows a period of possible sideways movement and is typically present when there is indecision in the market.
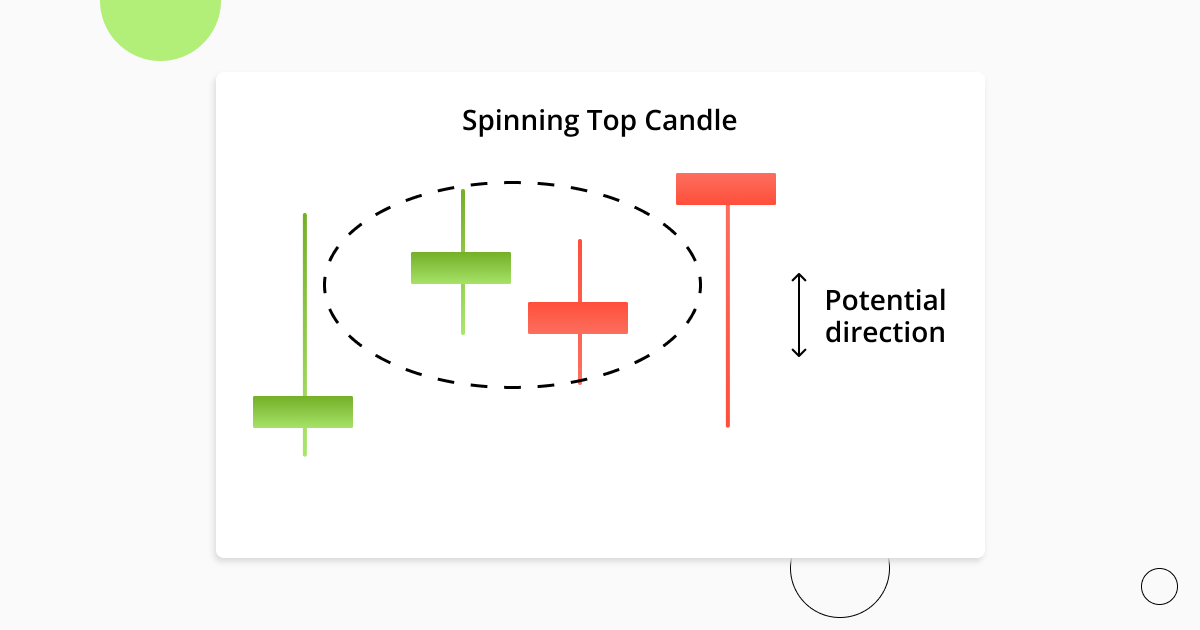
For example, a spinning top after engulfing candle in a typical bullish scenario could mean that price is consolidating before a further move up or that bulls are losing control. One would need to examine the candles following to gain confluence. Whereas a spinning top candle downtrend a price floor is being built via sideways price movement before either bulls or bears step up. The spinning top candle is usually used in conjunction with other chart patterns and technical analysis methods used by pattern day traders because a lot of confirmation is required to enter a profitable trade.
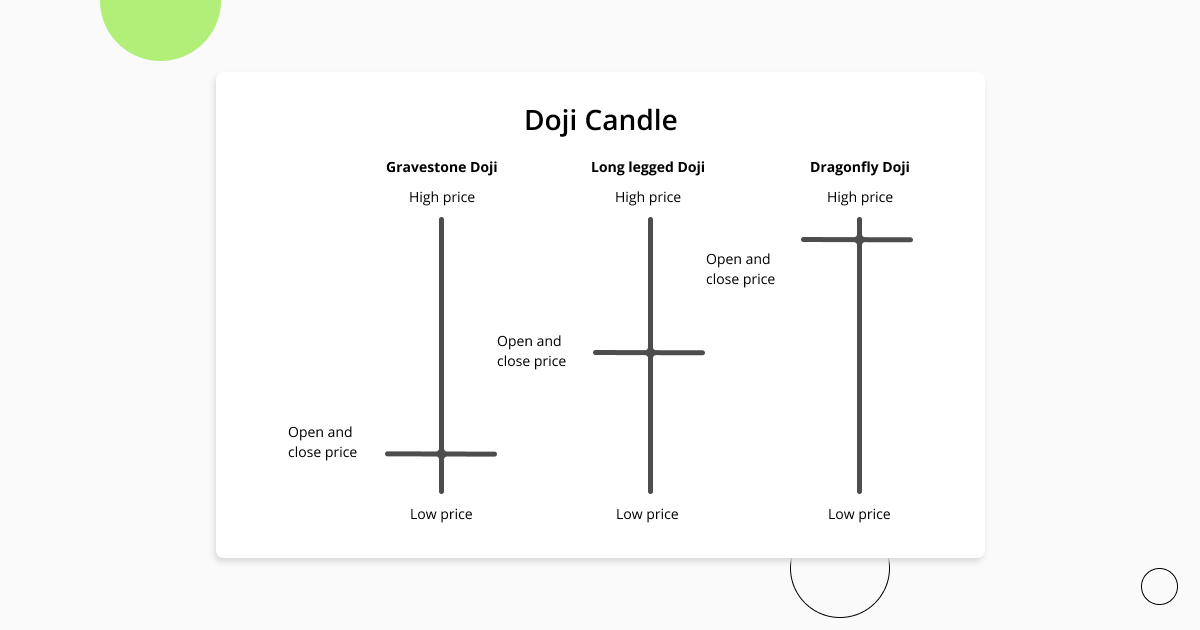
A doji candle is an interesting-looking cross-shaped candle and represents a time frame during which the open and close price of an asset were nearly equal, representing an equal struggle between buyers and sellers. By itself, a doji candle is a neutral candlestick pattern, but it has two major types, that being the dragonfly doji, and the gravestone doji.
The dragonfly doji candle has no body and a very prolonged lower candle which indicates that there was aggressive selling that had to be absorbed by buyers of equal balls.
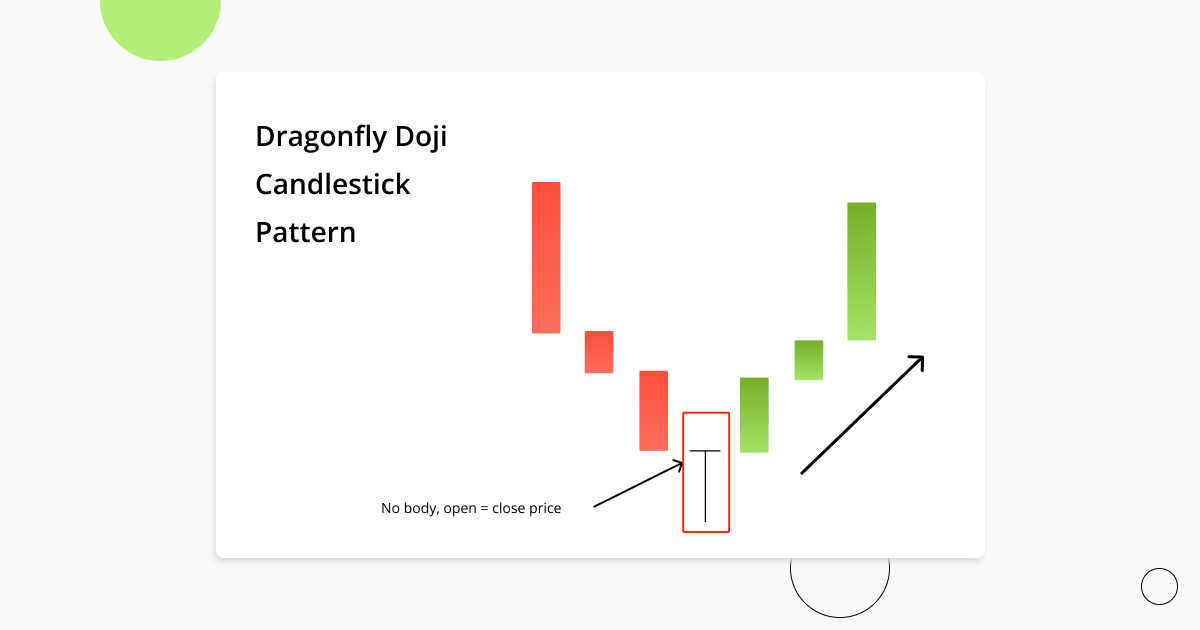
A dragonfly doji in uptrend could signal that it is coming to an end or that a new one is starting if a dragonfly doji at bottom is spotted. Traders frequently use the dragonfly doji candlestick as they would a hammer, but it is suggested to wait for a confirmation candle before entering a trade on this candle.
Gravestone doji… A candlestick with a name that’s straight to the point. As you hopefully guessed, a gravestone doji candle in an uptrend means that the trend is dead! The candlestick has no body and resembles a nail hitting a coffin.
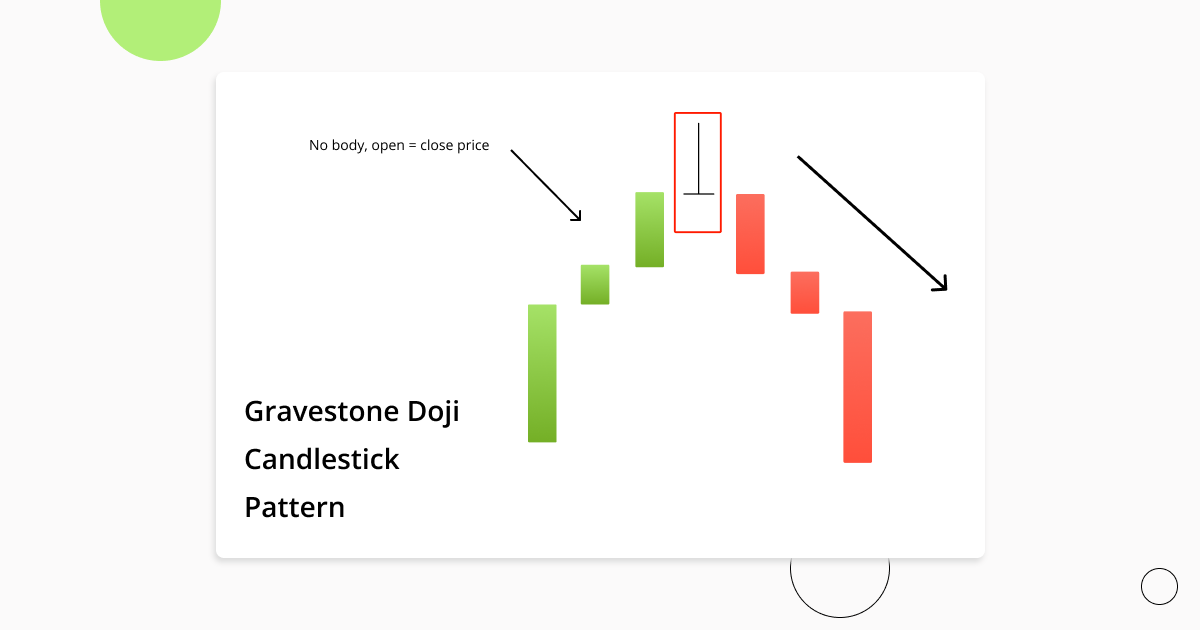
As you can see in the image above, the candle is a clear sign for a pattern day trader that the trend is reversing upon meeting a wall of impassable sellers. Of course, it’s never a bad idea to wait for further candles to receive confirmation that our gravestone doji is bearish. Though traders do typically take profits or enter short positions when a gravestone doji at top is spotted.
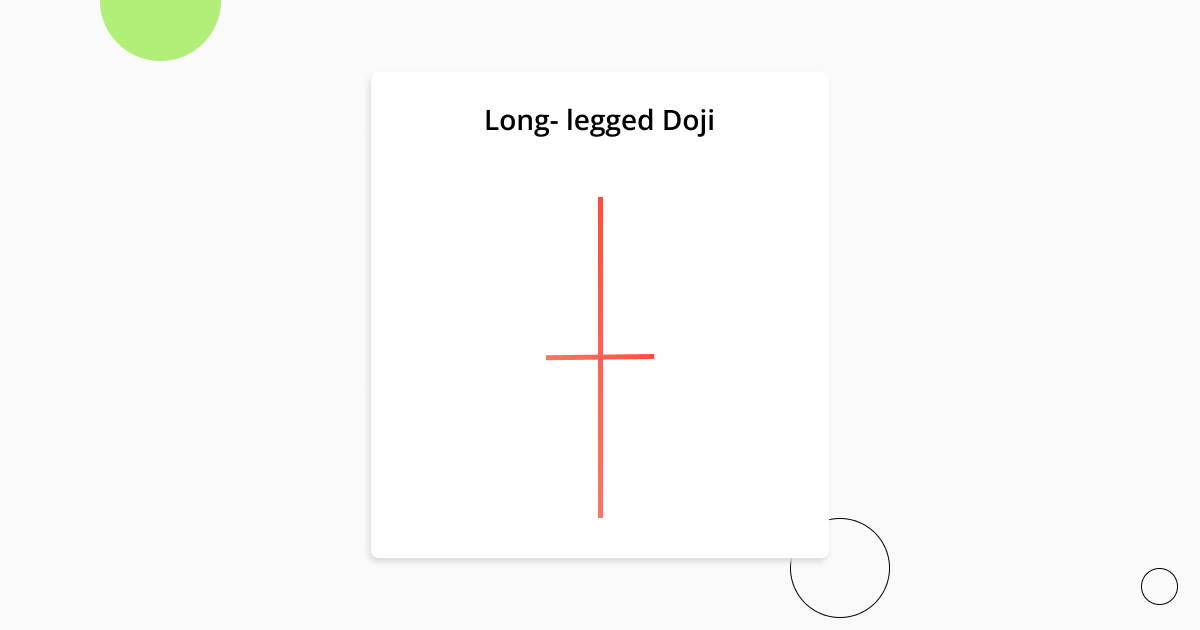
The long-legged doji candle is composed of a long lower and upper shadow. The closing and open prices that go into forming this candle are about the same. It demonstrates that there is indecisiveness amongst market participants and occurs after a heavy advance or decline in price. Traders usually wait and see what type of price action forms following a long-legged doji candlestick. It often marks the start of a consolidation period.
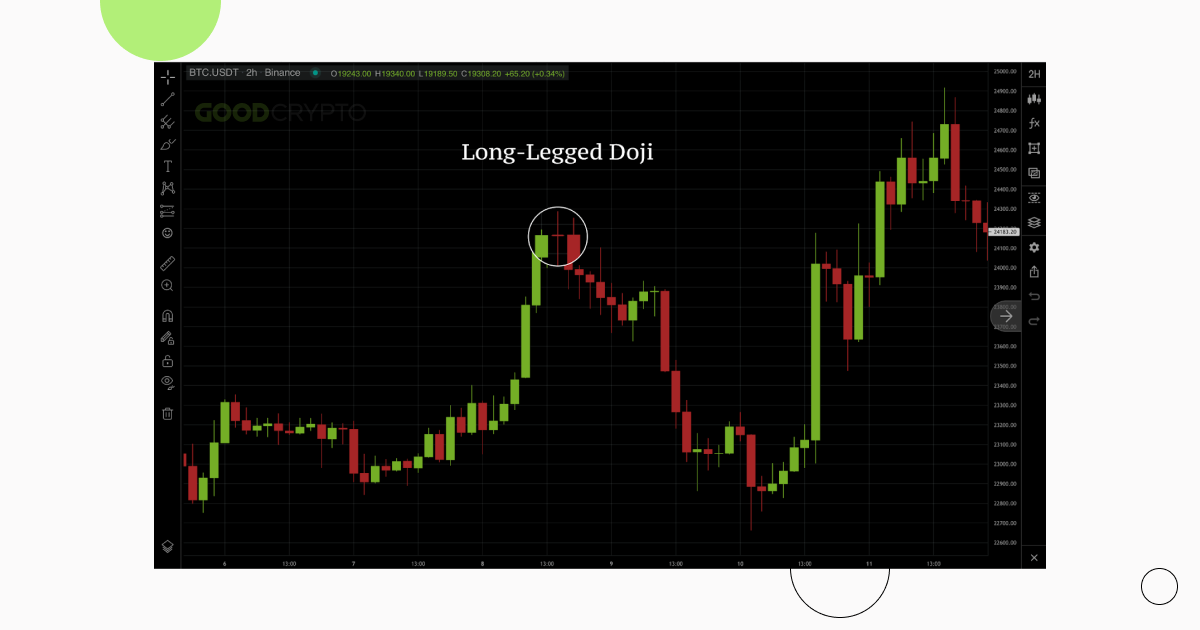
An example of the Long-legged Doji on the GoodCrypto chart.
The shooting star chart pattern looks like an upside-down hammer. Therefore, the shooting star candlestick pattern essentially means that the price of an asset is about to get hammered down in a reversal by aggressive sellers.
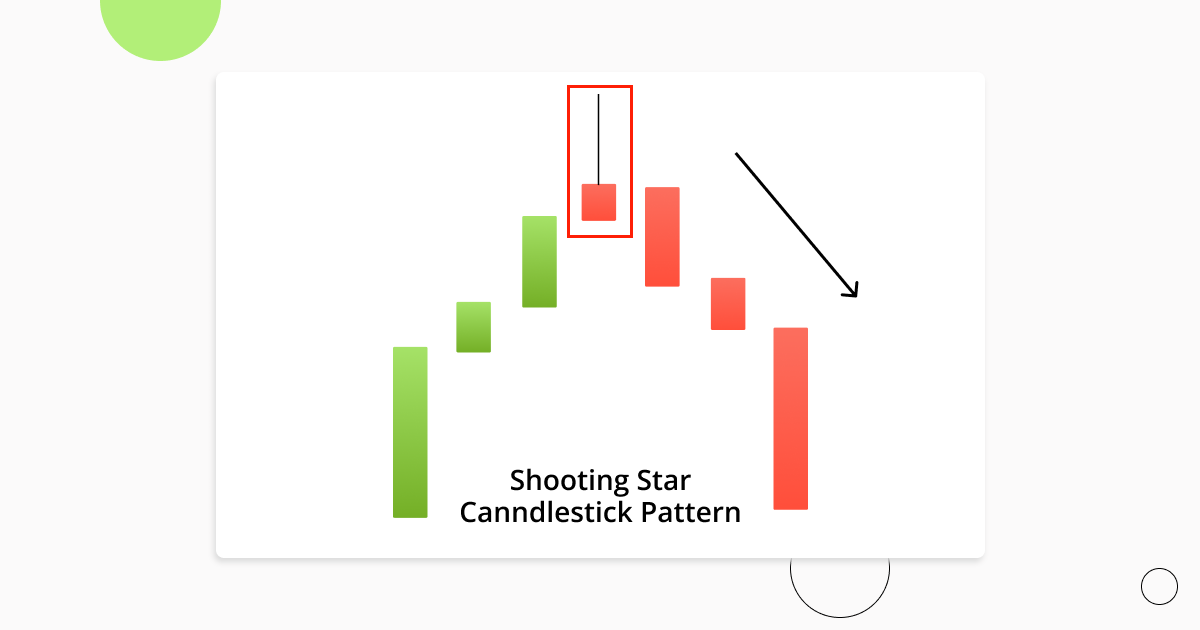
When this trading pattern appears, it often forms a resistance level at the top of an uptrend. Despite the name, it’s quite a devastating candle. However, the next one we’re about to cover provides some bullish hope.
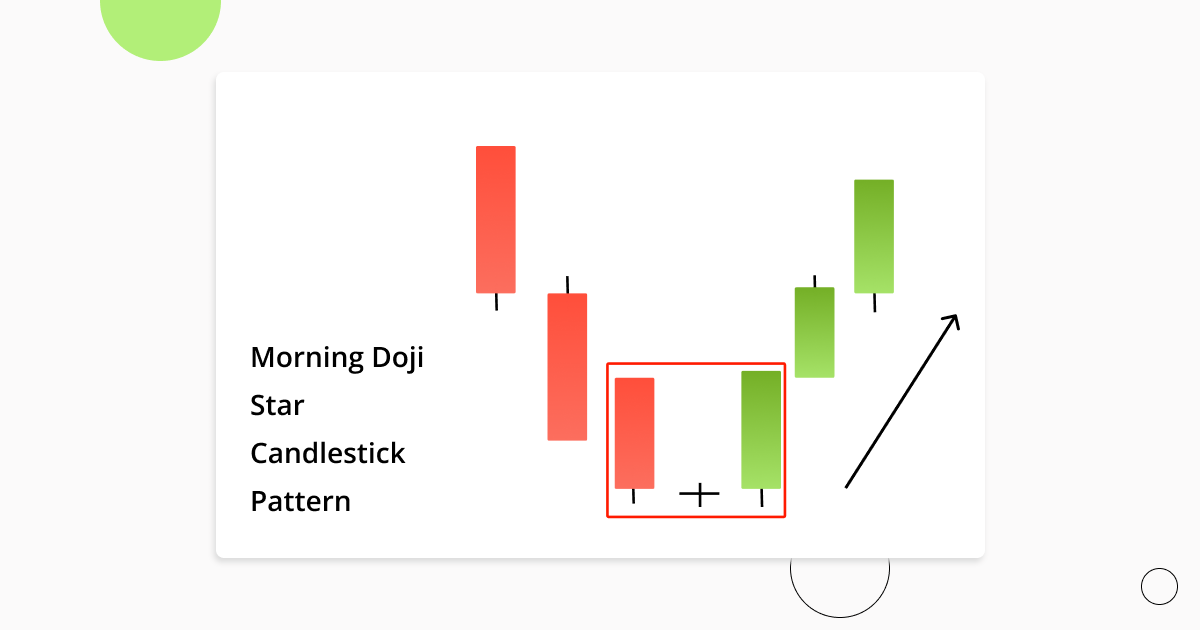
The morning star candle pattern consists of 3 candlestick and tells traders a story of changing momentum in a bleak down-trending market. The morning star candlestick reversal pattern first starts off with a candle forming by dominant sellers, then goes from neither buy or sell side being dominant, represented by the morning star candle with a near non-existent body, to buyers prevailing in outbidding sellers across two time periods. Effectively signaling that a bullish market is soon to commence. Actually, when looking at this pattern in a chart, one can see that it is a combination of the hammer, engulfing, and doji.
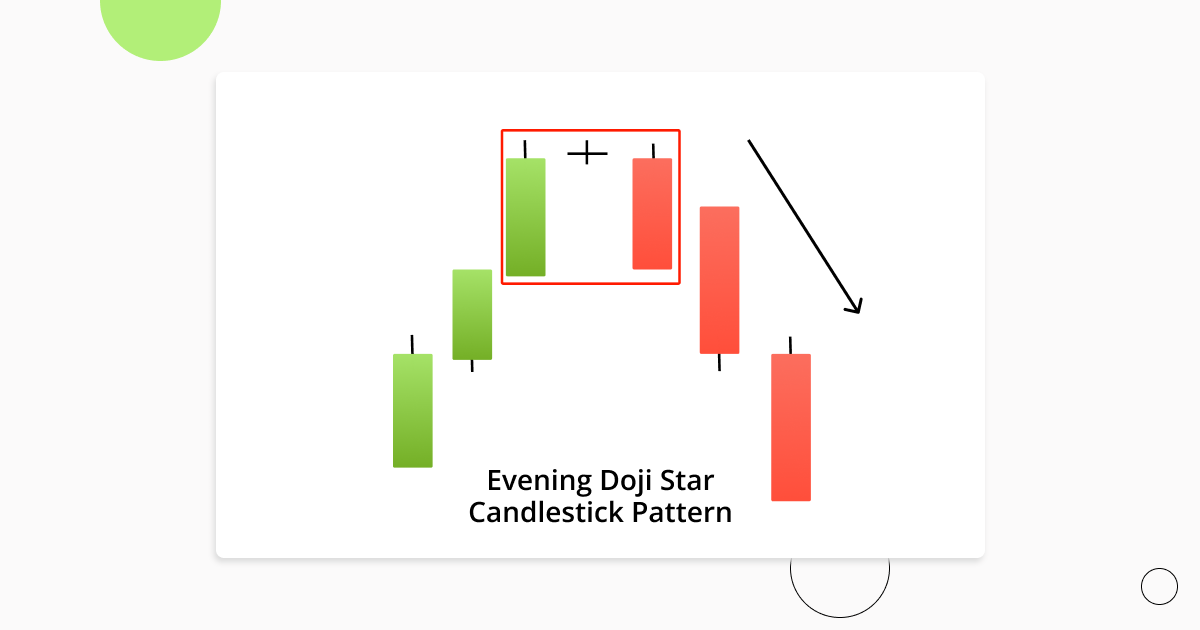
The evening star candlestick pattern is a mirror opposite of the previous trading pattern and appears at the completion of an assets uptrend and a prime time to enter shorts as buyers become exhausted. The important thing to keep in mind when spotting the evening star candlestick is that it must be tiny in comparison to the buy and sell candles that accompany it.
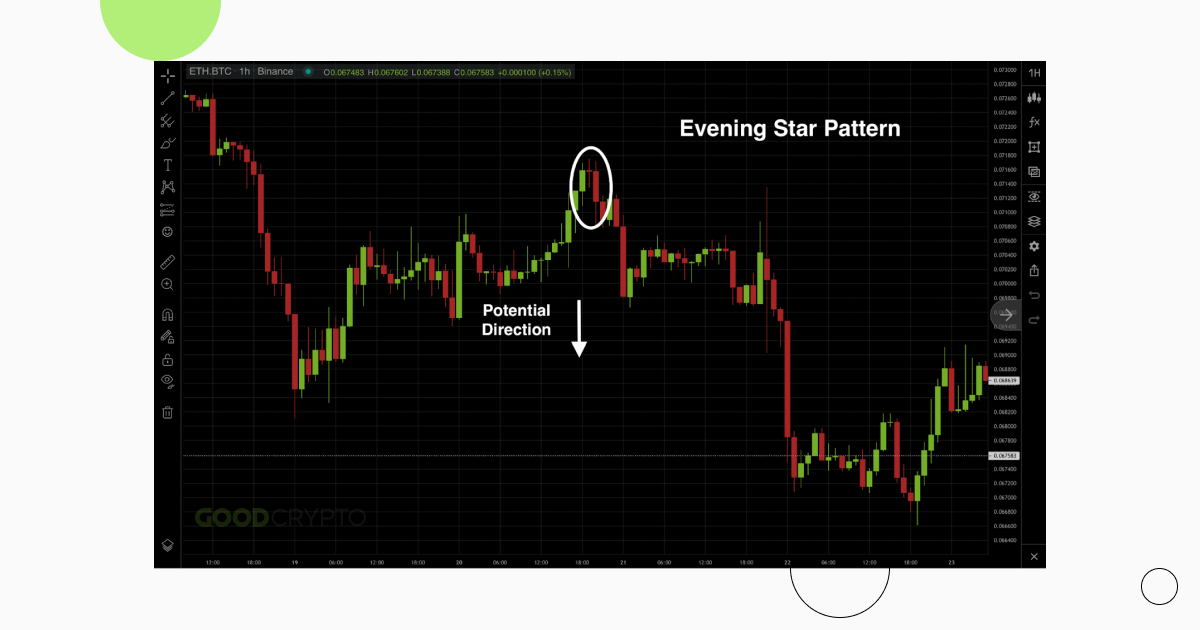
An example of the Evening Star Candlestick Pattern on the GoodCrypto chart.
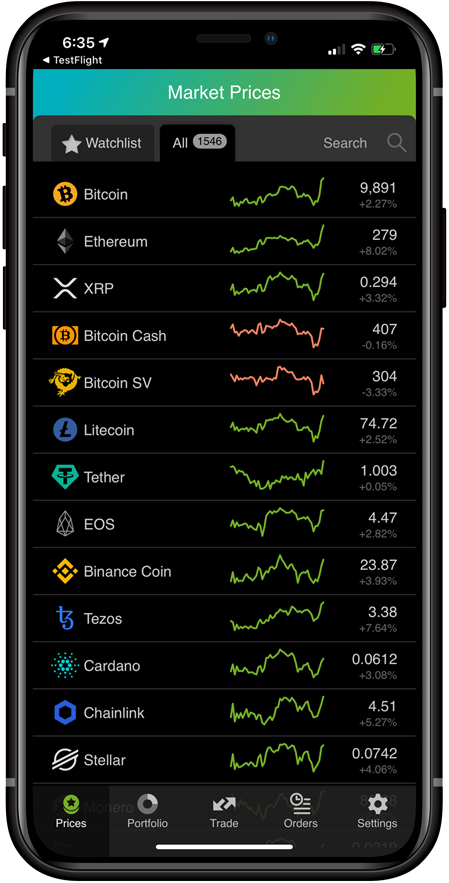
As you already noticed through reading the previous part of our Chart Patterns article series, finding, charting, and placing trades using the Good Crypto app is convenient and very easy. In addition to that, the app allows traders to connect all of their exchange accounts and various blockchain wallets in order to be able to easily access and trade one’s assets on the go.
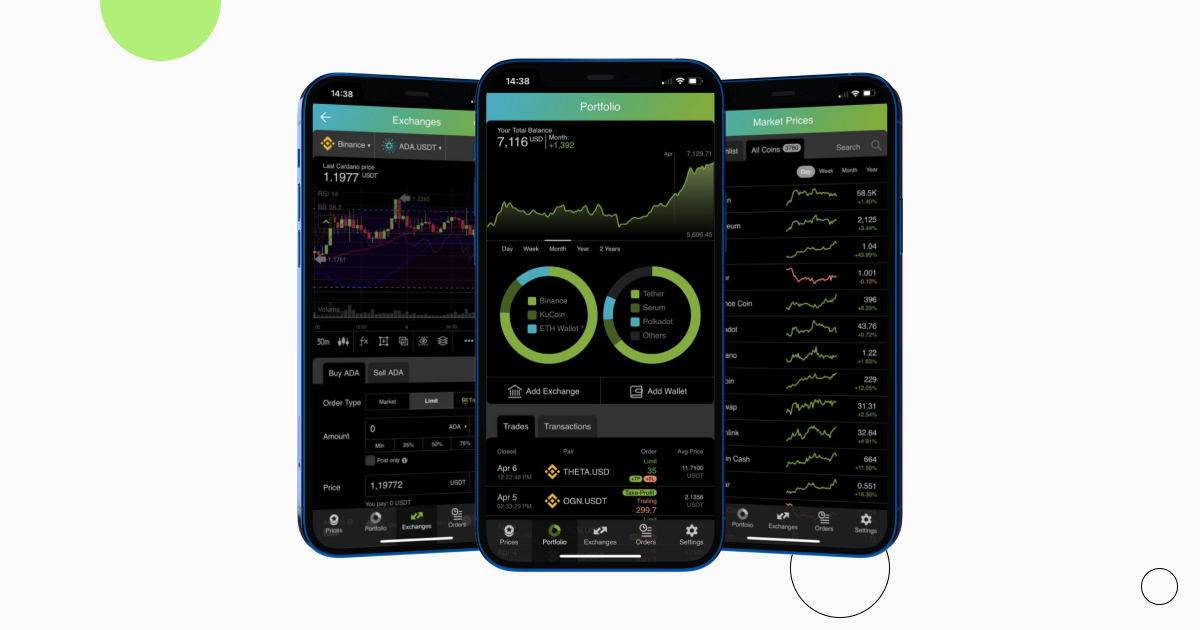
A huge part of being a successful trader, even if you’re a master at spotting chart patterns, is to stay on top of your trades and monitor them. And as you’ll come to know, the cryptocurrency market can move quite fast and be very volatile. Which is why the Good Crypto app lets you receive price notifications, daily market updates, alerts of new cryptocurrencies, and about strong moves in the market so that you can always stay on top of your trades. It supports over 5,000 cryptocurrencies and 10,000 trading pairs on 35 crypto exchanges in real time. The app also provides an unlimited amount of technical indicators and automated signals based on them, which you can use for better charting and spotting candlestick patterns.
That said, our app is more than just a simple charting tool. In addition to providing you everything you would even need for drawing chart patterns and setting up your strategy, you will be able to:
All in all, our GoodCrypto app is the perfect package deal that will give you an edge in this highly competitive market.
Being able to spot candlestick patterns and execute them is a vital skill that anyone who refers to themself as a trader must have. Without having an understanding of the crypto chart patterns – you’ll simply be destroyed! We suggest checking out various of our other articles on trading strategies to further boost your pattern trading skills and increase your chances of success. We hope you enjoyed this educational piece! Use it as a sort of encyclopedia of chart patterns to help you squeeze tons of cash out of the market. Peace out!


Share this post:
October 18, 2022

We’re proud to be the first to launch a DCA bot for DEXs! Enjoy the same DCA trading experience you’re used to on CEXs but with no technical limitations.

Discover the power of MEXC with GoodCrypto! Advanced tools like bots, trailing stops, and smart TA signals and TradingView webhooks at your fingertips.

Dollar Cost Averaging (DCA) bot has become an increasingly popular trading tool due to its convenience, the versatility of its modes, and trading efficiency....

Dollar Cost Averaging (DCA) bot has become an increasingly popular trading tool due to its convenience, the versatility of its modes, and trading efficiency....