
Introduction
The crypto market is very volatile, but with the right tools, traders can make the most of the opportunities therein. The 13 best indicators for crypto trading discussed in this post provide the perfect tools for all types of traders. No matter the category you fall into, as a day or swing trader, proper use of these indicators can protect you from losses and help you to make some profit.
The best indicators to use for cryptocurrency trading depend on your trading habits. For a day trader, indicators that react quickly to market conditions are more suitable, while slower-moving indicators are the best fit for swing traders. However, a combination of a set of crypto indicators results in a trading system. A good trading system is something that any cryptocurrency trader needs to be successful.
In this article, we will list and explain the 13 best indicators for crypto trading and their variations. We will also help you to figure out how to combine different crypto indicators to create a trading system that will guarantee a successful cryptocurrency trading experience.
What are Trading Indicators?
Trading indicators are tools that use a collection of mathematical computations and chart patterns that assist traders spot possible trading opportunities in the crypto market by using price and/or volume data. These indicators help traders make informed trading decisions about buying or selling assets by revealing market trends, momentum, and probable price reversals.
Different formulas and algorithms are used by trading indicators to assess market data and provide indications. These indications can pinpoint future price reversals, and spot trends, and provide trading entry and exit points. To make trading judgments and develop a more thorough grasp of market circumstances, traders frequently combine indicators.
Types of Crypto Trading Indicators
Traders frequently use various kinds of trading indicators:
- Trend indicators: These indicators aid in determining the market trend’s direction. The Ichimoku Cloud, trendlines, and Moving Averages are a few examples of trend indicators.
- Momentum indicators are tools for assessing the force of market changes and spotting probable price reversals. For example, the Relative Strength Index (RSI), Stochastic Oscillator (SO), and Moving Average Convergence Divergence (MACD)
- Volatility indicators: These indicators aid traders in determining the degree of market volatility such as Bollinger Bands (BB).
- Volume indicators: These tools aid traders in determining the number of deals taking place in the market. On-Balance Volume (OBV) can be helpful with that.
- Oscillators: These indicators swing back and forth between two extreme values, giving information about expected market swings Average Directional Index (ADX) is a great example of an oscillator.
Moving Averages (MA) Indicator Overview
The first indicator that we will consider in this category is the Moving Average (MA). There are several kinds of moving averages, with each of them serving a specific purpose for analyzing the market. We shall explain the types of moving averages further down in this post. But first, let us define what is a moving average and how to apply it to cryptocurrency trading.
A moving average indicator is the average price of a given market pair during a certain period, relative to the position of the price at any given time. It is dynamic and is used to predict the direction of the market, and the sentiment of the majority of traders. Therefore, it is a tool that helps you see through the chaos to understand which way the majority of traders are going. It is designed to help you stay with the winning team.
A moving average might not help you in the identification of a new trend. However, it will help you find already established trends. The kind of moving average to use is usually determined by the timeframe that you are working with. Shorter timeframes (for day traders) will require faster moving averages like MA 9, while longer time frames (for swing traders) will require slower moving averages like MA 200.
How to use the Moving Averages indicator?
As mentioned above, a moving average is used to confirm an already-established trend. This should be the first step in your cryptocurrency trading analysis. Therefore, when the price of a particular cryptocurrency is above the moving average, what you are expected to do as a trader is to look out for opportunities to “buy” the cryptocurrency. On the contrary, when the price is below the moving average line, you look out for opportunities to “sell.”
The moving average is like the billboard that welcomes you to town before you start looking out for street pointers that would lead you to your final destination. The moving average can also serve as support in an uptrend or resistance during a downtrend. Therefore, you can use the points where the price touches the moving average as a good place to buy or sell, depending on the direction of the market.
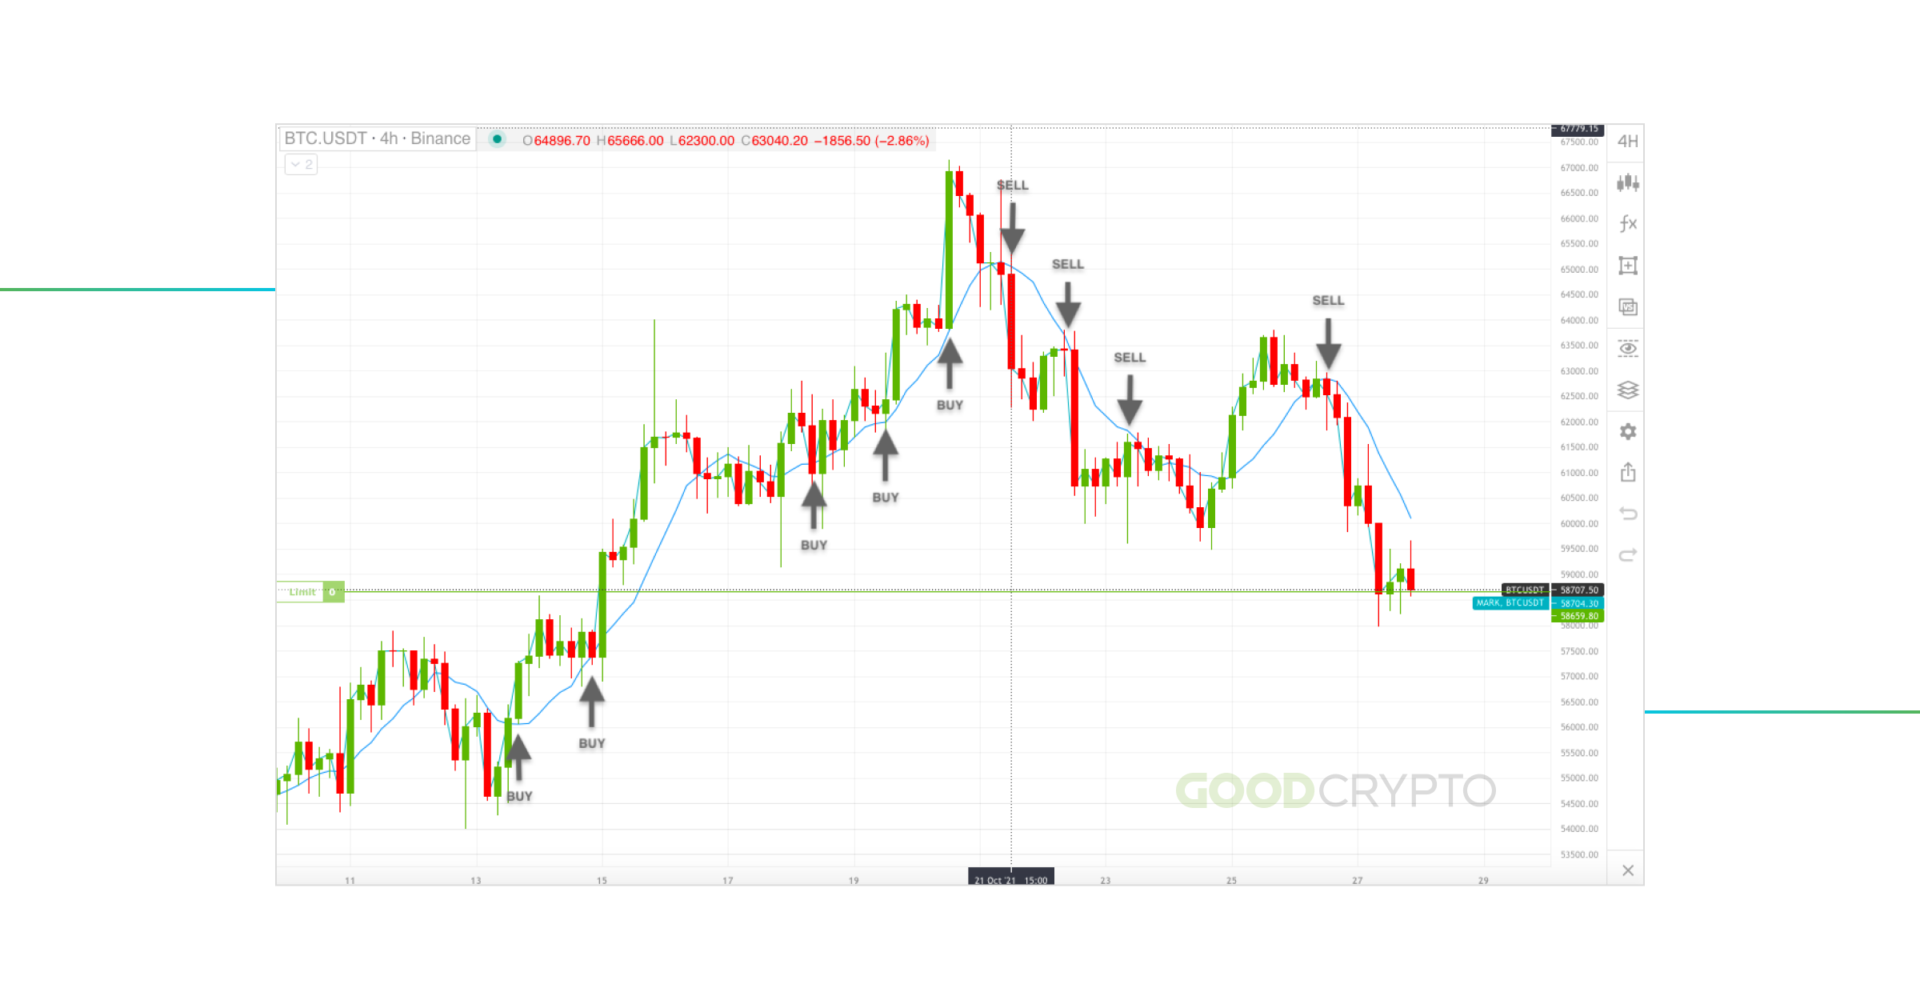
A diagram showing how to identify ‘buy’ and ‘sell’ signals using the Moving Average Indicator
Main Types of Moving Averages
There are different types of moving averages depending on how they are calculated. These moving averages are also suitable for different timeframes, but they are the most effective when deployed in a combination.
Simple Moving Average (SMA)
First, let’s answer the question: what does SMA mean? The Simple Moving Average, SMA means an addition of the closing prices over a recent period on a particular time frame, divided by the total number of periods. For example, a simple moving average trading strategy can be deployed on the 4-hour chart by summing up the closing prices of 24-hour candles and dividing it by the number 20. Out of the 13 best indicators for crypto, simple moving average forecasting is the most commonly used tool for trend determination.
Smoothed Moving Average (SMMA)
The Smoothed Moving Average (SMMA) is a more complex tool than SMA. This particular cryptocurrency indicator makes trend analysis a bit narrower. While SMA sums only the closing prices in a recent period, the SMMA indicator goes a step further and includes more historical data. This addition helps to filter out the noise in the market, thereby eliminating short-term fluctuations that could lead to false signals.
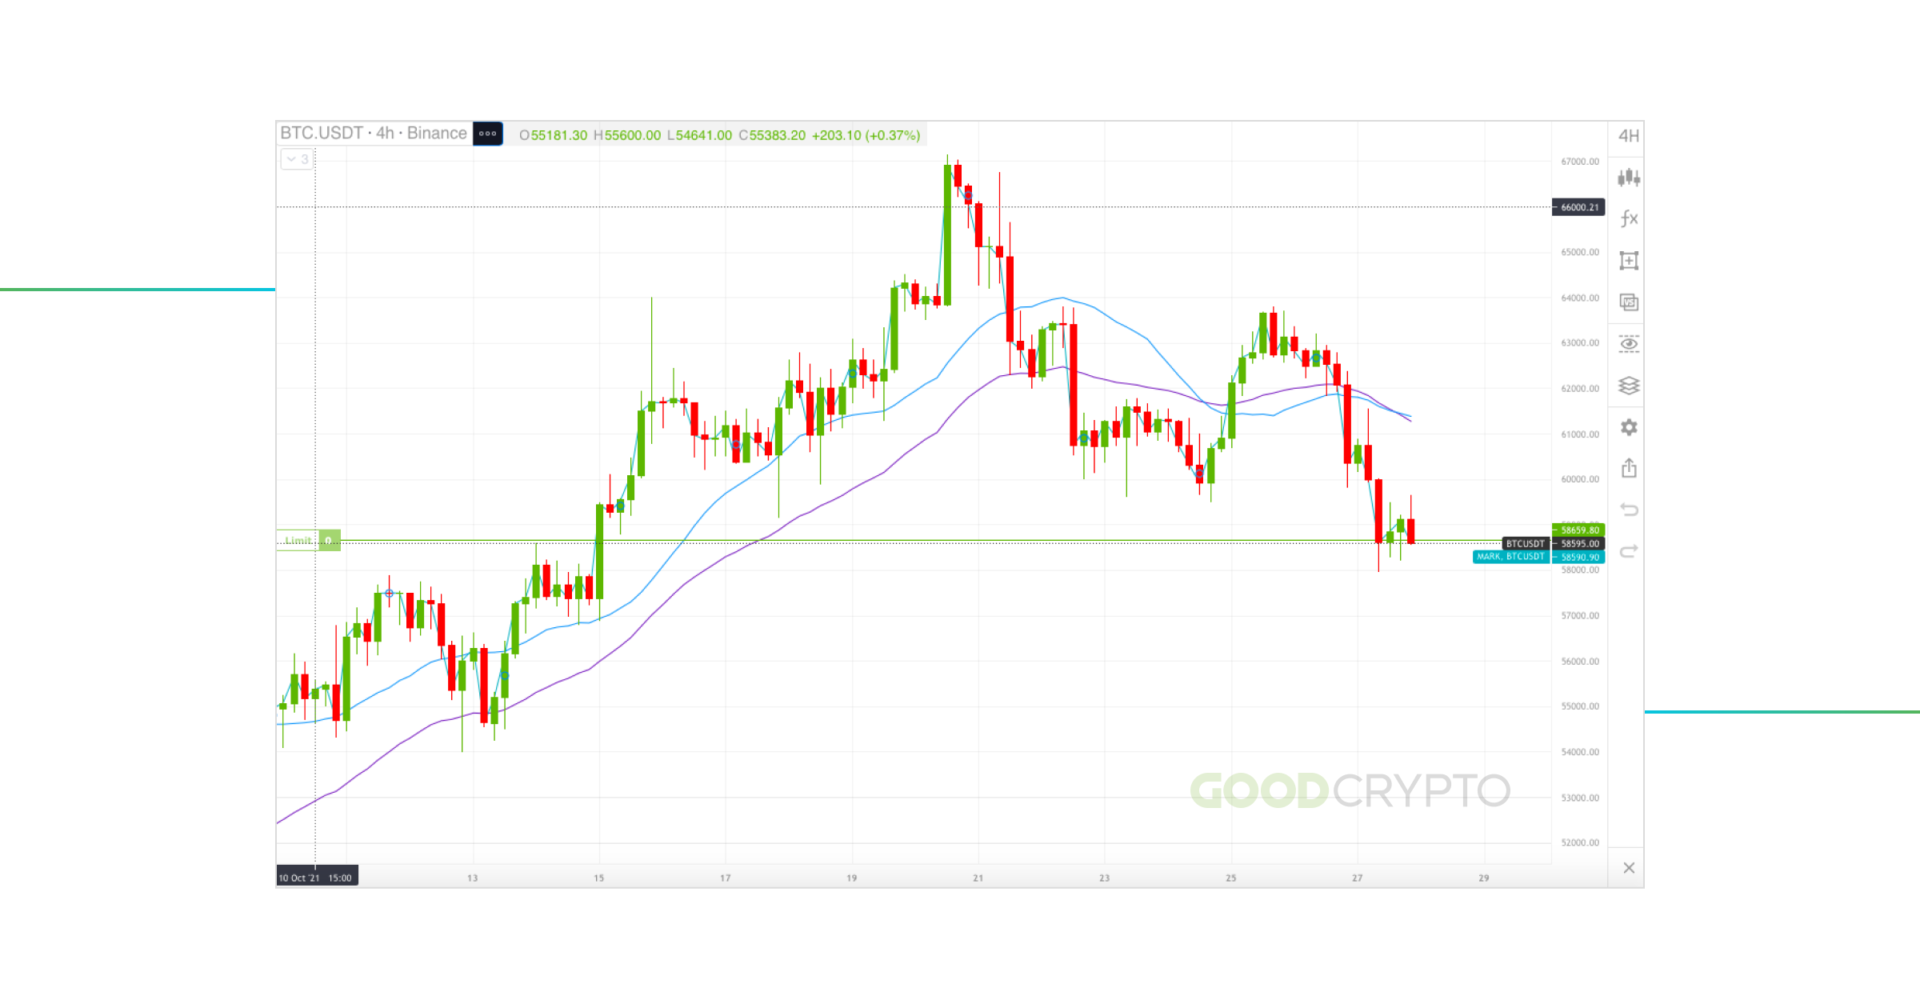
The 20 SMA is the blue line on the body of the chart, while the 20 SMMA is the purple line on the body of the chart
Exponential Moving Average (EMA)
Another kind of moving average indicator is the Exponential Moving Average (EMA). Now let’s answer a simple question: what does EMA mean?
If you are a day trader, then the EMA indicator might just be the perfect tool for analyzing the market. The calculation of the best ema for Bitcoin involves summing up both recent and historical data, just like the SMMA. The difference here is that priority is given to the recent data within the time frame under consideration. Therefore, the EMA trendline is useful when you need to make quick decisions during cryptocurrency trading.
Weighted Moving Average (WMA)
The last type of moving average is the Weighted Moving Average (WMA). This is another cryptocurrency indicator that is suitable for short-term trading. Weighted moving average forecasting can be used to make decisions on when to enter a trade. How to calculate weighted moving average? It signifies using both recent and historical data. However, a multiplier introduced in the weighted moving average formula makes progressive prioritization of data from historical to the most recent periods. It is another ideal tool for day traders that can be used in combination with other moving averages.
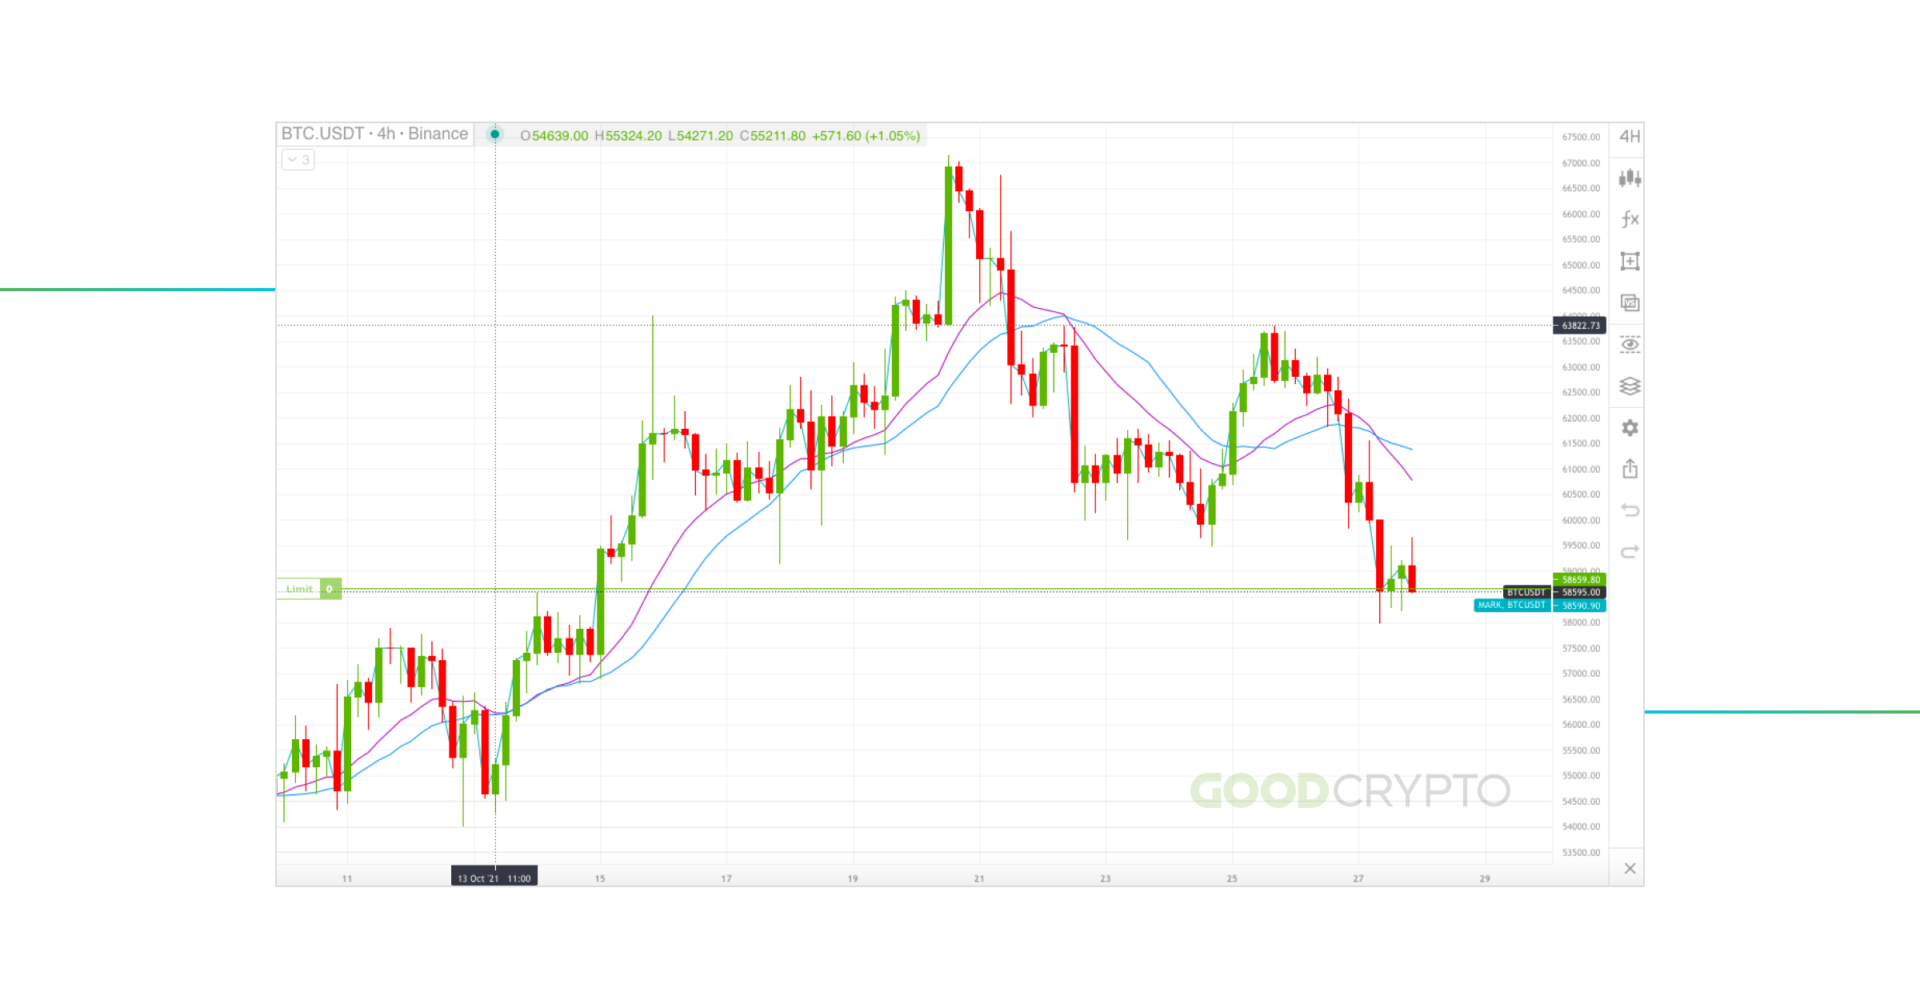
The 20 SMA is the blue line on the body of the chart, while the 20 WMA is the purple line on the body of the chart.
Simple vs Exponential Moving Average (SMA vs EMA)
Out of the 13 best indicators for crypto, the SMA and EMA form the most popular combination for cryptocurrency traders. The SMA provides a wider spectrum that you can use to know the dominant market sentiment, while the EMA can be used to determine how much momentum is remaining in the trend. This is one of the most classic cryptocurrency indicator pairings that is being used. It is the starting point for many traders before adding more tools for analysis from our 13 best indicators for crypto.
The 20 SMA is the blue line on the body of the chart, while the 20 EMA is the purple line on the body of the chart
Other moving average indicators that can be used to support the ones mentioned above include the moving average trendline, and the moving average ribbon. The moving average trendline removes the noise by smoothing out the fluctuations in data, thereby showing trends more clearly. You can use it to determine the strength of a trend by considering the distance between the moving averages, or to figure out key support areas by looking at the price in relation to the ribbon.
The moving average ribbon is a series of moving averages (MA) of different lengths that are plotted on the same chart to create a ribbon-like indicator.
Anyway, Moving Averages continue to be one of the most popular technical trading indicators and a crucial tool for crypto trading. Traders may continue to experiment with various Moving Averages and their combinations as new cryptocurrencies appear and the market changes in order to determine the best strategy for market analysis.
Read the full article about Moving Averages here. And if you feel like this is way too easy, here is our complete guide about Advanced Moving Averages: SMMA, AMA, LWMA, DEMA, TEMA.
Moving Average Convergence / Divergence (MACD) Indicator Overview
What is MACD?
The MACD is a more complex crypto indicator that can be interpreted in various ways. It is a useful indicator for all types of traders and can be deployed in any time frame.
What does MACD stand for?
The full meaning of MACD is Moving Average Convergence / Divergence. Three components make up the MACD indicator. They are the MACD oscillator, the signal line, and the MACD histogram.
How to read MACD indicator?
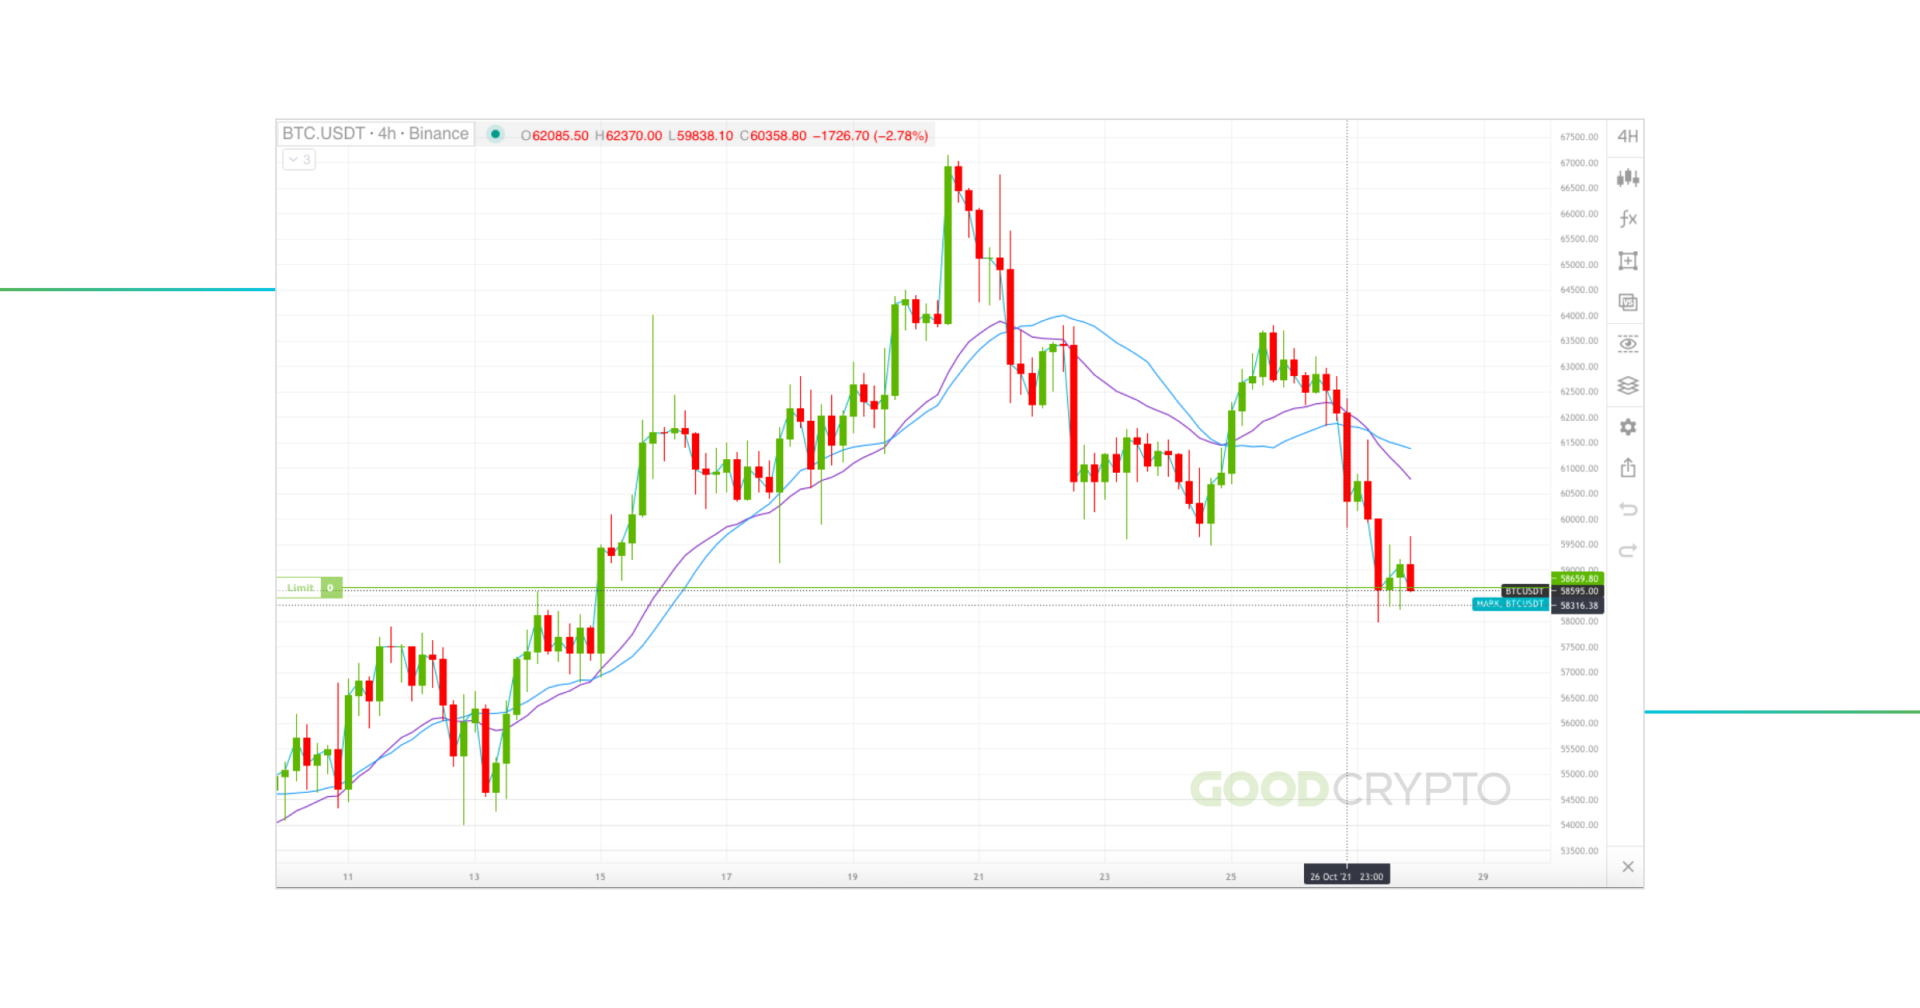
When the MACD line (the faster line) crosses the MACD signal line (the slower line), it indicates that a new trend has begun. At the crossover point, the histogram is at “0”, which is its midpoint. As the trend becomes more established, the gap between the lines increases, and so do the histogram lines. The gap between the line becomes narrower, and the height of the histogram diminishes when the trend begins to lose momentum, indicating that a reversal might be close.
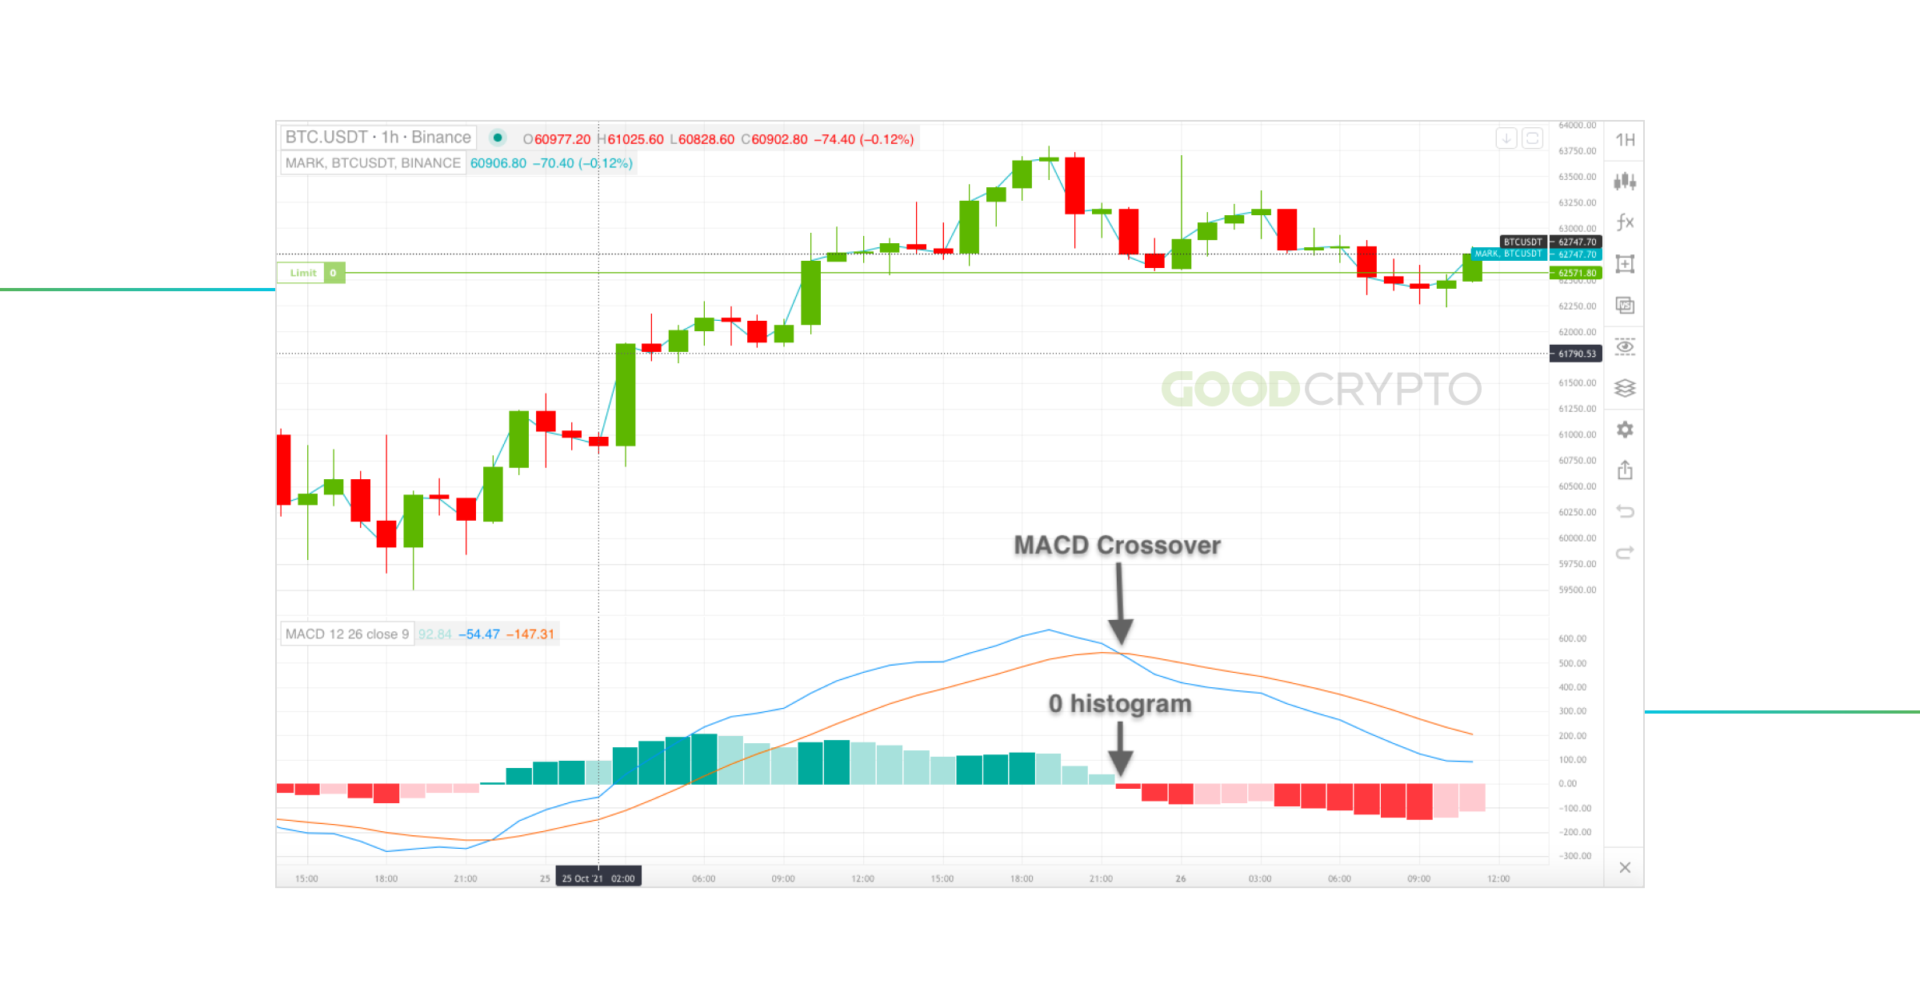
As the MACD lines cross over each other, the histogram value is at “0”
How to use MACD in your trading strategy?
An interesting strategy that is used to deploy MACD is gauging the divergence between the graphic representation of MACD and the bars on the price chart. Therefore, rather than waiting for the MACD crossover, which is usually a lagging indicator, this pattern of divergence trading provides early signals for traders to catch trends in time.
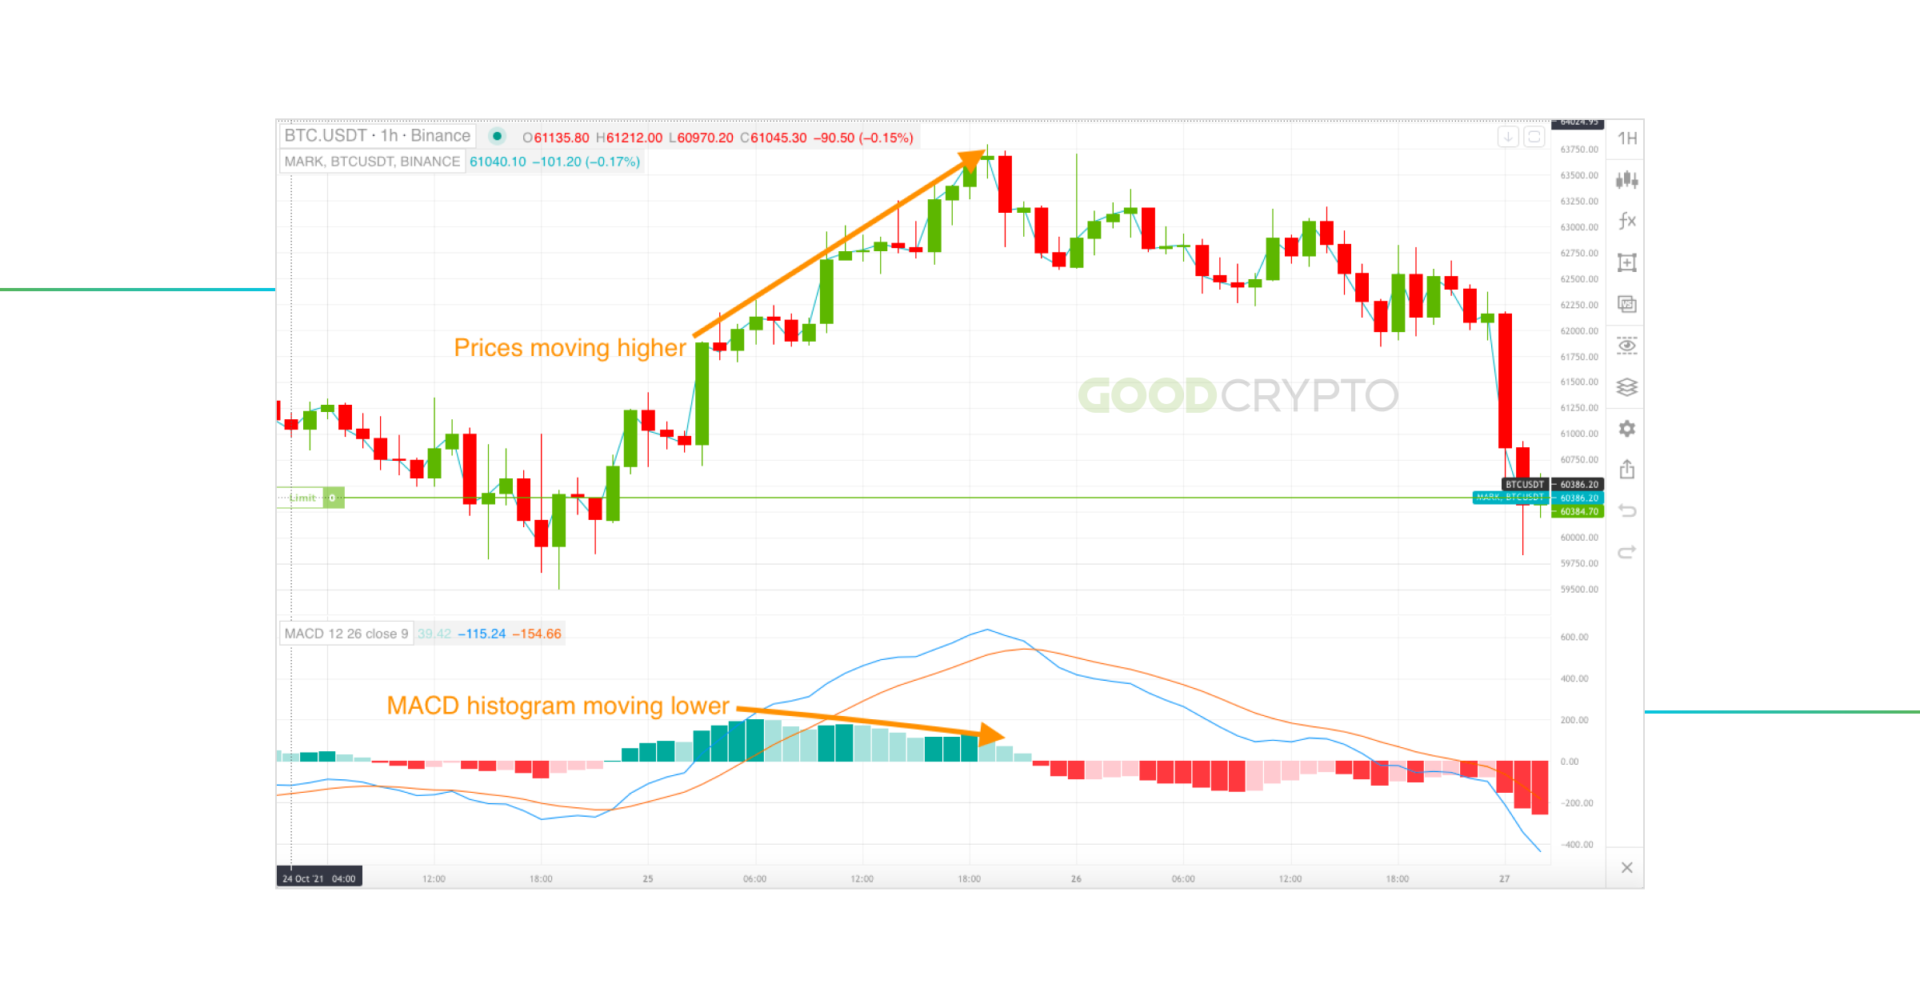
Price is moving higher, while the MACD histogram is moving lower, showing a divergence that indicates that the trend is about to reverse
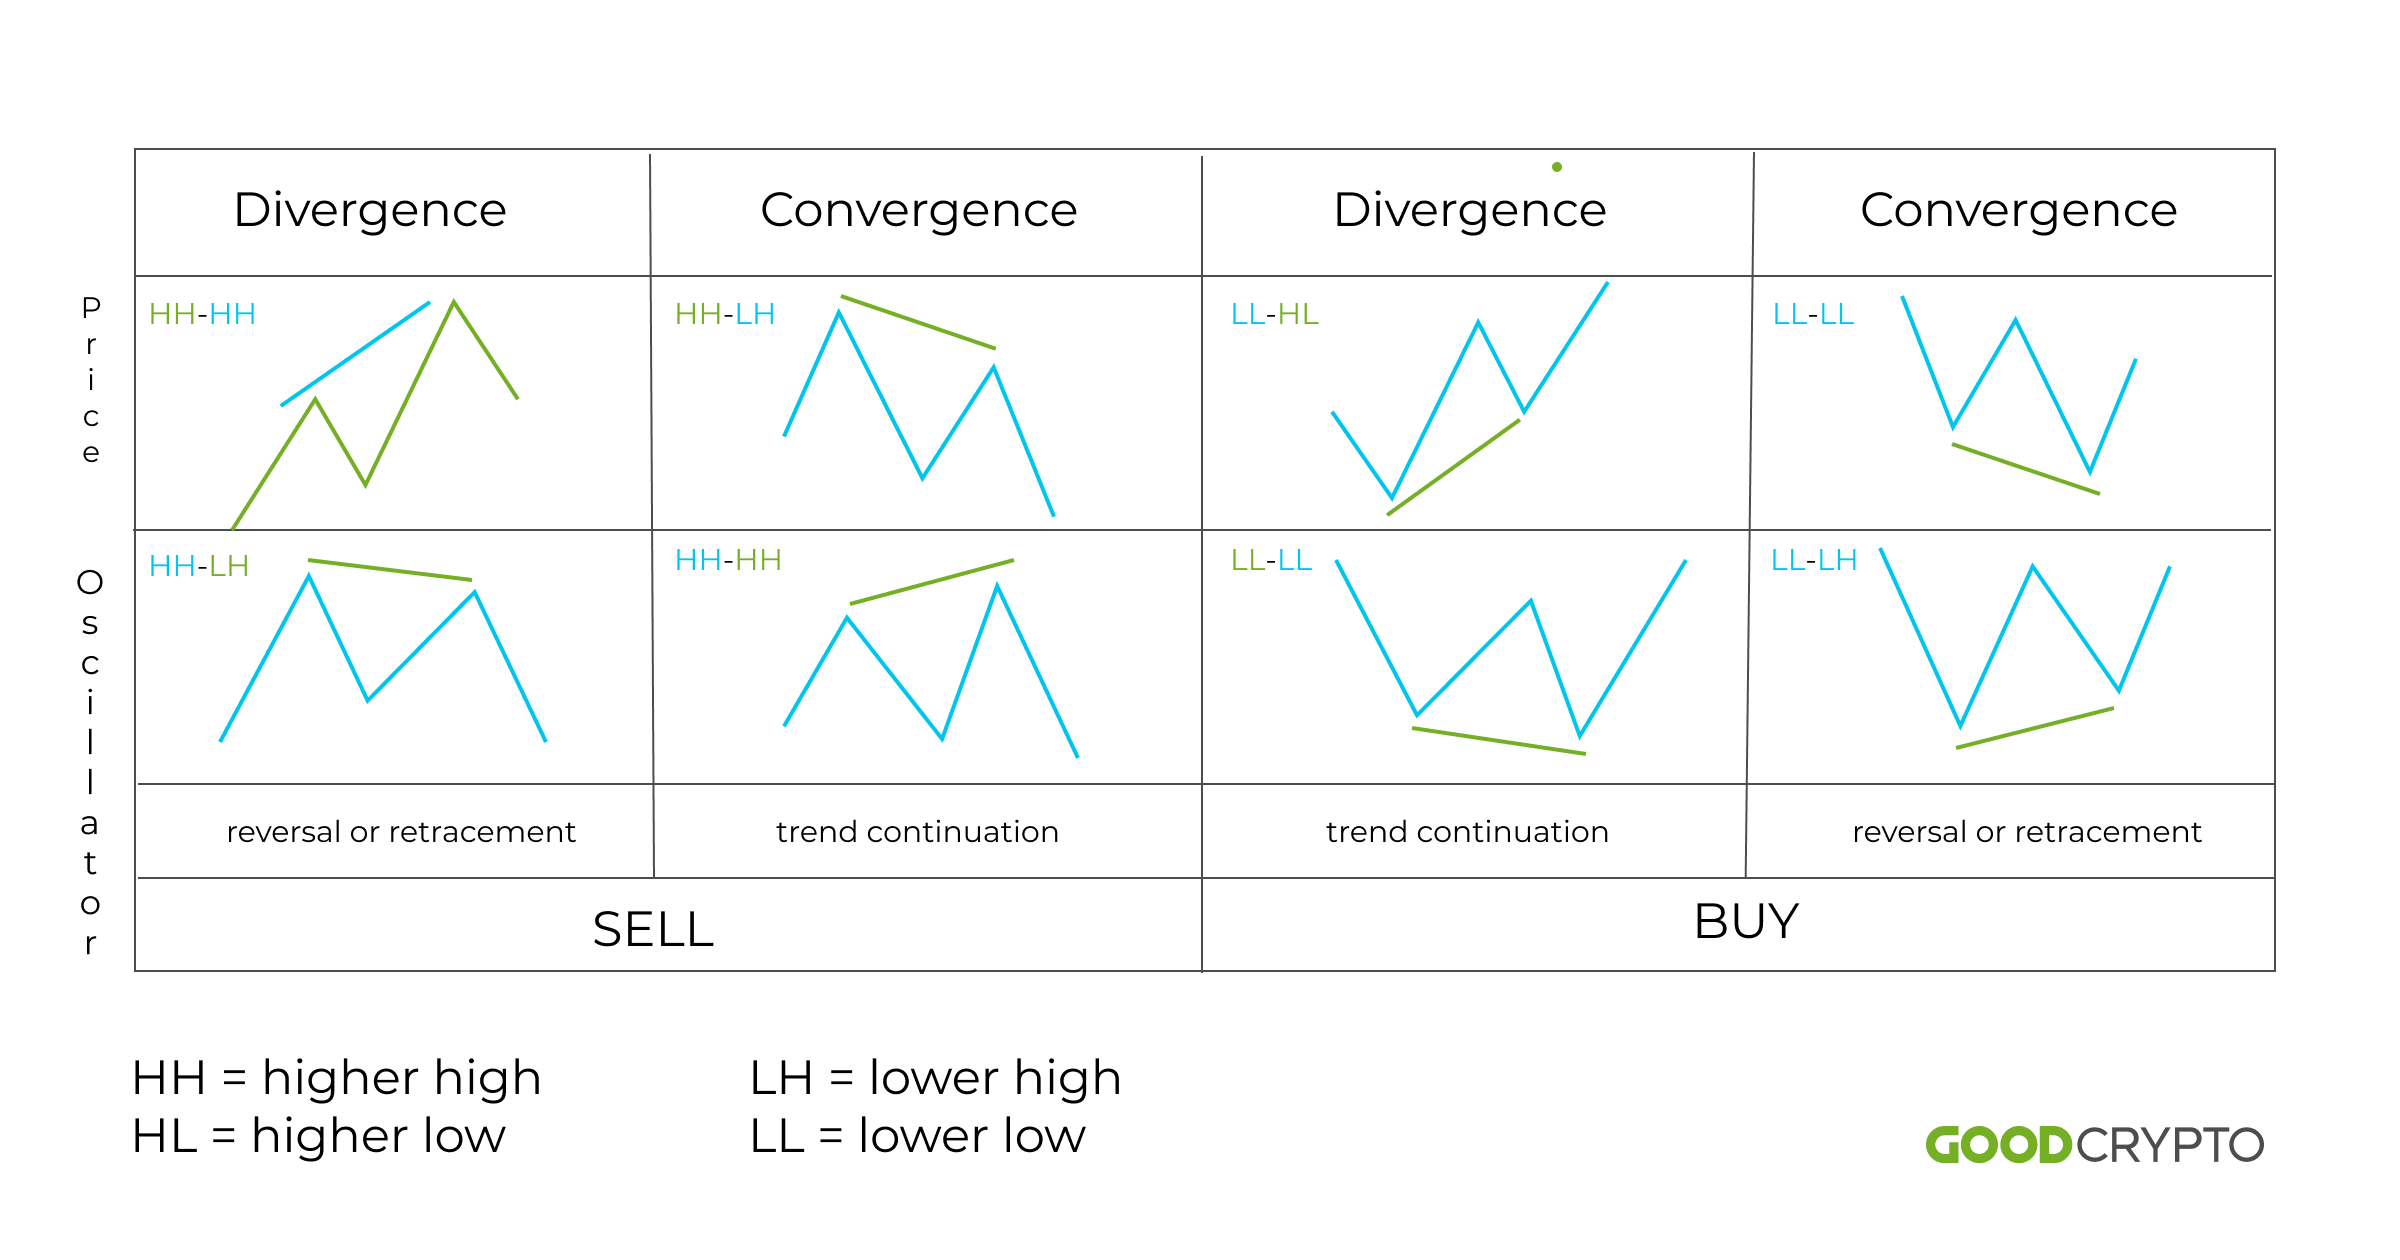
The divergence between MACD and price mostly occurs when there is increased volatility in the market. In an uptrend, when the price forms higher highs in succession, while the MACD oscillator forms lower highs during the same period, it shows that the trend is about to reverse, and it’s time to sell. On the contrary, when the price moves quickly to the downside and forms lower lows, while the MACD oscillator forms higher lows during the same period, an upward reversal is expected, which is a signal to buy. This is one of the most effective implementations of the MACD indicator during a trading exercise. This divergence can be either between price candles and the MACD lines or between the price candles and the MACD histogram.
Keep in mind that traders frequently validate their trading selections by combining the MACD indicator with other technical analysis tools. For instance, they could use the MACD to see prospective trends and use additional indicators like the Moving Average (MA) or Relative Strength Index (RSI) to verify the trend before making a trading decision. Also, don’t understate the importance of risk management and the deployment of suitable stop-loss orders.
Read the full article about MACD here.
Stochastic Oscillator (SO) Indicator Overview
The Stochastic Oscillator indicator is used to measure the strength of the momentum of a given trend. With SO, you can determine whether an established trend will likely continue or whether it is nearing exhaustion. How quickly this indicator reacts depends on the stochastic oscillator settings.
This cryptocurrency indicator consists of two lines: the actual stochastic line and a simple moving average. Both lines move in a range between 0 and 100. Traditionally, below 20 is considered to be the oversold region, while above 80 is overbought. The points of intersection of the lines of the fast stochastic oscillator and the slow one are considered as trend reversal points, but the actual implementation of the stochastic oscillator is usually more technical. This is one of the best oscillator indicators for trading.
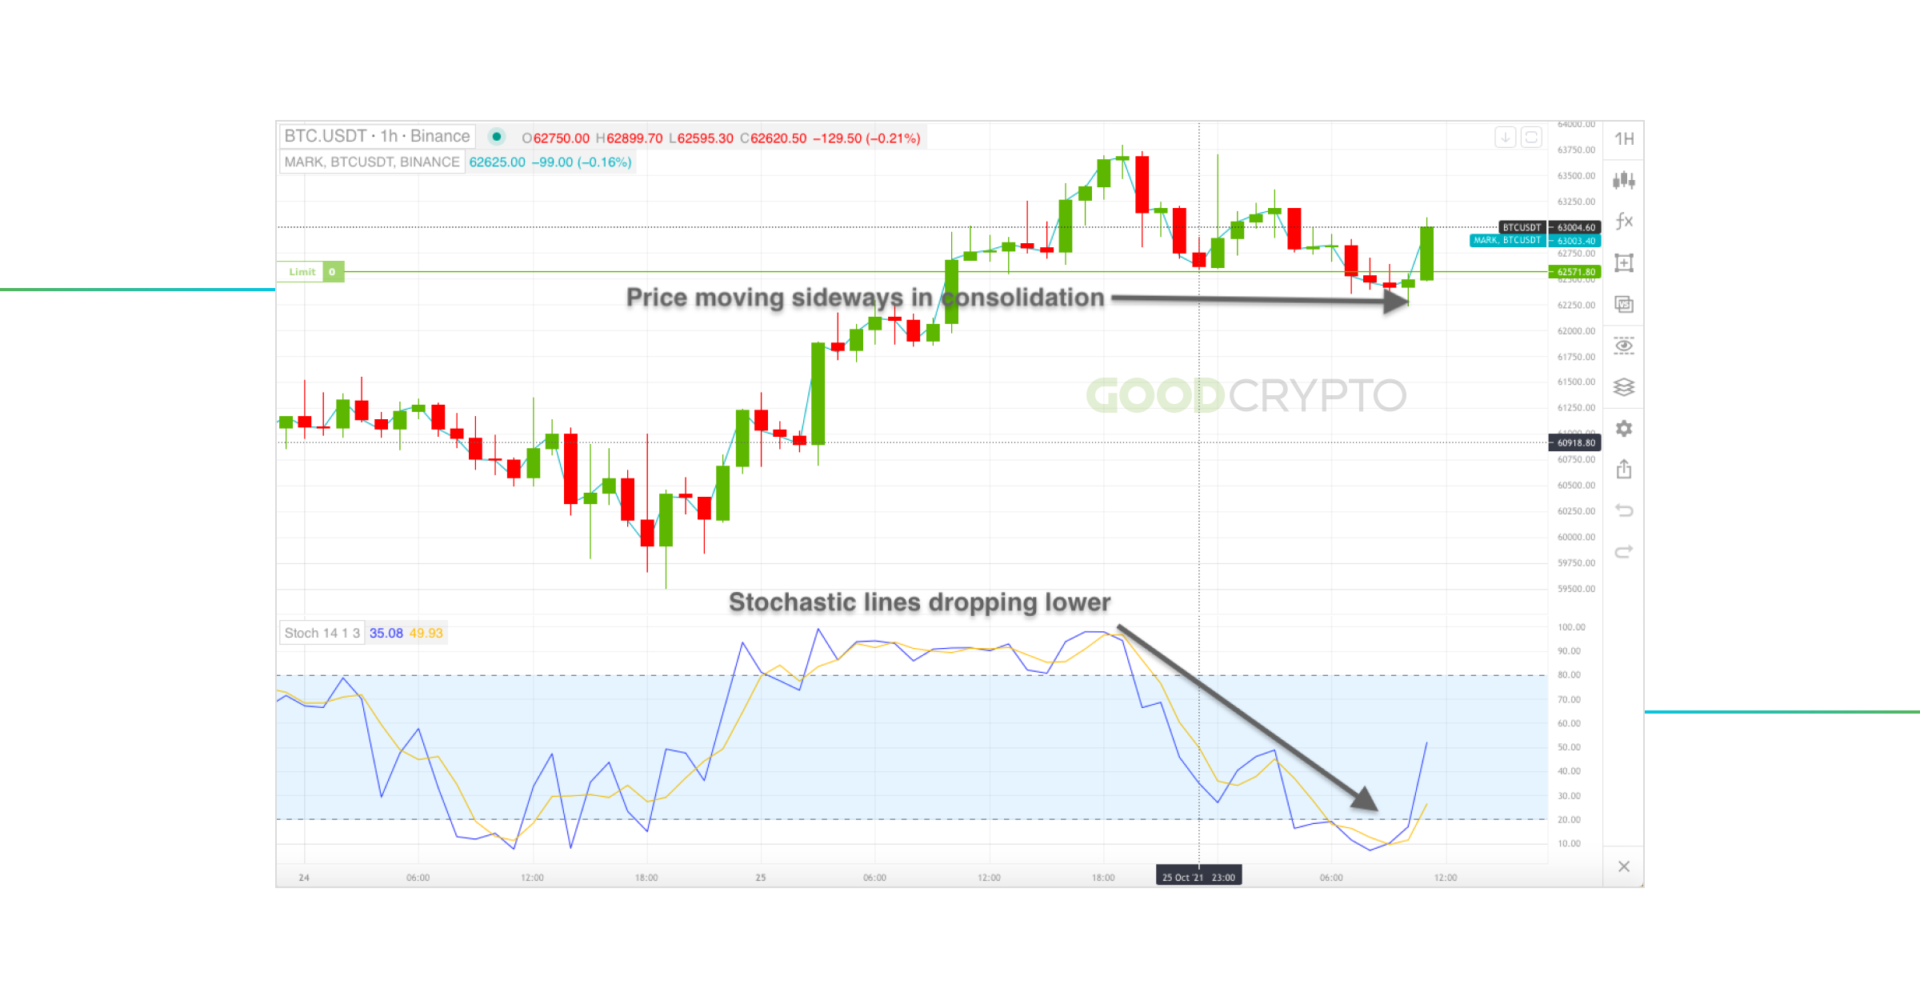
In a strong uptrend, the stochastic indicator drops while the price only moves sideways in consolidation
Sometimes, during a strong trend, overbought or oversold conditions on the Stochastic Oscillator strategy may simply lead to consolidation in a sideways movement in price. This scenario can occur during a strong uptrend, and the stochastic oscillator goes into an overbought condition. As the market consolidates sideways, the stochastic oscillator can drop below 80. This will not mean that you should sell. It simply reveals that the buying momentum has faded for the time being. Also, a divergence between the Stochastic Oscillator and price action can be used as early signals for trend reversal as well.
Here are some tips for using Stochastic Oscillator:
- To obtain a feel of both short- and long-term market patterns, traders can utilize various timeframes: the Stochastic Oscillator is applicable throughout a range of timescales, from minutes to weeks.
- Change the settings for the stochastic oscillator: The Stochastic Oscillator’s default settings, while frequently effective, might not be the best choice for all cryptocurrencies or trading techniques. It’s good to experiment with several settings to see which one best suits your trading needs.
- Utilize it in combination with other indicators because it will help to confirm signals and present a fuller view of the condition of the market.
Check out our complete guide about Stochastic Oscillator.
Ichimoku Cloud Indicator Overview
Ichimoku cloud or Ichimoku indicator is a combination of cryptocurrency indicators that show support and resistance levels, as well as momentum. The display of the Ichimoku cloud is imposed on the price in the form of dynamic horizontal lines and cloud regions.
The Ichimoku clouds in day trading provide three main decision-making information points for cryptocurrency traders. When the price is above the cloud, the trend is up. When the price is below the cloud, the trend is down, and when the price is inside the cloud, the market is trendless or in consolidation.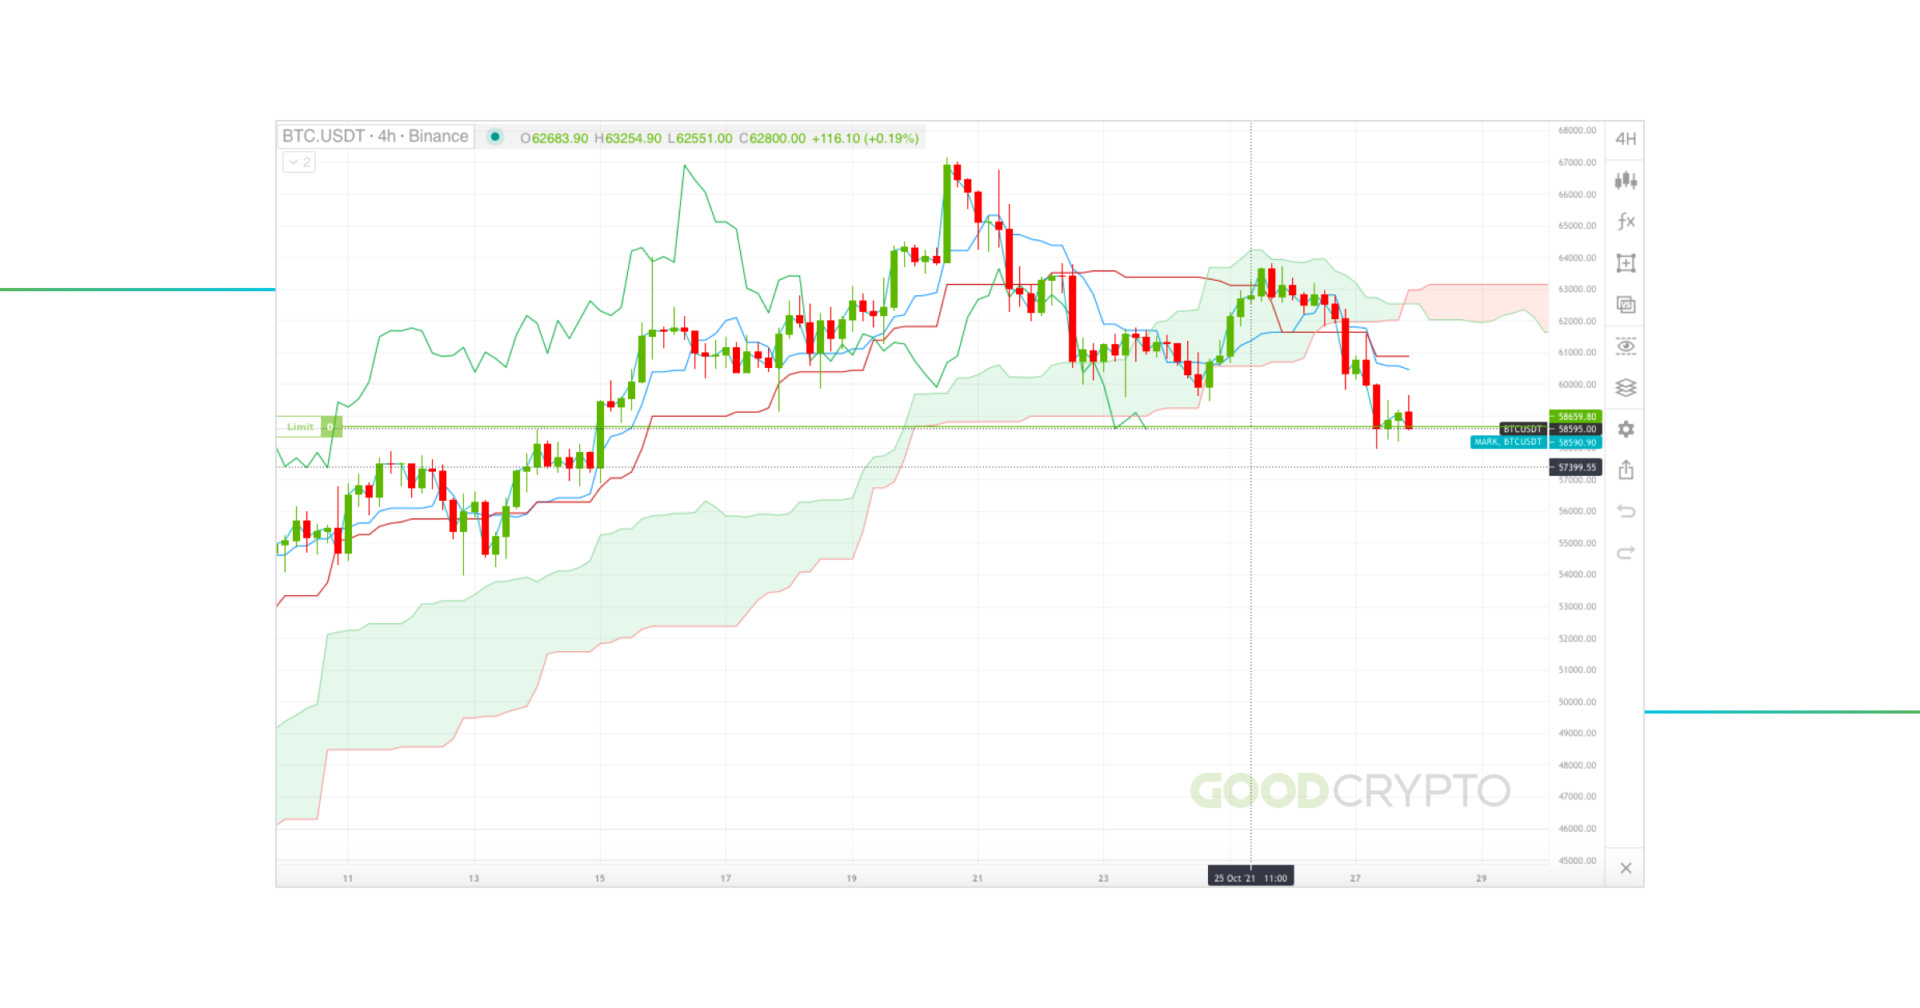
Diagram of Ichimoku cloud on the 4HR BTCUSD Chart
Here are some points on how to use Ichimoku cloud:
- Ichimoku lines have a rapid and slow-moving average, so keep an eye out for crossings. These lines crossing one another might indicate that the trend is shifting. A positive signal may be given, for instance, if the fast-moving average crosses above the slow-moving average while the price is below the cloud.
- Adjust Ichimoku settings for utilizing the indicator on a variety of timescales to better comprehend market patterns. If you want to find short-term trading chances, for instance, you can select a shorter horizon. If you want to validate the general market trend, you might use a longer timeframe.
- Pay close attention to the cloud’s thickness since it might reveal information about how strong a support or resistance level is. Stronger levels of support or resistance are indicated by thicker clouds, whilst weaker levels are shown by thinner clouds.
Read our comprehensive guide about Ichimoku Cloud for crypto traders.
What are Bollinger Bands in Cryptocurrency?
Bollinger band indicator is another cryptocurrency indicator that is used to measure the momentum of the market. It gives us information on whether the price is in an overbought or oversold condition.
Three lines make up the Bollinger band indicator; a positive and negative standard deviation line, each on either side of the price, and a simple moving average in between them.
The most important feature of the Bollinger bands indicator is the “Squeeze.” When the lines contract or squeeze inwards, it tells that volatility is low, therefore, traders would expect a breakout. Otherwise, when the lines spread out, it shows that the volatility is high and the trend is running out of momentum.
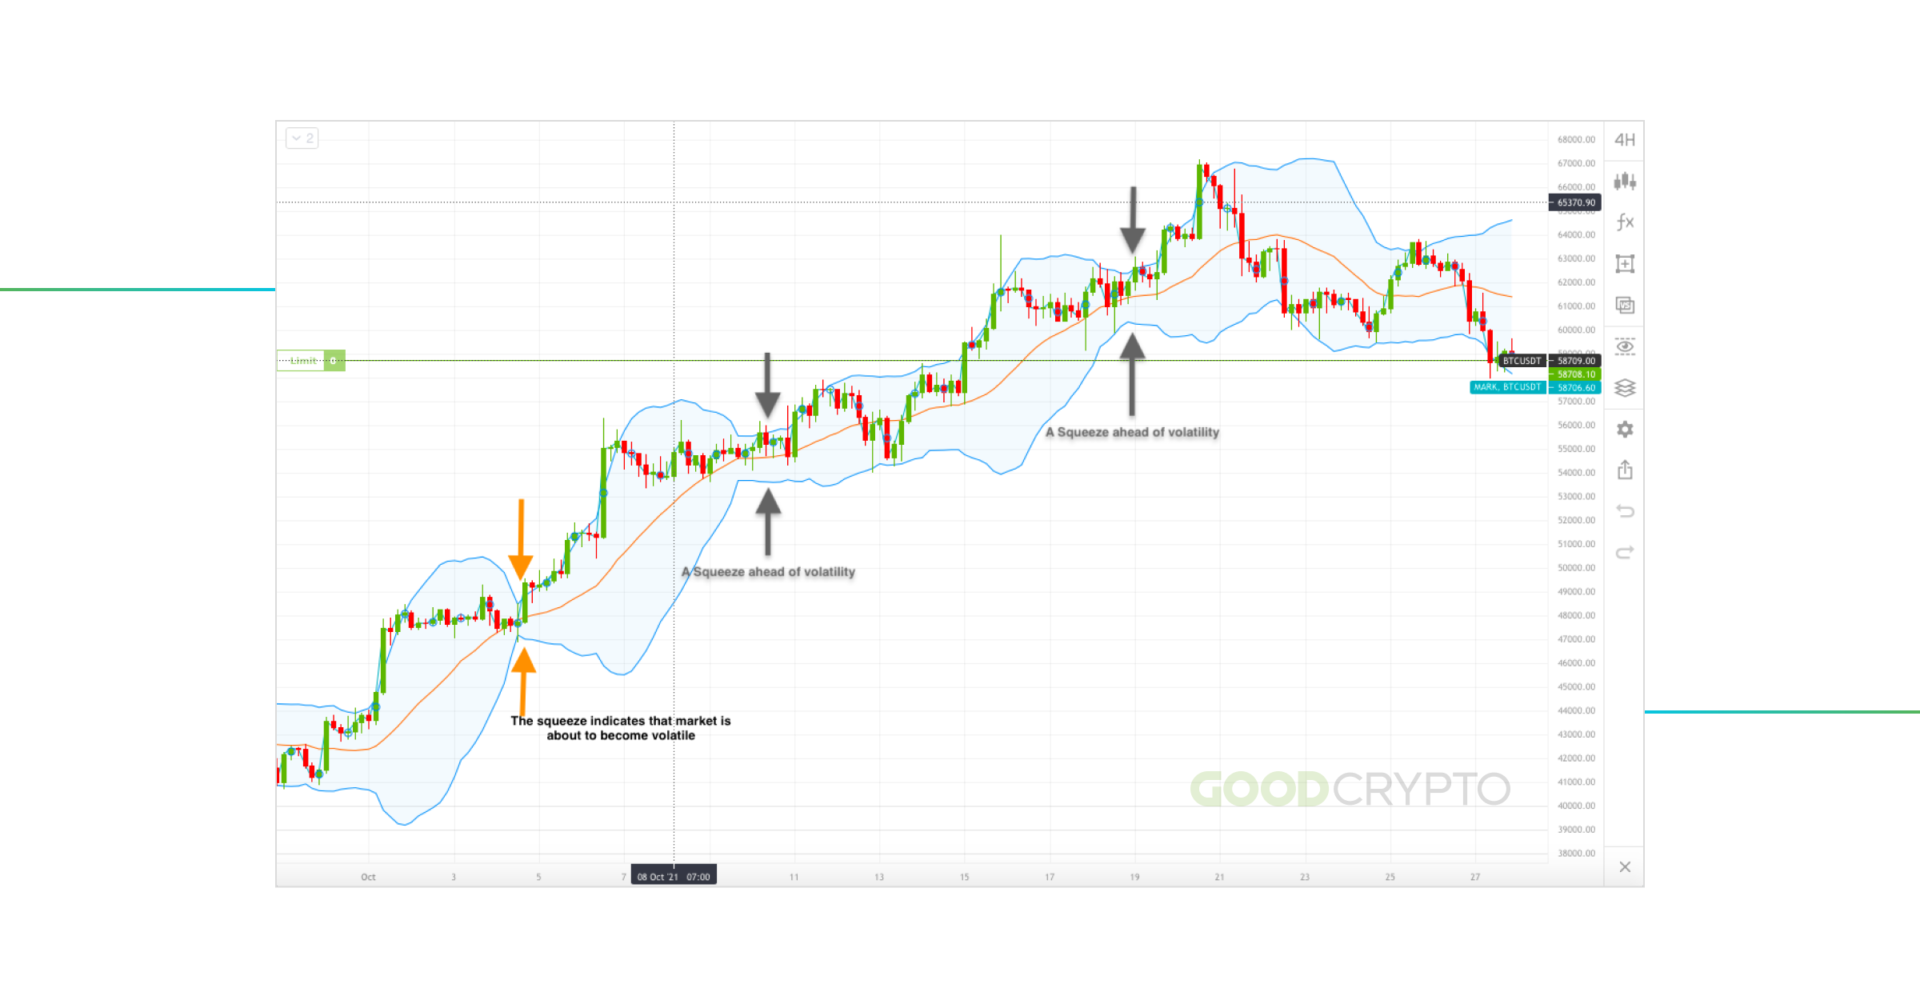
A diagram illustrating how to identify a Bollinger Band Squeeze ahead of market volatility
In essence, Bollinger bands will not necessarily signal which way the market might be heading. Rather, they are used to interpret when a trend is about to begin or is nearing exhaustion. You can use it to know when to expect a significant move, or when to exit a trade. The best way to use this indicator is by combining it with either the MACD indicator or the Stochastic Oscillator indicator.
Read the full article about Bollinger Bands here.
Relative Strength Index (RSI) Indicator Overview
The Relative Strength Index (RSI) is another momentum indicator that is used to gauge if a particular cryptocurrency is overbought or oversold within a given timeframe. The RSI indicator strategy is represented by a single line that moves sideways between two parallel lines.
The range of the relative strength index is between 0 and 100. Below 30, the market is considered oversold, while above 70, it is considered overbought. However, during sustained trends, the relative strength index can remain in either the overbought or oversold region for long periods.
It is always good to use the relative strength index in combination with other indicators that provide entry and exit signals during trading. In such a situation, the RSI indicator would guide whether to remain in the market or prepare to exit the trade. This indicator can also be used to detect divergence signals, similar to what we explained with the MACD indicator.
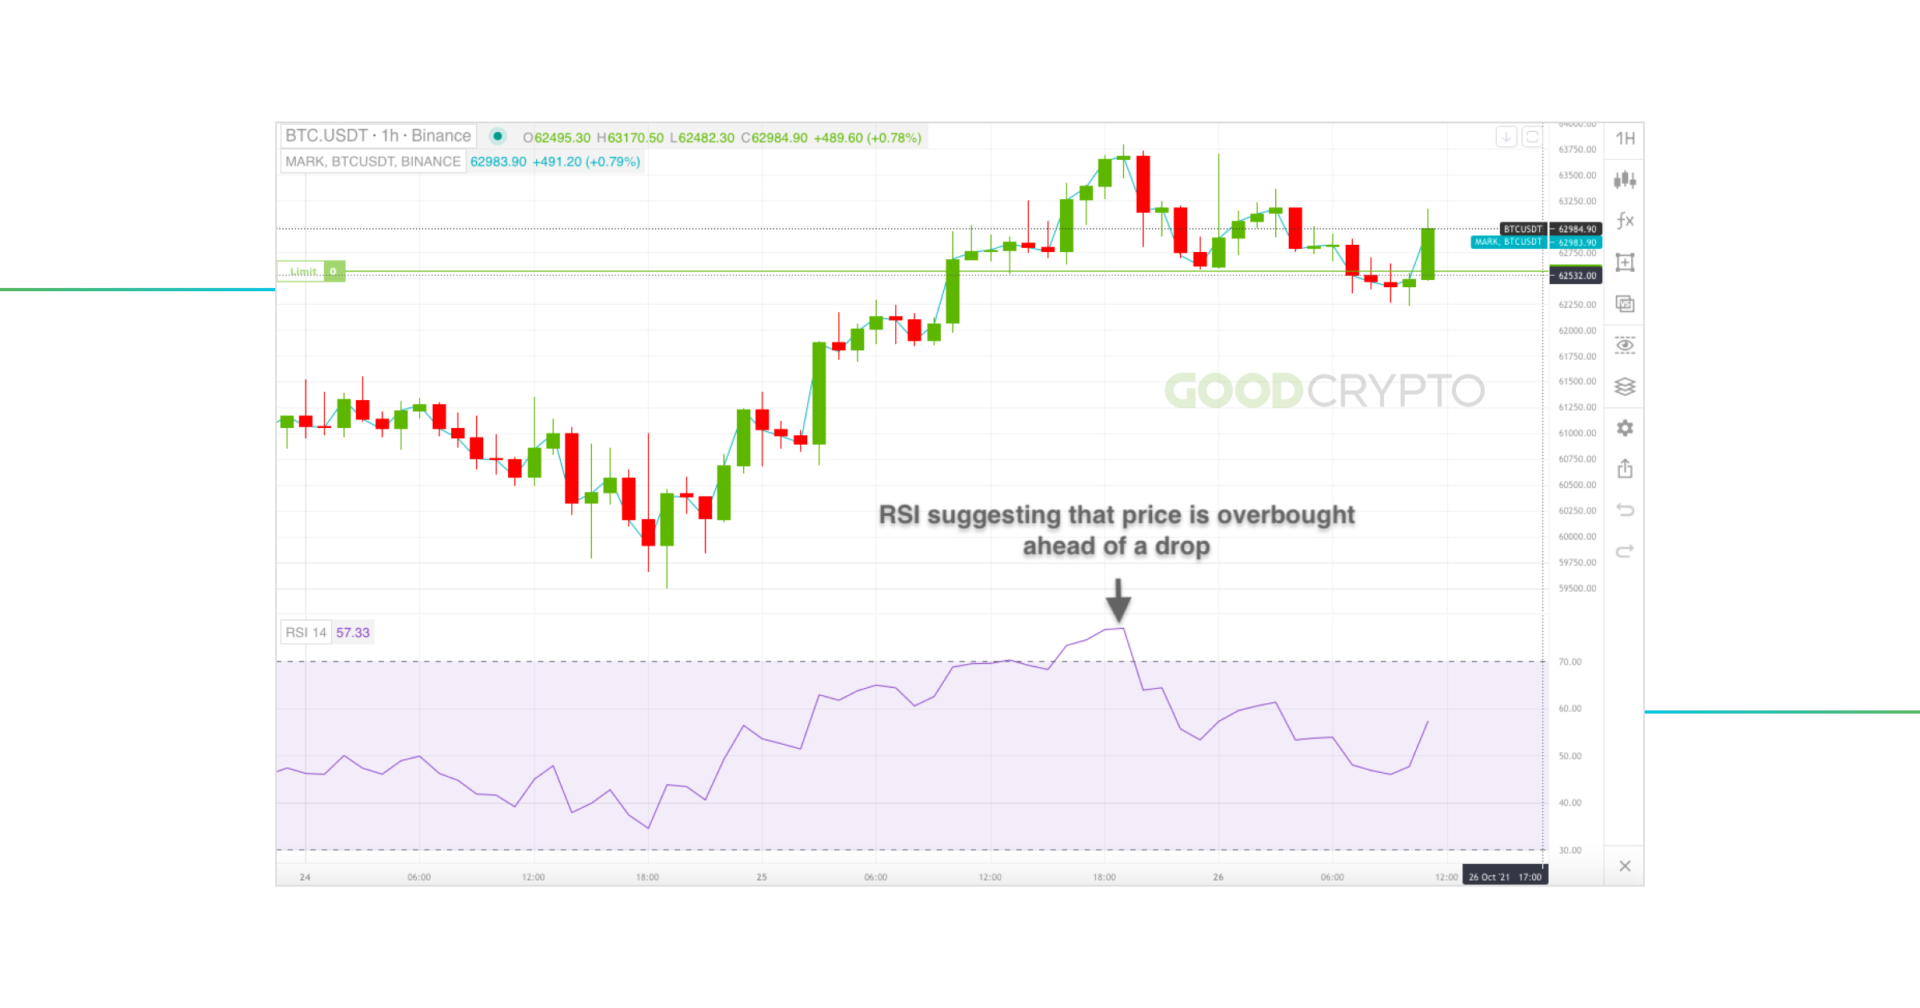
RSI indicator in an overbought condition suggests an imminent drop in price.
The RSI indicator can produce erroneous indications during times of low volatility or turbulent market activity, which is a crucial aspect to keep in mind. This means that even if the market is not showing a clear trend, the RSI may still show an overbought or oversold state. To verify the accuracy of its indications, it is crucial to combine the RSI with other indicators and price movement research.
When examining the RSI indicator, crypto traders also need to be aware of the used timeframe. A signal that occurs on a shorter timescale might not be as significant as one that appears on a longer timeframe since various time frames might produce distinct signals. In order to obtain a full view of the market while utilizing the RSI indicator, it is important to take into account several periods.
To improve your trading skills and upgrade your knowledge about this indicator, read our full article about the Relative Strength Index (RSI) Indicator for Crypto Trading.
Fibonacci Retracement Indicator Overview
The Fibonacci retracement tool is one of the most widely used indicators in cryptocurrency trading. This tool is used to plot Fibonacci retracement levels that indicate support and resistance levels on a given price chart. Each Fibonacci retracement level is associated with a percentage retracement of the historical trend under consideration. The levels are 23.6%, 38.2%, 61.8%, and 78.6%. These levels stem from Fibonacci’s sequence, a mathematical formula that originated in the 13th century.
The Fibonacci retracement indicator is used to predict levels where the price is expected to find resistance or support. They can be used to set targets during cryptocurrency trading. For instance, during an uptrend, the price of a given cryptocurrency could be expected to bounce off a Fibonacci support level. This could serve as a good point to buy, while a resistance level could serve as a profit target where you can close a trade in the expectation of a reversal.
On the contrary, a confirmed breakout of support or resistance could also serve as an entry point for a trade in the direction of the trend. This is because once support or resistance is broken, its identity is flipped. Broken support becomes resistance, while broken resistance becomes support.
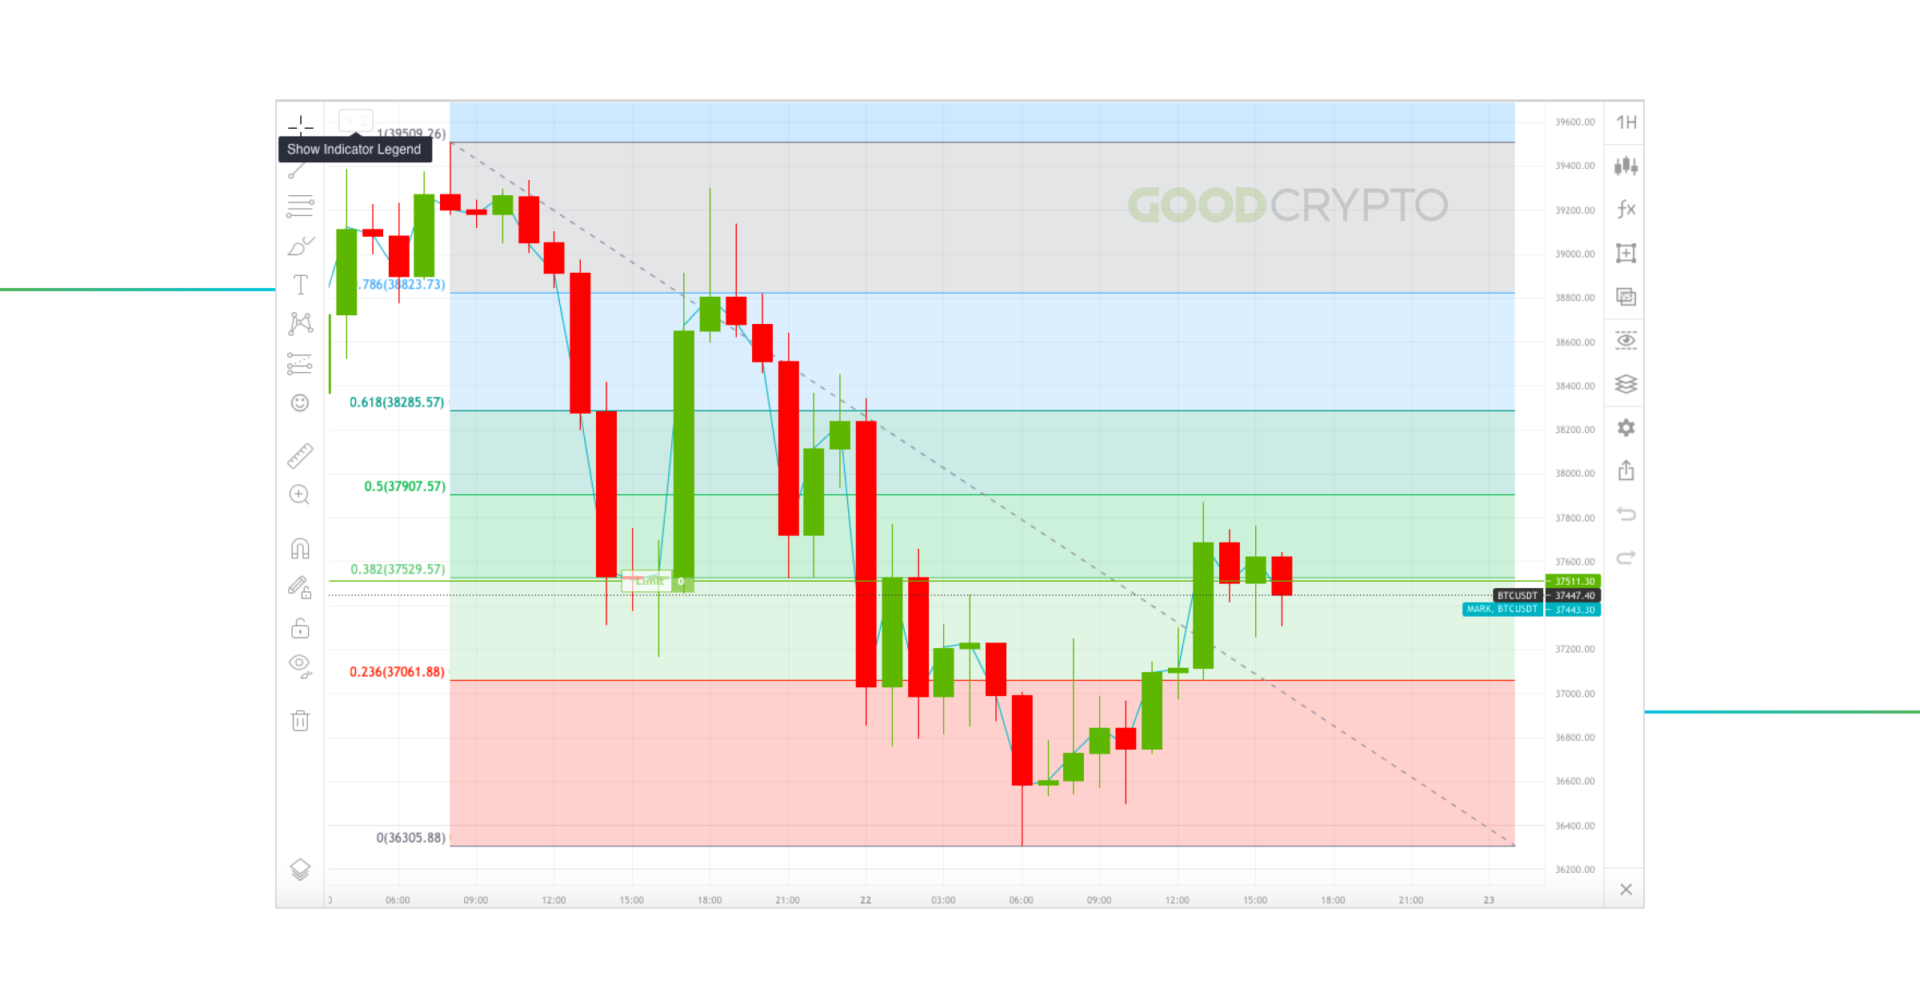
Fibonacci retracement lines indicate future levels of support and resistance
Learn more about how to trade with Fibonacci Retracement in crypto in the article by the GoodCrypto team.
On Balance Volume Indicator Overview
One of the most crucial and trustworthy indicators for traders is the On Balance Volume (or OBV). Let’s learn more about OBV meaning and how to read On Balance Volume.
What is On Balance Volume?
The On-Balance Volume aids in identifying market trends and evaluating the buying and selling pressure of a certain cryptocurrency. It is an extremely useful indicator for day and swing traders who must time their market entry and exit precisely. The OBV is based on the idea that volume comes before price and predicts that the asset’s price will rise when buying pressure exceeds selling pressure.
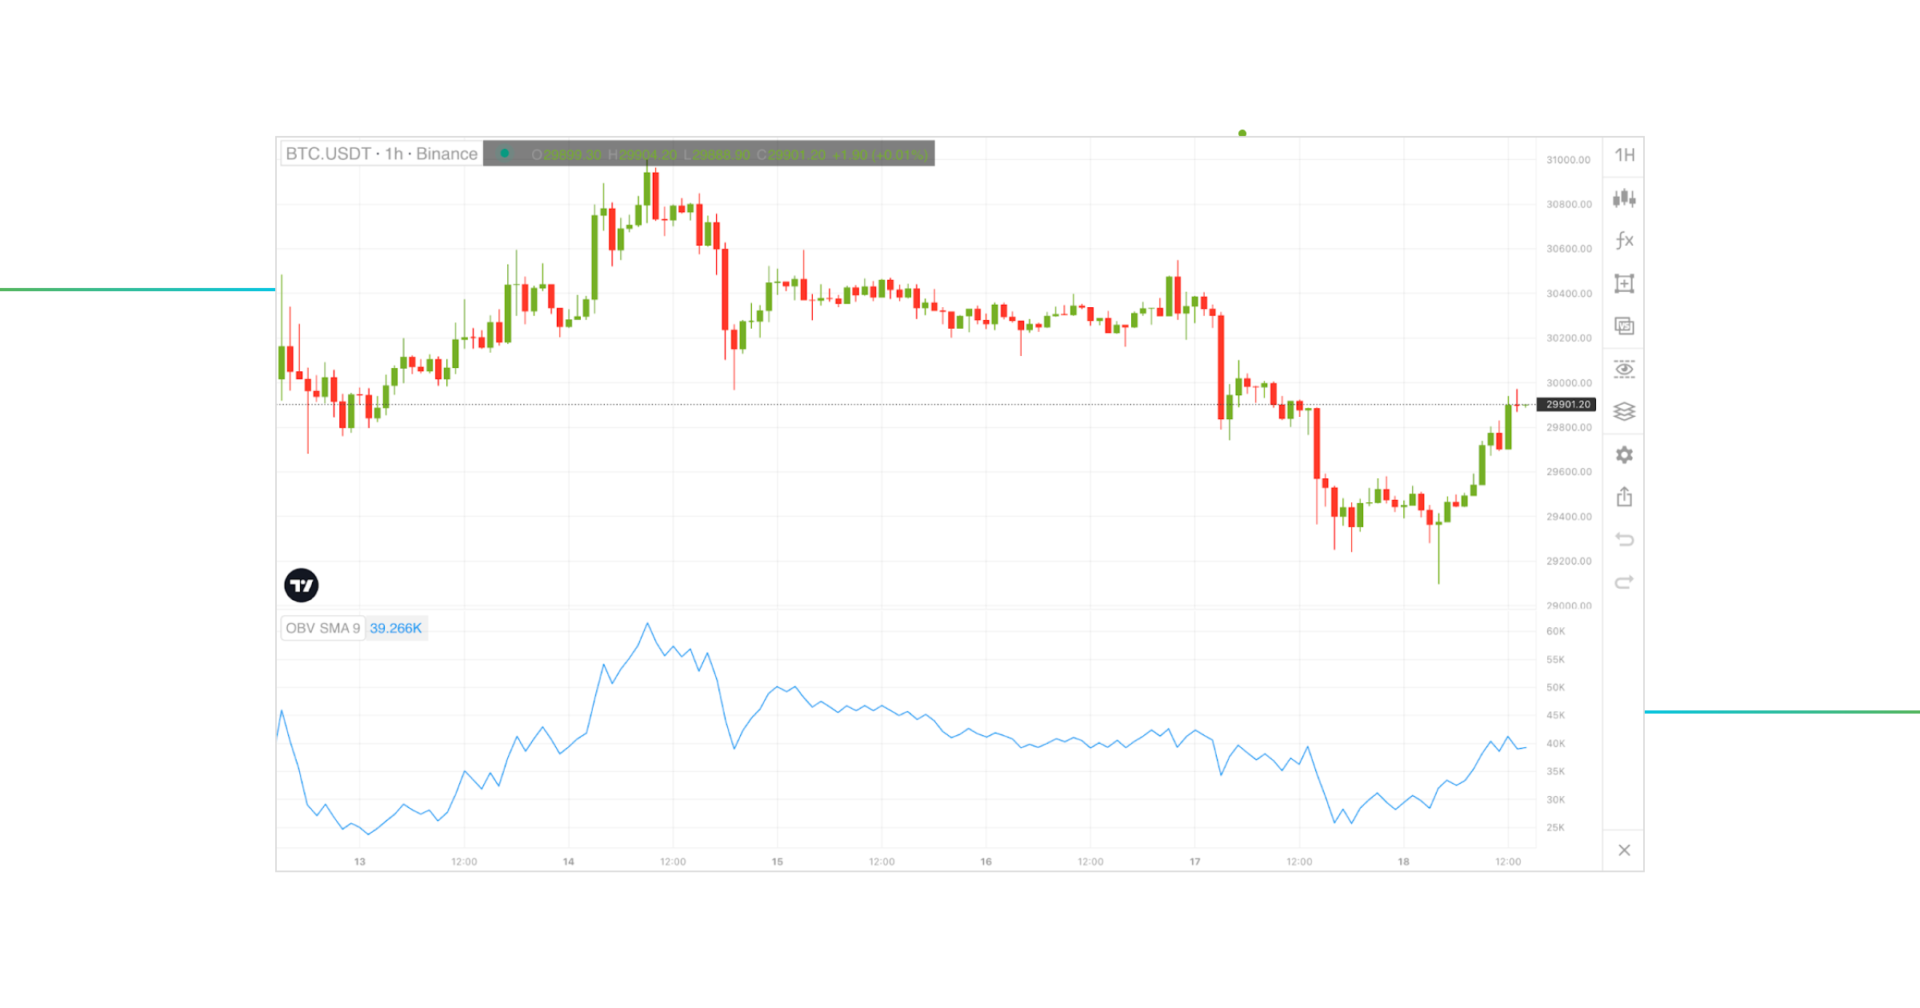
The OBV SMA 9 line is created by plotting the OBV values on a chart and applying a 9-period moving average to smooth out the data and provide a clearer view of the trend
The On Balance Volume formula entails adding the cryptocurrency’s volume to an accumulated total if the close price is greater than the previous close; otherwise, it requires deducting it from the total. A rising OBV line denotes more buying pressure, whereas a falling line denotes stronger selling pressure. The OBV is useful since it may confirm or contradict a cryptocurrency’s price movement. For example, if Bitcoin’s price increases, but the OBV line falls, this may indicate a probable trend reversal. Such a scenario would suggest that buying pressure is waning and may indicate a potential shift in the trend.
The OBV indicator is adaptable, simple to use, and offers insights into market trends that cannot be collected only from price charts.
Aroon Indicator (ARN) Overview
What is Aroon Indicator?
The Aroon Indicator is a useful tool for day traders to assess trend strength and foresee potential trend reversals. Aroon up and down indicator presents two lines, showing the strength of uptrends and downtrends, respectively. A strong trend is shown when both lines move in the same direction, while a potential trend reversal is indicated when they move in the opposite direction or cross. When the Aroon Up Line crosses above the Aroon Down Line, it is considered a bullish signal and indicates the start of an upward trend. Traders may perceive this as a buy signal since the asset’s price is expected to go up in the near future.
On the contrary, when the Aroon Down Line crosses above the Aroon Up Line, it suggests that the market’s momentum is going downtrend. Traders consider this as a bearish signal.
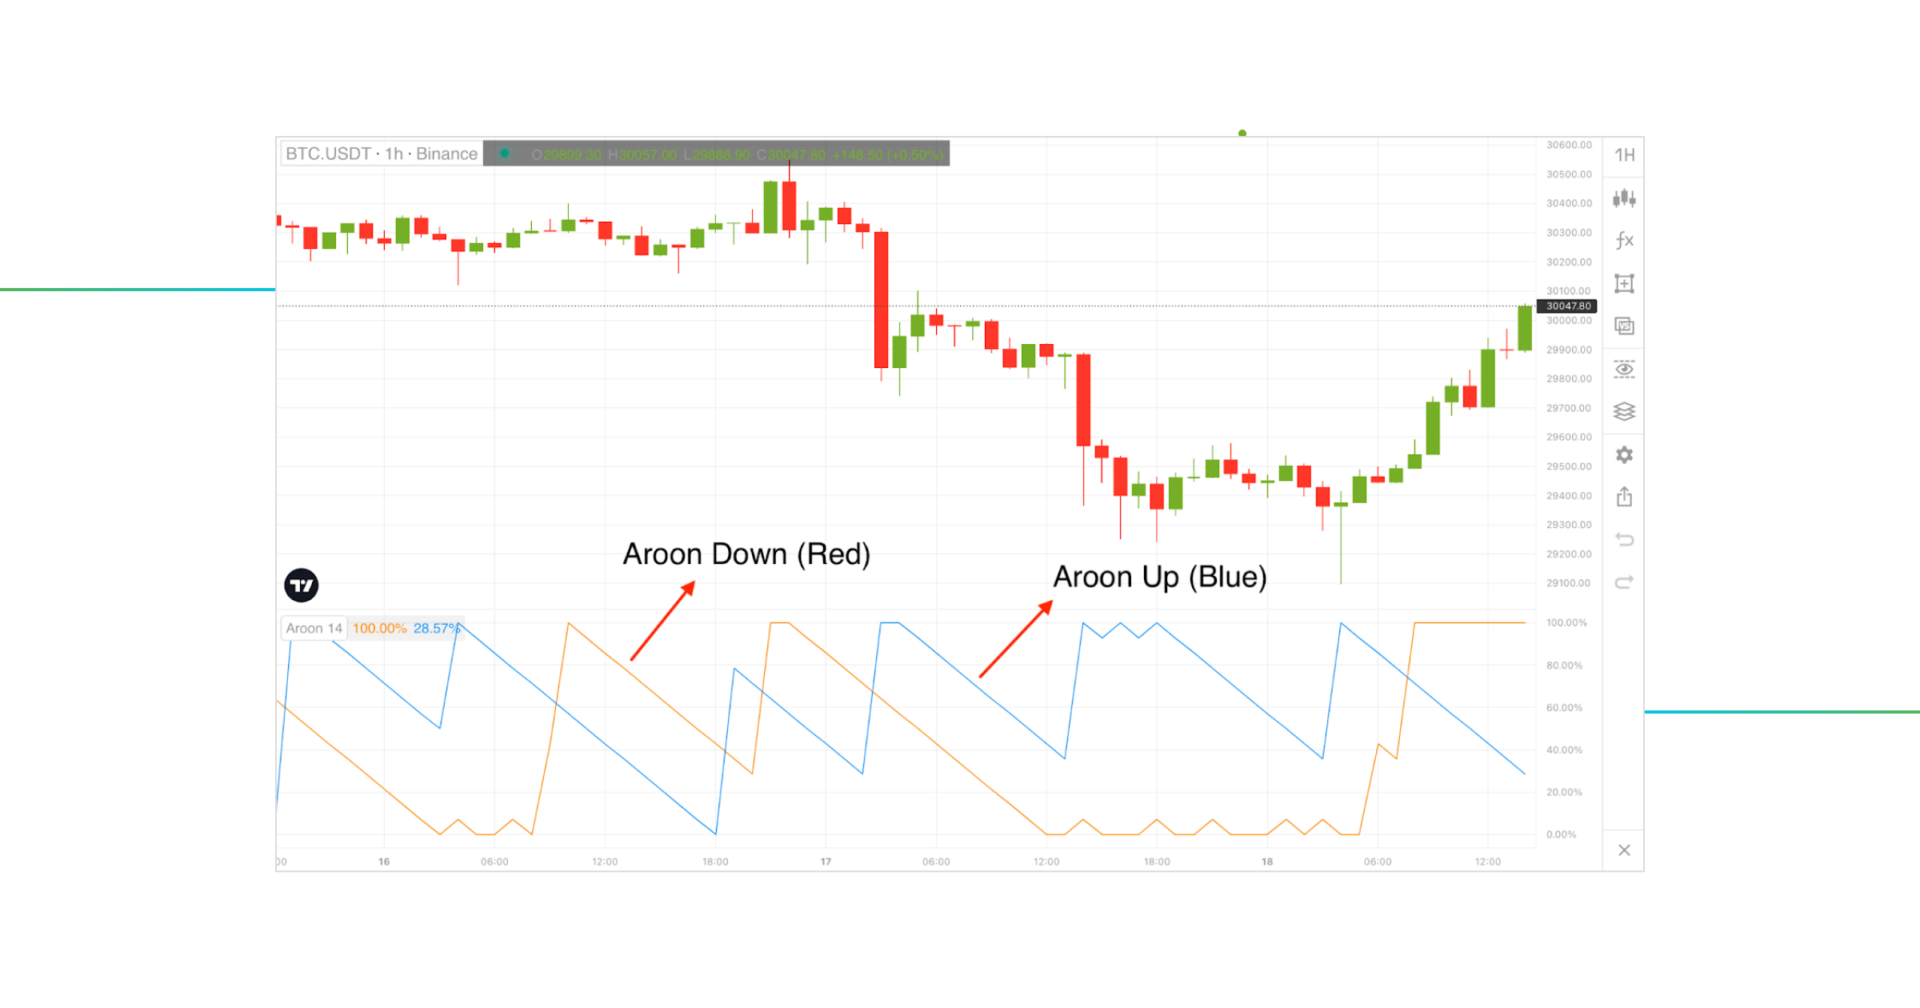
Aroon indicator example
The Aroon Indicator is a crucial tool for both swing and day traders to spot potential trend shifts and timing lucrative trade. However, to make well-informed trading decisions, traders should combine the Aroon Indicator with additional tools and indicators.
Average Directional Index (ADX) Overview
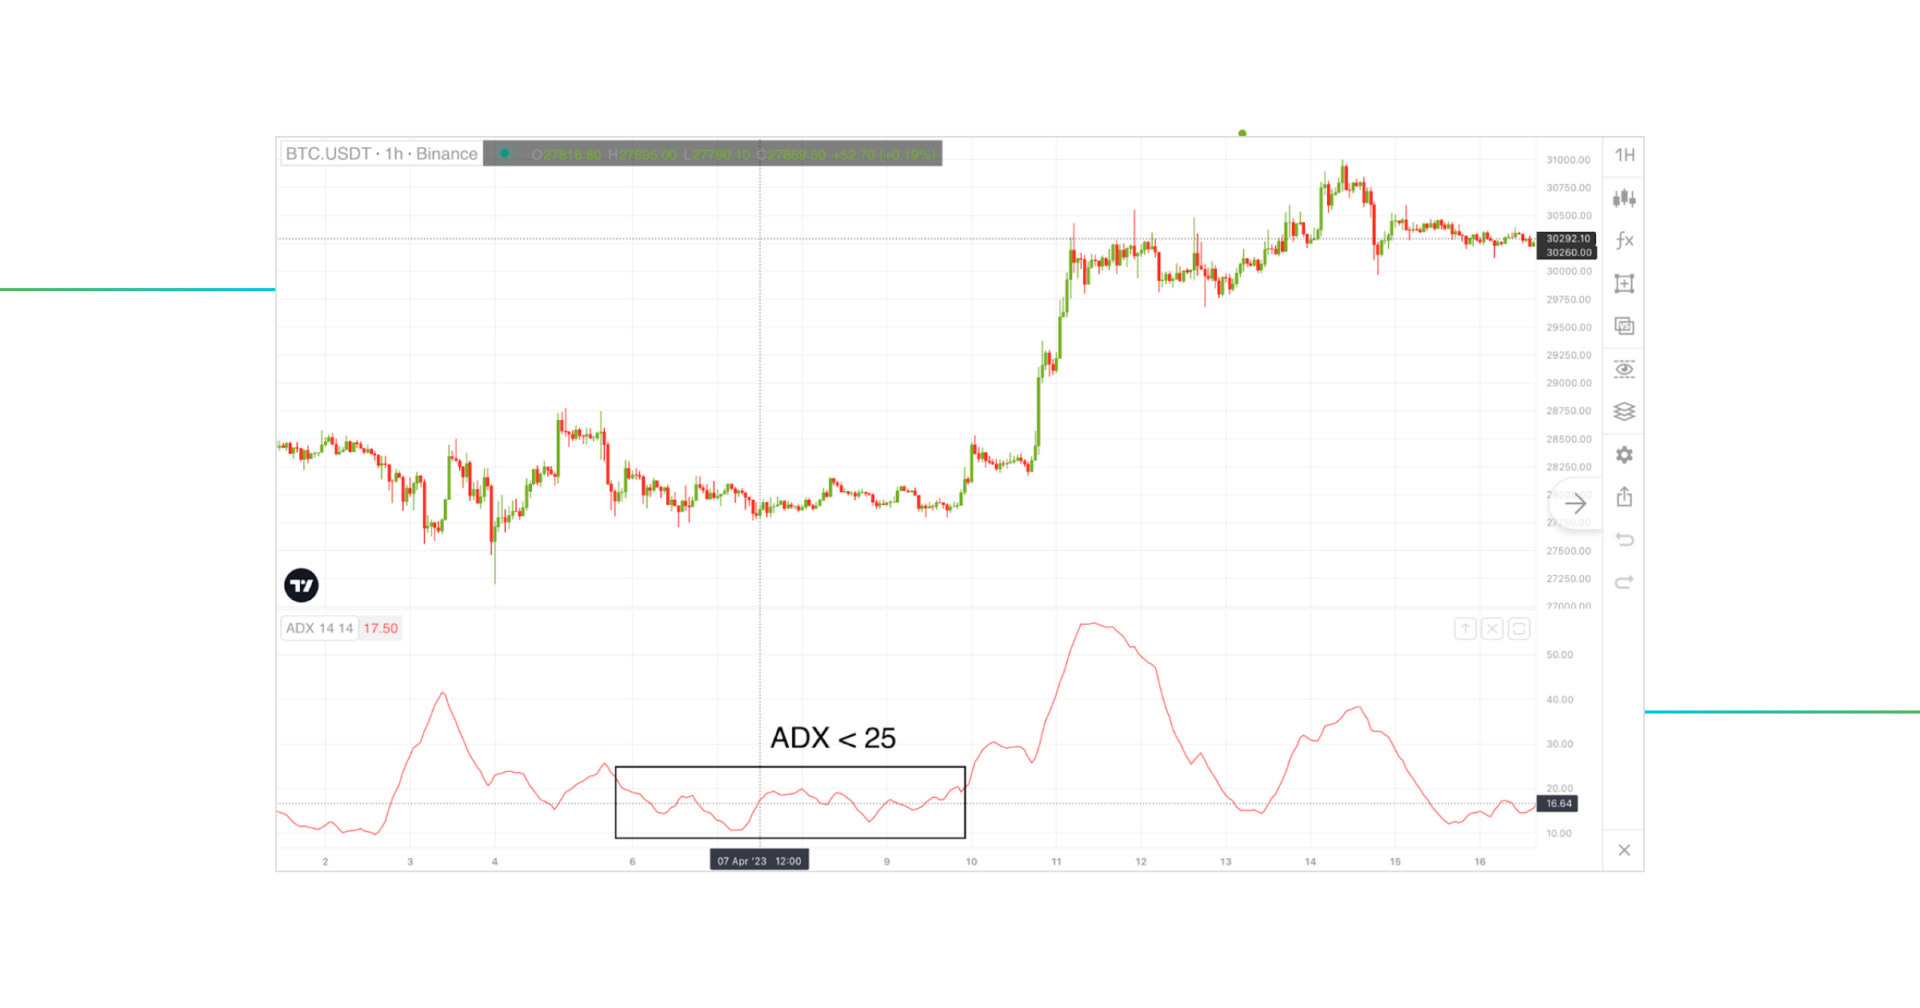
For traders who wish to gauge the strength of a trend in the cryptocurrency market, the Average Directional Index (ADX) is a very useful indicator. On a scale of 0 to 100, the ADX determines the trend’s strength: readings above 25 indicate a strong trend, while readings below 20 indicate a weak trend.
| ADX Value | Trend Strength |
| 0-25 | Absent or Weak Trend |
| 25-50 | Strong Trend |
| 50-75 | Very Strong Trend |
| 75-100 | Extremely Strong Trend |
By determining the trend’s strength, traders can make informed trading decisions. For instance, if the ADX is over 25, indicating a strong trend, traders may decide to open a long position and ride the uptrend. Conversely, if the ADX is below 20, indicating a weak trend, traders may decide not to participate in trading activities, refrain from opening new positions in the market, or exit their current positions.
The Average Directional Index strategy is complicated, but with enough practice, you can master it. To improve trading success rates, combining the ADX index with additional indicators is a smart tactic. For instance, the Moving Average Convergence Divergence (MACD) and the ADX together can produce stronger signals for entering and exiting trades. Moreover, the ADX can filter out false signals by setting a higher threshold, reducing the likelihood of trading on weak trends. This indicator can be particularly useful for day traders who require quick and accurate signals to increase their profits.
Awesome Oscillator (AO) Overview
The Awesome Oscillator is a momentum indicator developed by Bill Williams, which produces trend reversal signals. Williams believed that markets are inherently unpredictable and that investors should focus on analyzing trading patterns and trends instead of trying to forecast future changes in their investment’s values. Let’s see how Awesome Oscillator works.
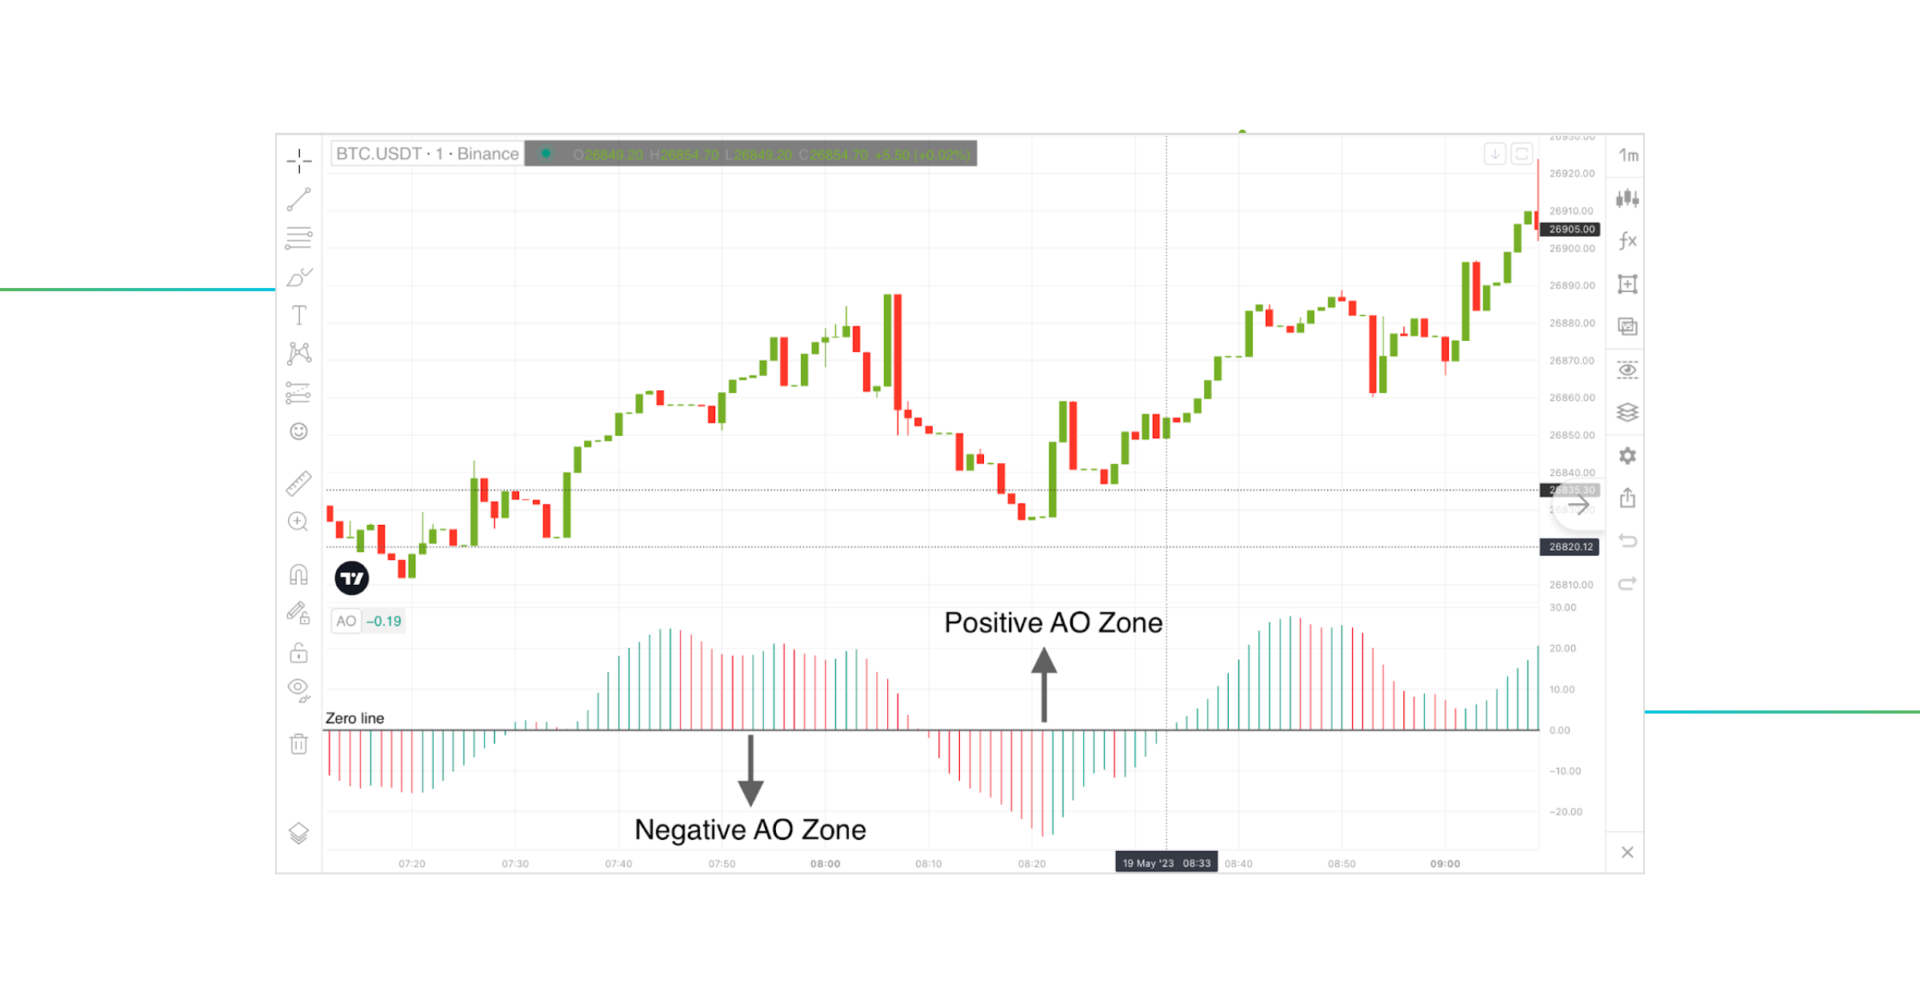
The histogram bars can fluctuate above or below the zero value, with green bars indicating an increase in value and red bars indicating a decrease.
The 5 SMA and 34 SMA are fixed parameters for the AO indicator and cannot be adjusted. The simplest way to use the Awesome Oscillator is to employ the Zero Line Crossover, which signals a change in market momentum. When the AO histogram crosses the zero line from the negative to the positive zone, it produces a buy signal and when it crosses the zero line from above the Zero Line, it produces a sell signal.
If you’re interested in learning about AO more, check out our article where we describe all the nuts and bolts of this indicator.
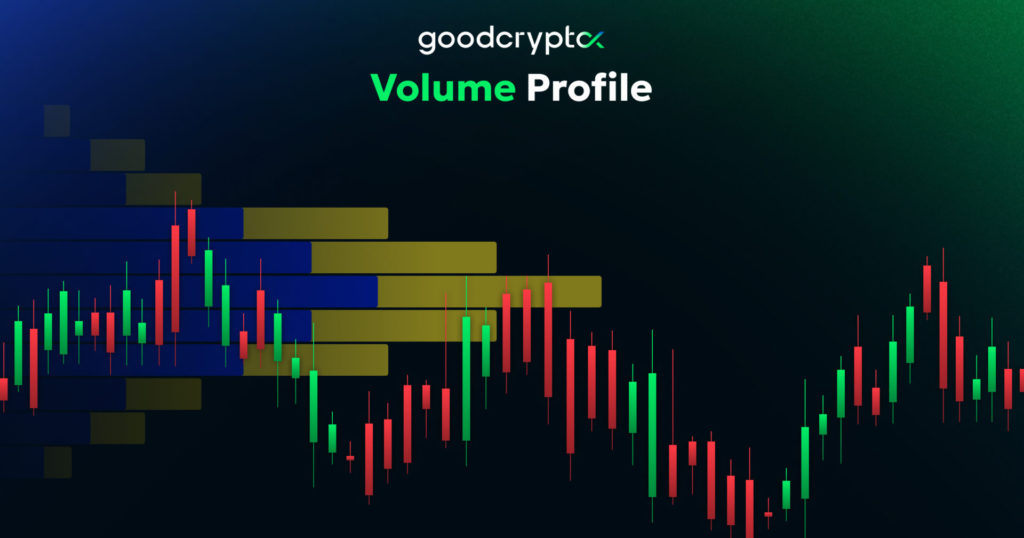
Volume Profile Indicator Overview
The Volume Profile is a charting method that displays the trading activity of a particular cryptocurrency over time. By providing information on the supply and demand of a particular cryptocurrency, the Volume Profile indicator can assist traders in making informed trading decisions and identifying key price points where buyers or sellers may enter or exit the market. This information can help traders determine support and resistance zones, which are important in developing effective crypto trading strategies.
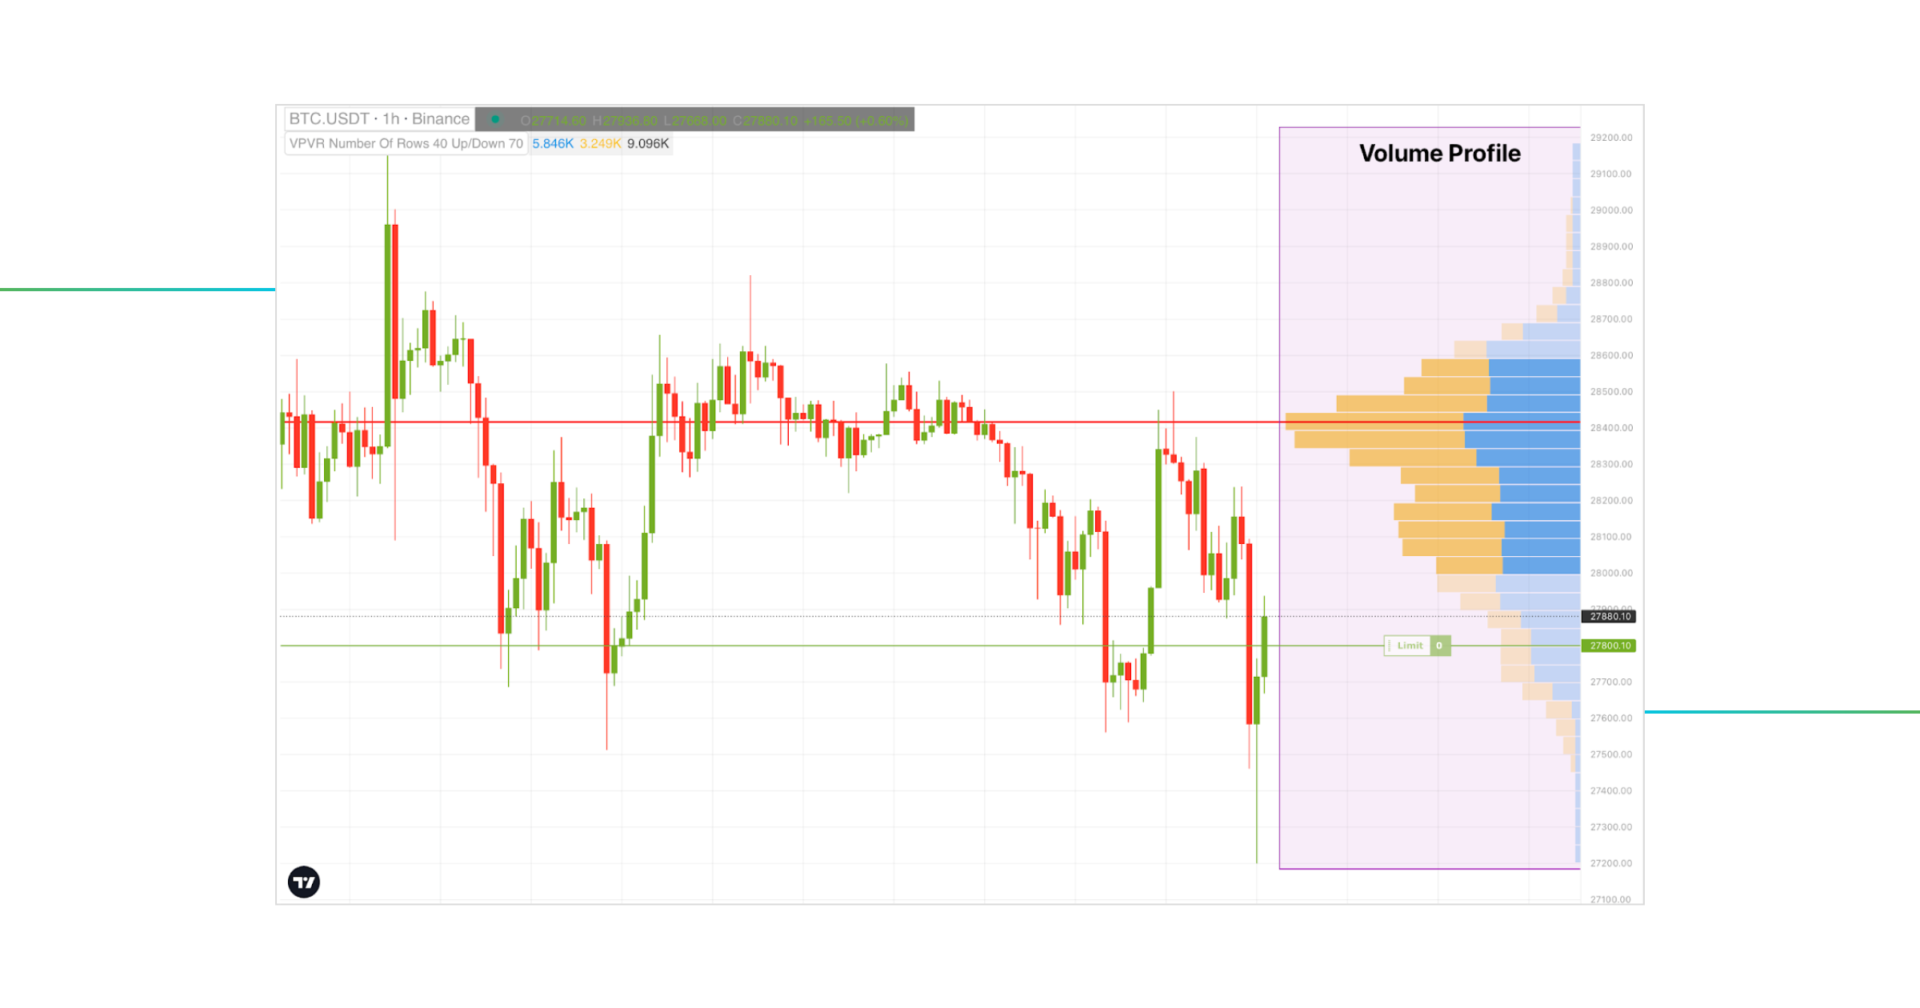
Volume profile charts are composed of horizontal bars that depict trading activity at certain price levels. The taller the bar, the higher trading activity or trading volume, indicating the high liquidity zone and potential strong support or resistance areas.
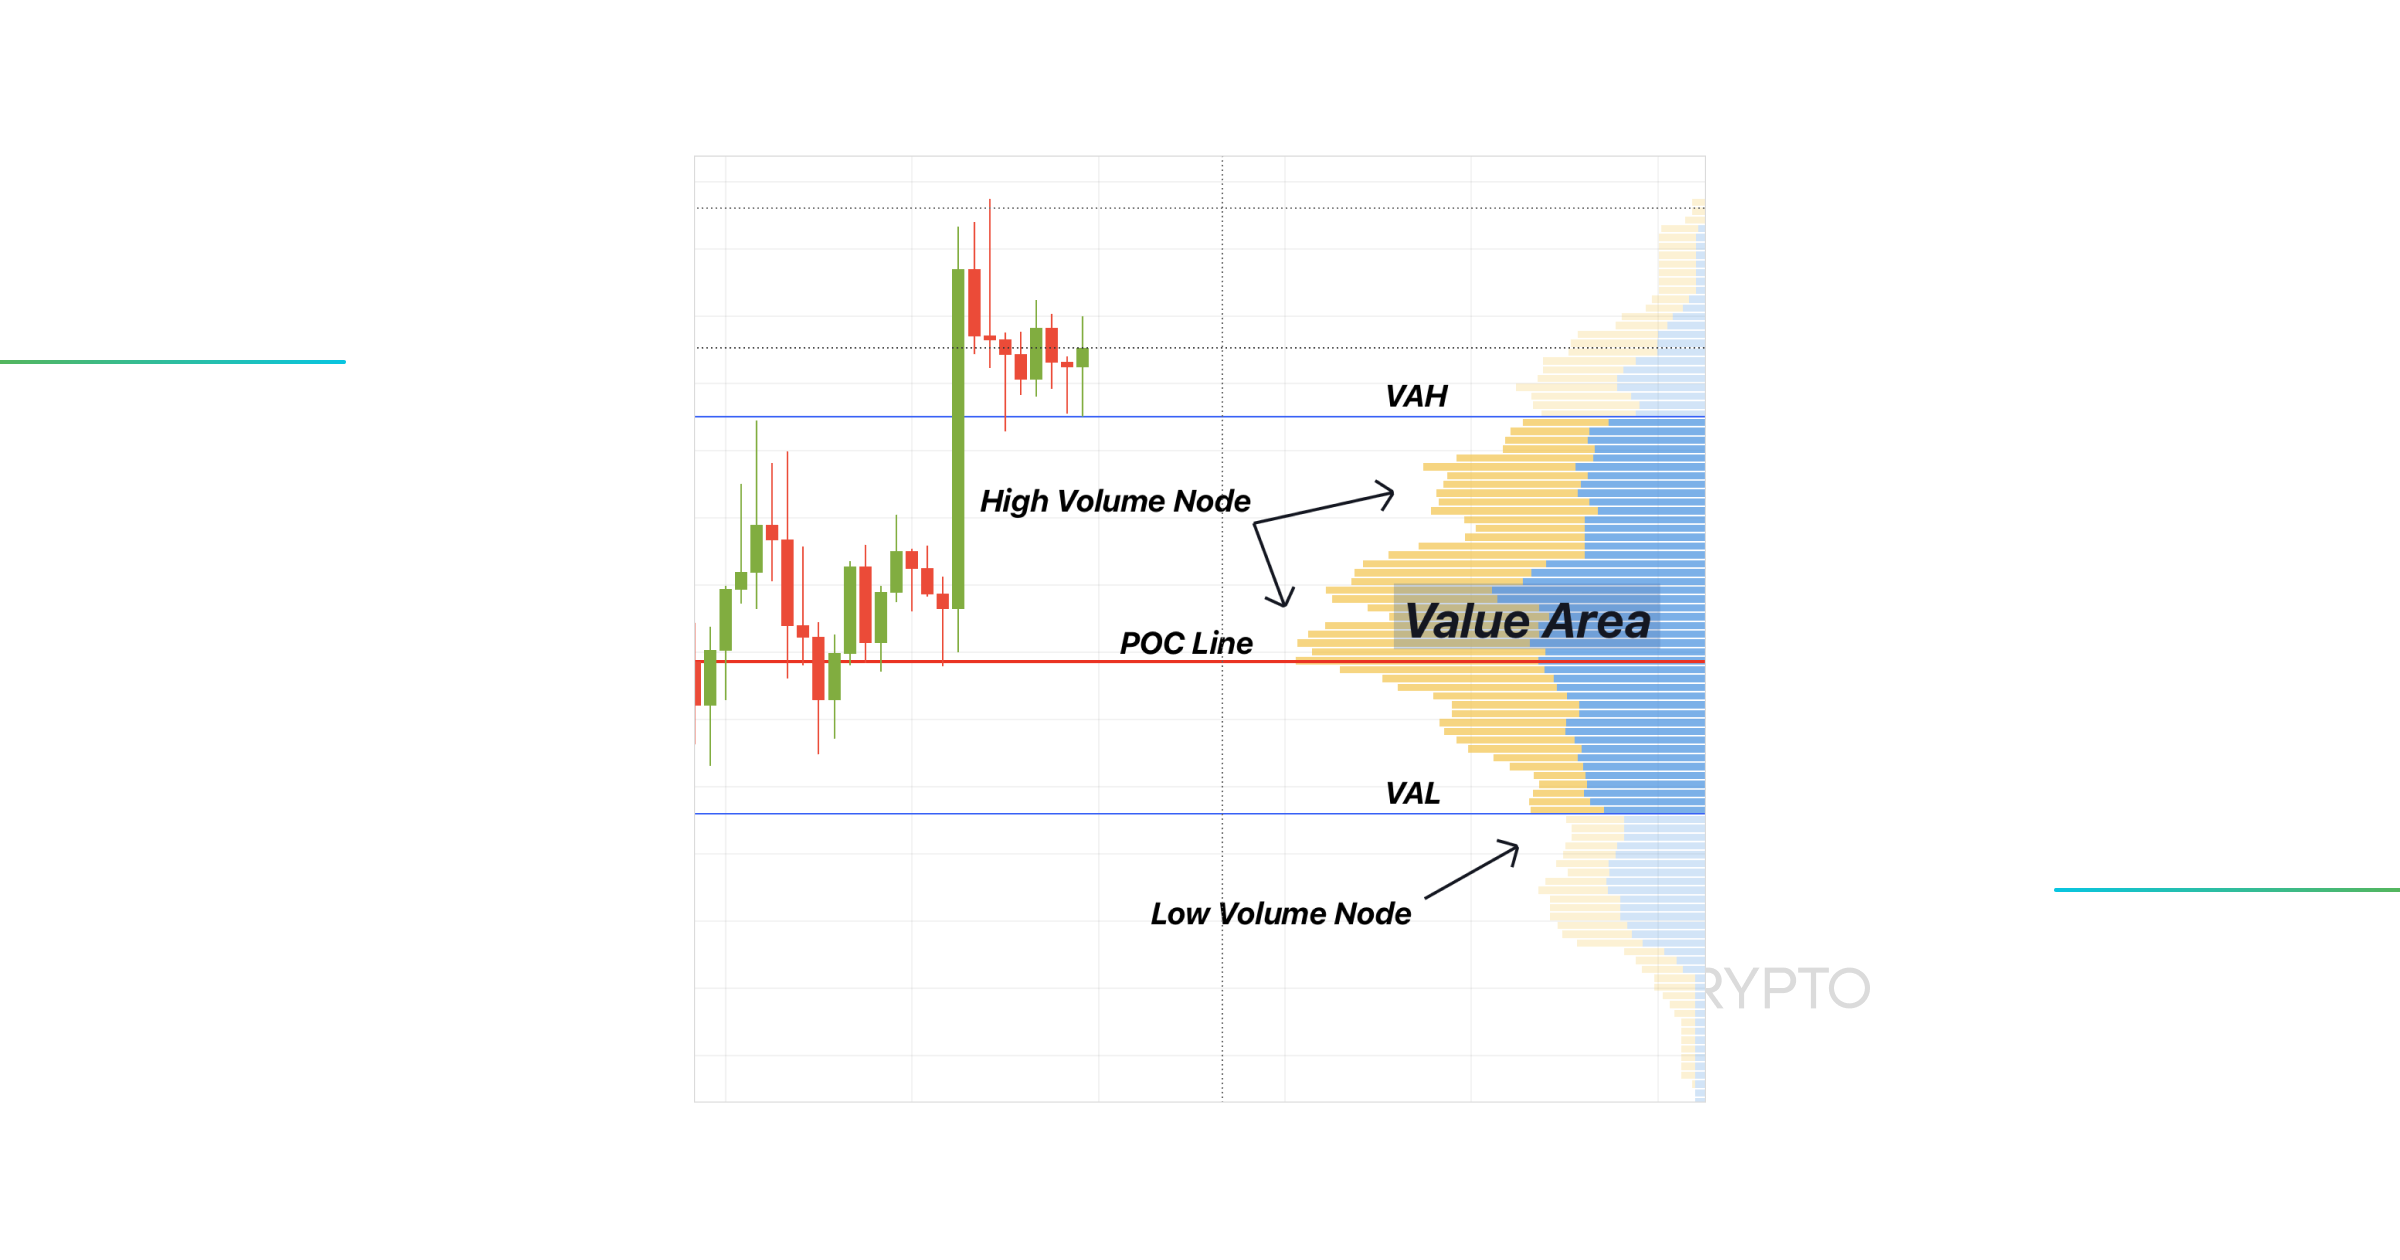
One of the key features of the Volume Profile Indicator is the Value Area, which is a range of prices in which 70% of the total trading volume has taken place. It helps traders identify the most significant price levels where the market has been most active.
The PoC (Point of Control) line represents the price level at which the highest amount of trading volume has occurred.
Other key aspects are the VAH (Value Area High) and VAL (Value Area Low). Their boundaries represent the upper and lower limits of the Value Area, respectively. These levels can help traders identify potential support and resistance levels.
Finally, the HVN (High Volume Node) represents the price levels where there has been a large amount of trading activity compared to the average volume. This information can be useful in identifying areas of high liquidity and potential market turning points.
Overall, the Volume Profile indicator can provide traders with valuable insights into market activity and help them make more informed trading decisions. Read our detailed article about Volume Profile to get the full perspective on this indicator.
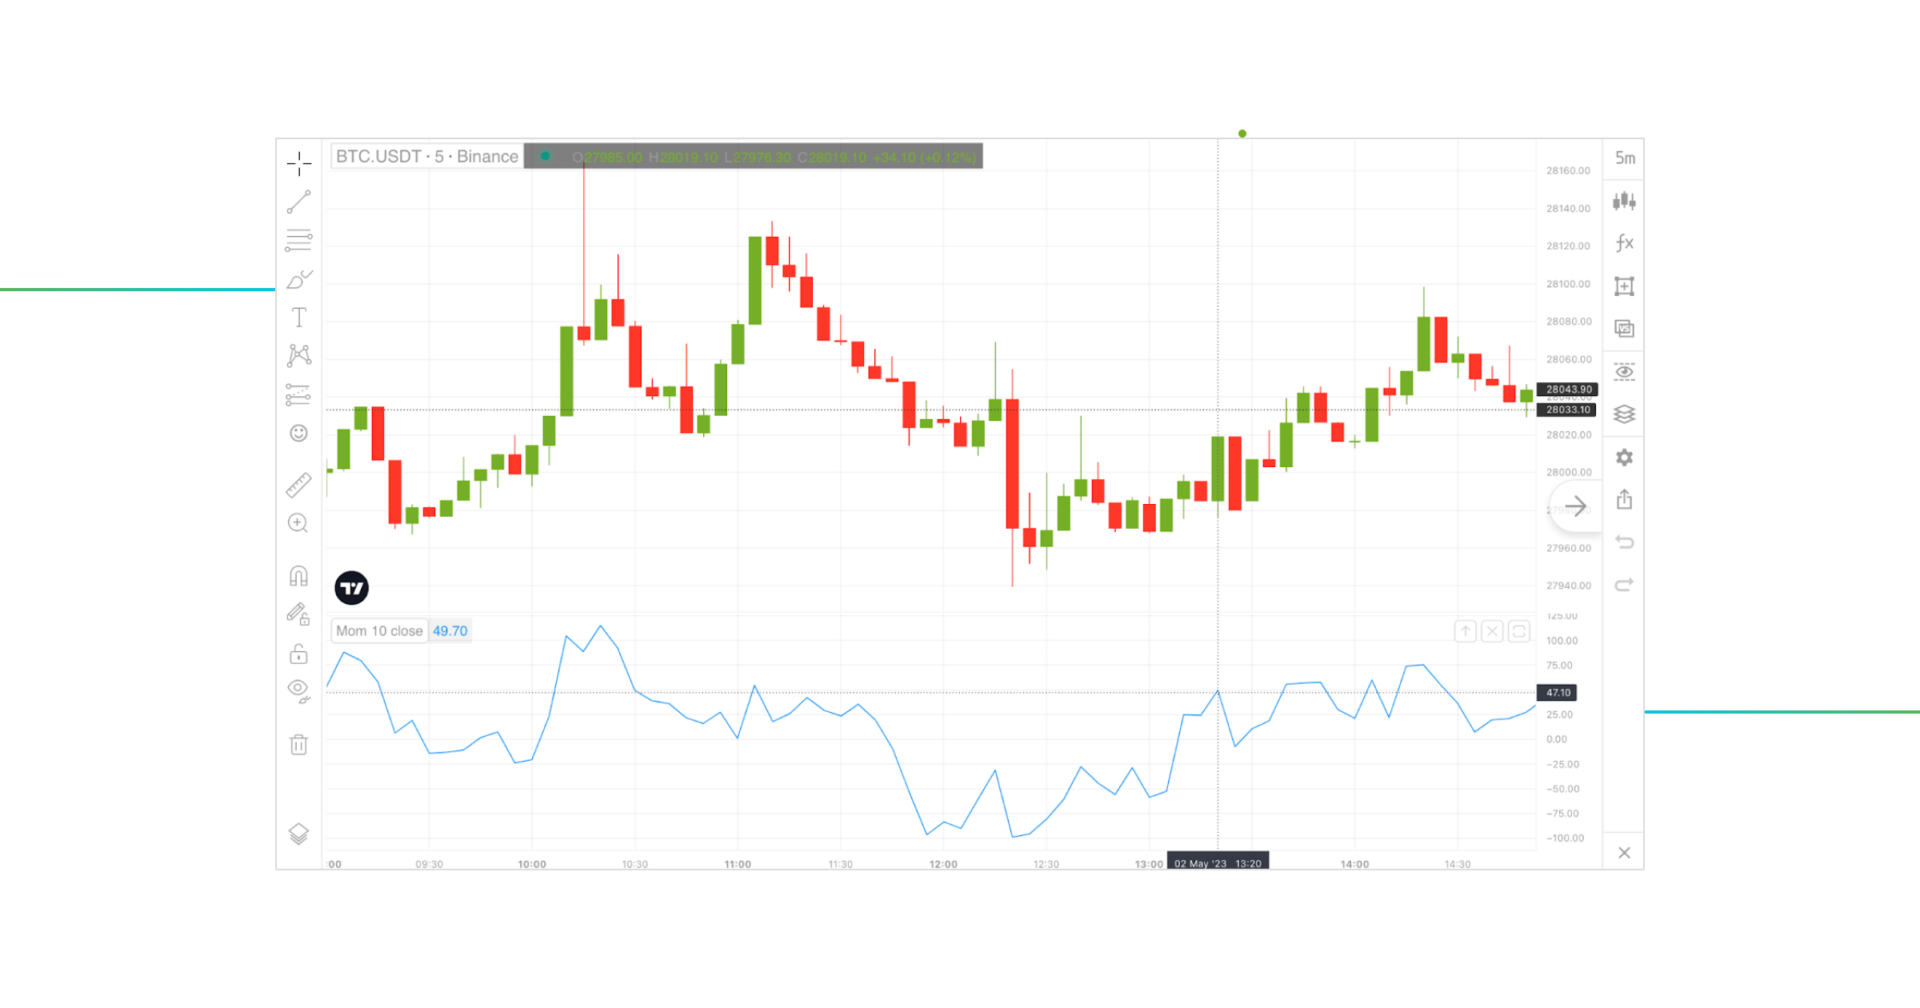
Momentum Indicator (MOM) Overview
Momentum (MOM) is a widely used indicator in crypto trading. It is based on the simple idea that price movements tend to persist in the same direction unless there is some kind of trend reversal.
MOM indicator compares the current price of an asset to its price from a predetermined number of periods ago. If the current price is higher than the price from the selected time, the MOM value will be positive, indicating bullish momentum. Controversially, if the current price is lower than the price from the selected time, the MOM value will be negative, signifying bearish momentum. By analyzing MOM values, traders can gain insight into the strength and speed of price movements, which can help them make better trading decisions.
Momentum Indicator is frequently used by traders to validate trends and pinpoint possible entry and exit points. For instance, a positive MOM value on a cryptocurrency that is already trending up can serve as a tip for a trader to open a long position. However, a cryptocurrency that is already in a downturn may exhibit a negative MOM value, which might indicate an opportunity to open a short position. It’s crucial to remember that MOM is a lagging indicator, meaning it relies on historical price data.
Learn how to use the momentum indicator in our comprehensive guide about Momentum Indicator.
Conclusion
With proper implementation, the 13 best indicators for crypto trading described above can form a complete set of tools for successful cryptocurrency trading experience. However, as it was mentioned, cryptocurrency indicators should not be used in isolation. Also, bundling up too many indicators on a given chart might lead to overanalysis and eventual confusion.
For a successful trading experience, you must, first of all, identify what kind of trader you are, either a day trader or a swing trader. Next, select a set of indicators that are suitable for your trading timeframe as explained in the body of the post. While selecting suitable indicators, ensure to include trend-identifying indicators and those that would offer entry and exit signals. A good combination of these cryptocurrency indicator sets will lead to a successful trading career.
However, always bear in mind that crypto trading is a risky venture with the potential of losing your entire capital. Therefore, never engage in cryptocurrency trading with money that you cannot afford to lose.
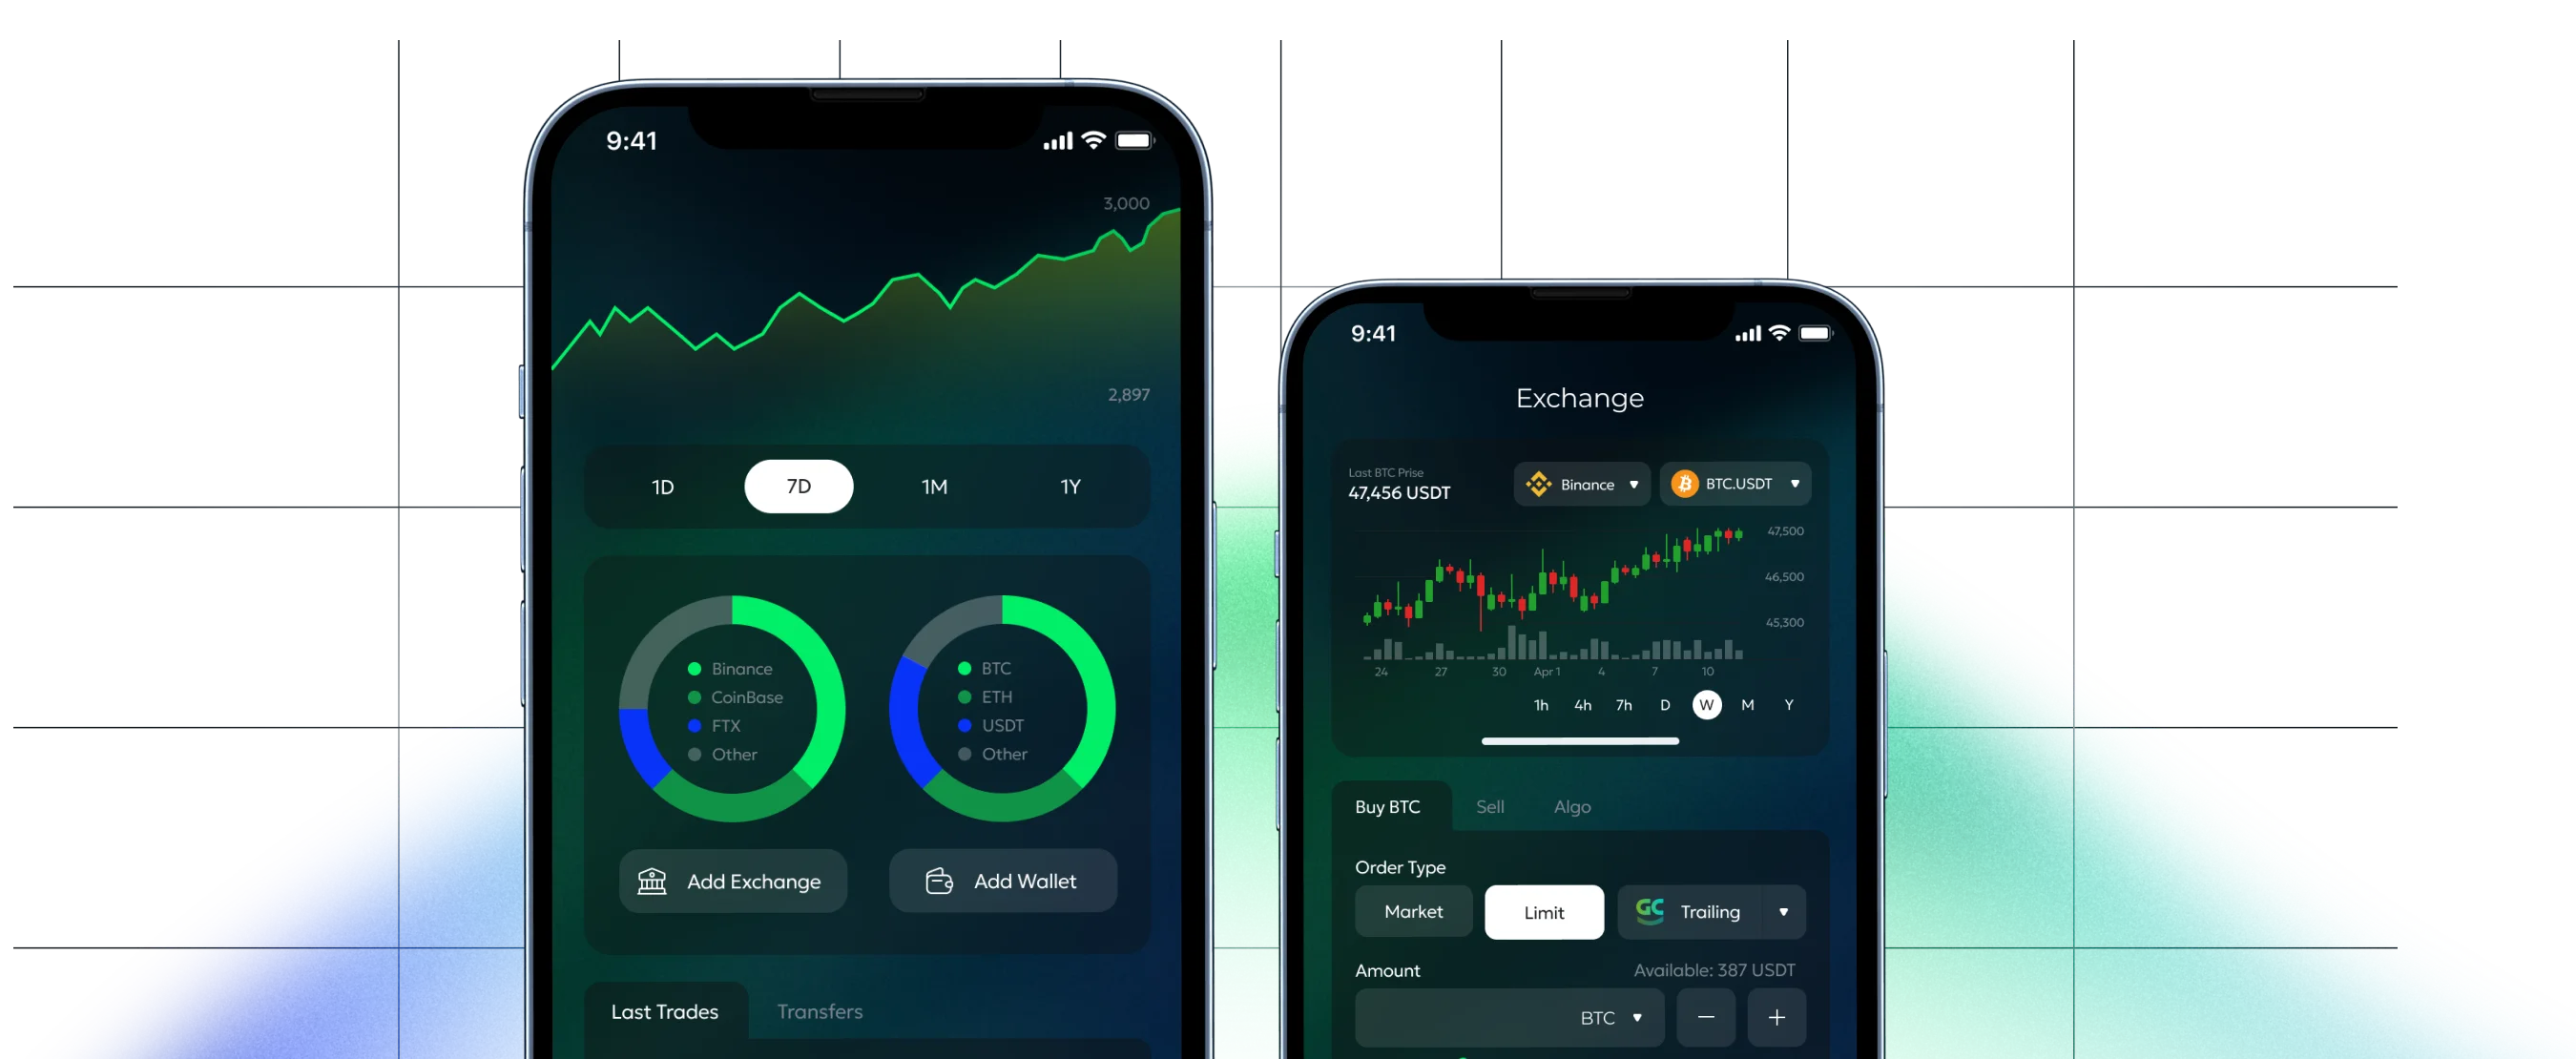
Trading with all these indicators will assist you in interpreting the markets better and aid your decision-making process. In the GoodCrypto app, you can find all the necessary indicators and the best trading tools that will help you make the most out of your trading. Take your trading to the next level with GoodCrypto!