
- 1. What is MACD?
- 1.1. MACD definition
- 2. How is MACD calculated?
- 2.1. MACD calculation
- 2.2. MACD formula
- 3. How to read MACD?
- 4. MACD Сrypto Settings
- 5. How to use MACD?
- 6. MACD Crypto trading strategies for Bitcoin and Ethereum
- 6.1. MACD Crypto trading strategy #1: The MACD histogram and crossovers
- 6.2. MACD Crypto trading strategy #2: MACD Divergences
- 6.3. MACD Crypto trading strategy #3: MACD vs RSI trading strategy
- 6.4. MACD vs Stochastic trading strategy
- 7. Summing up
- 8. Trade with MACD in Good Crypto
With a bit of imagination, the MACD indicator might look like a rollercoaster, don’t you think? The strong market movements might feel exactly like that! The high volatility of the cryptocurrency markets can be overwhelming.
In this article, we will look into the Moving Average Convergence Divergence or MACD for short. An indicator that can give you a lot of extra insight when looking at price movements. We’ll be explaining how the indicator helps you to make the right decisions.
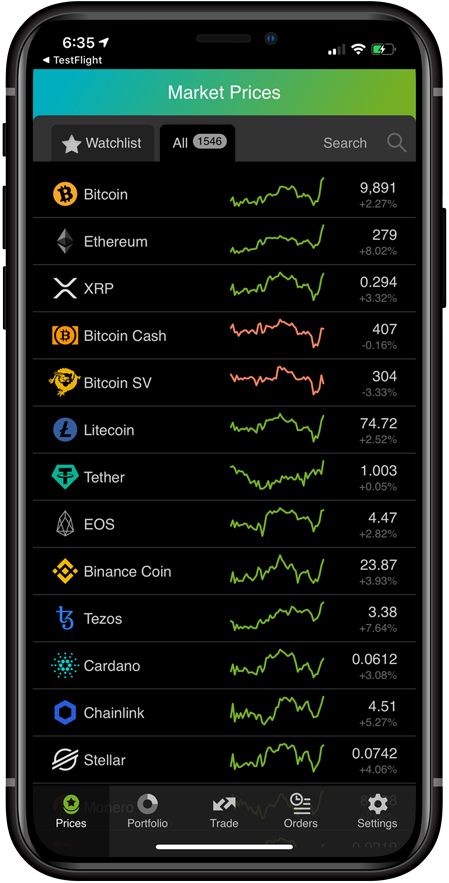
The MACD indicator is available in Good Crypto. The free app is not only a great portfolio manager, it also provides you with professional charts and indicators for every crypto market you can imagine.
If you haven’t, it’s recommended to read our previous articles on, for example, Portfolio management, the RSI indicator, Moving Averages, or Bollinger Bands.
What is MACD?
To start, what does MACD stand for?
MACD indicator means Moving Average Convergence and Divergence. These terms might sound familiar if you have read our article on Moving Averages already.
From now on, we will refer to the Moving Average Convergence and Divergence as MACD. This article aims to have the MACD explained so that you can read and use it.
MACD definition
The Moving Average Convergence and Divergence is an indicator that follows the trend, showing its momentum and the relationship between two moving averages.
A momentum indicator is used to give you an idea of how overbought or oversold a market condition exactly is.
Convergence and divergence are the visual discrepancies between the price and the indicator, or in this case the moving averages of the indicator.
This is the MACD meaning in short. Stay with us, because this guide has the MACD indicator explained in detail!
How is MACD calculated?
MACD calculation
How to calculate the MACD? Although you will never need to change the settings of this indicator, nor calculate MACD, still, it’s useful to know the mathematics behind it.
When calculating MACD the 26-period Exponential Moving Average (EMA) is subtracted from the 12-period EMA.
Read our guide on MA’s, EMA’s, and WMA’s to get an understanding of Moving Averages!
MACD formula
MACD = 12 Period EMA − 26 Period EMA
A period means a candle. When looking at a daily chart, one candle represents 24 hours of trading. 12 periods would in that case represent 12 days.
How to read MACD?
Moving on to the important part… How to read the MACD chart?
We won’t have to change any settings, so the basic settings will be the best MACD settings for day trading, long-term investing, or any other interaction with the market you want to make based on MACD charts.
Let’s break down our “rollercoaster” indicator once we have enabled it in the Good Crypto application.
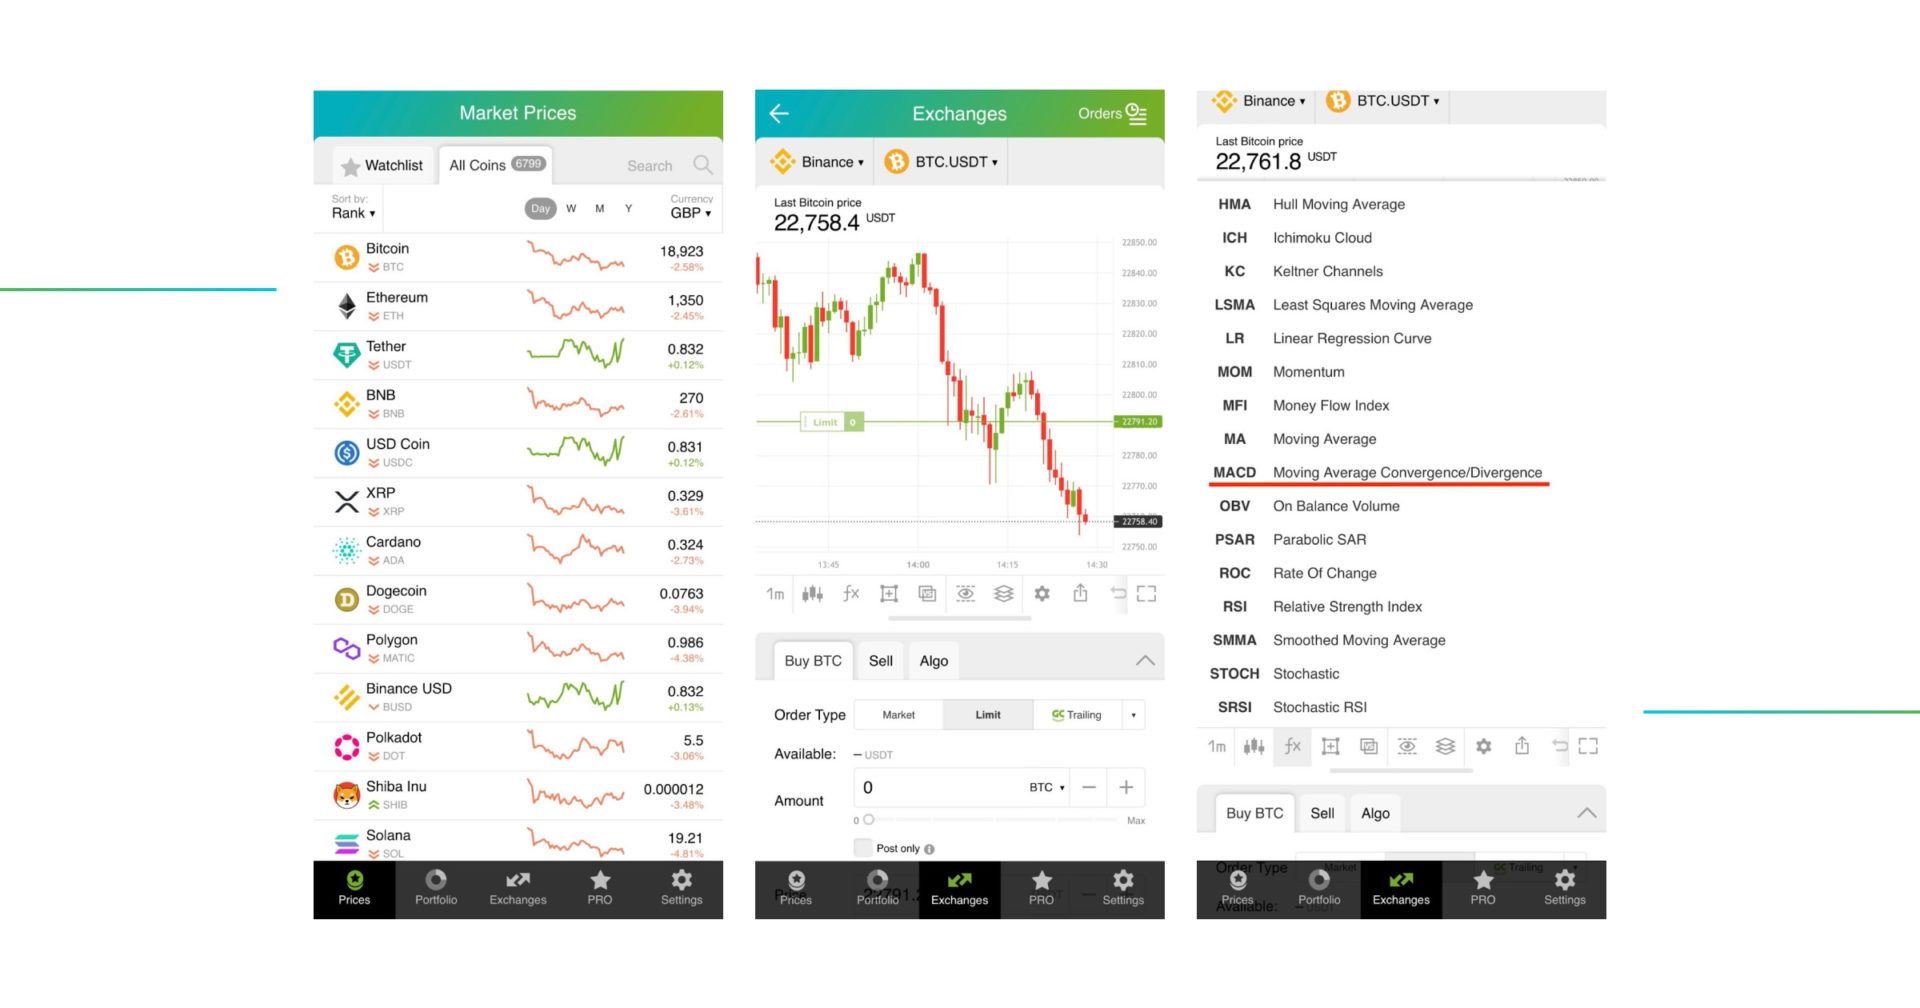
Open the Good Crypto app → Head towards the Exchanges section → Once there, tap the “fx” button to open the long list of indicators.
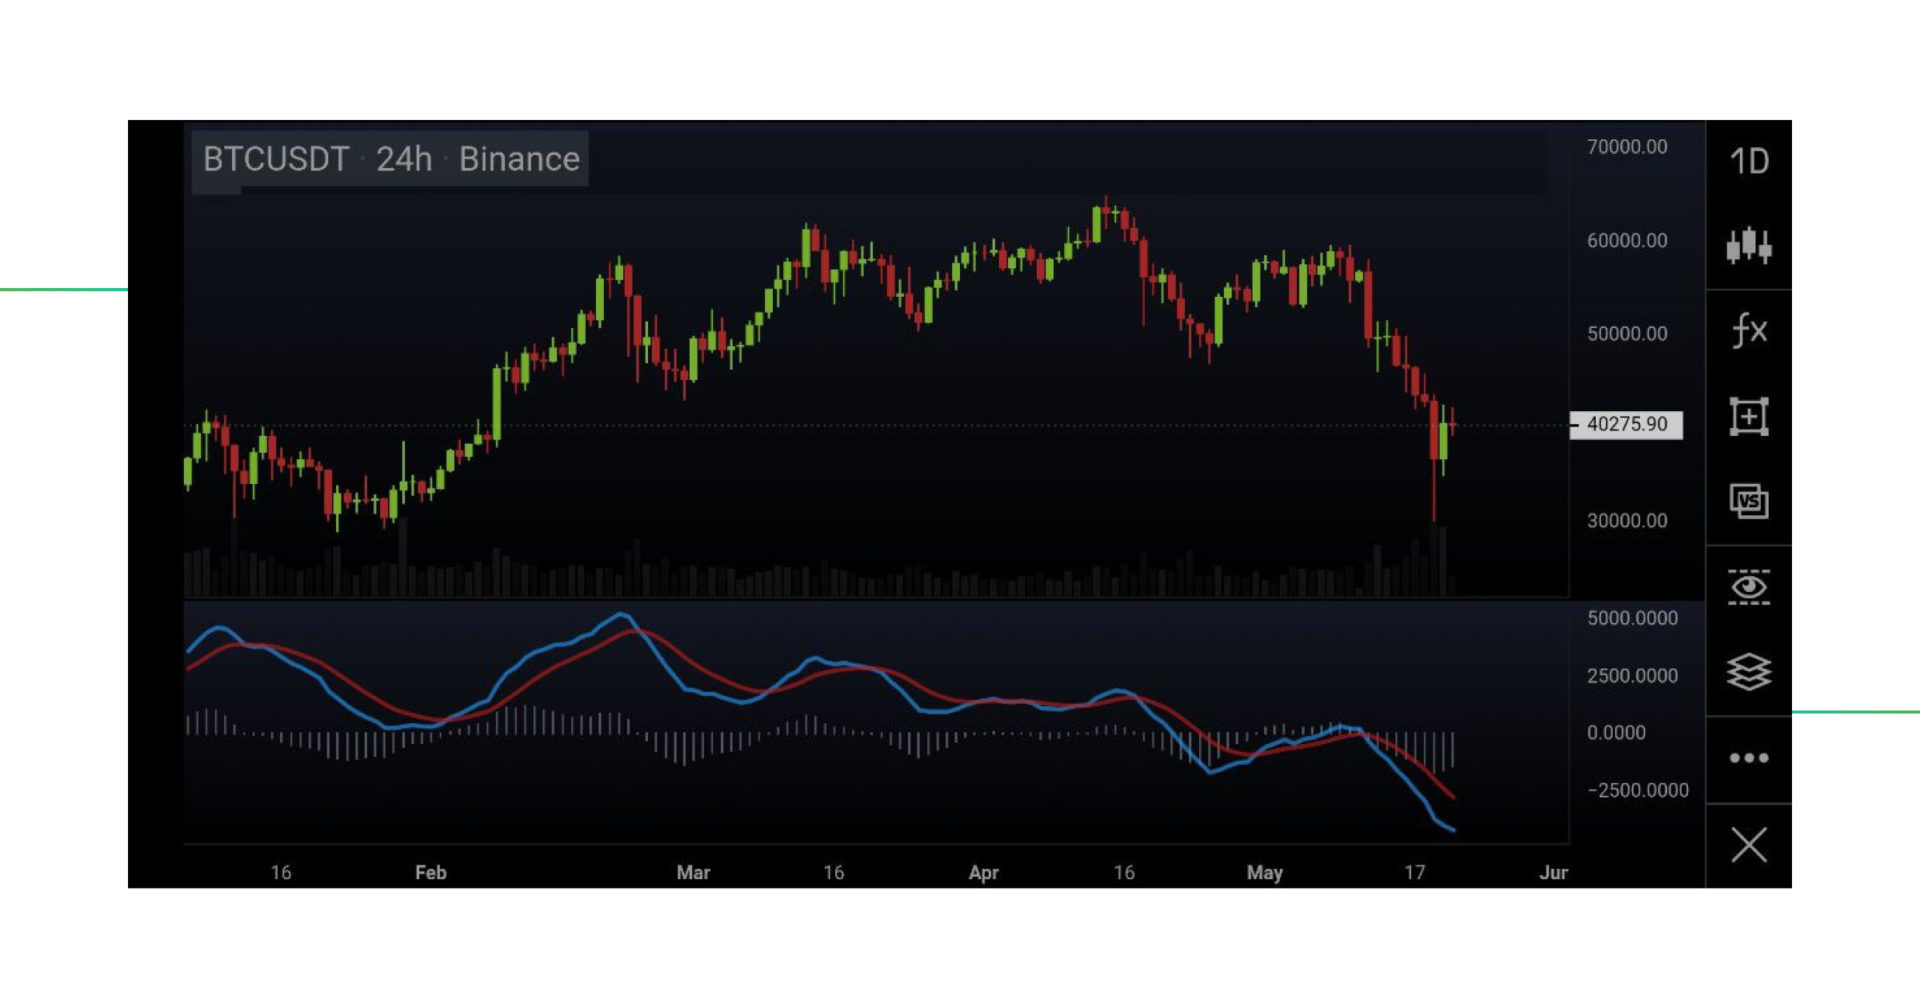
We now have the daily BTC/USDT chart with the MACD indicator on Binance.
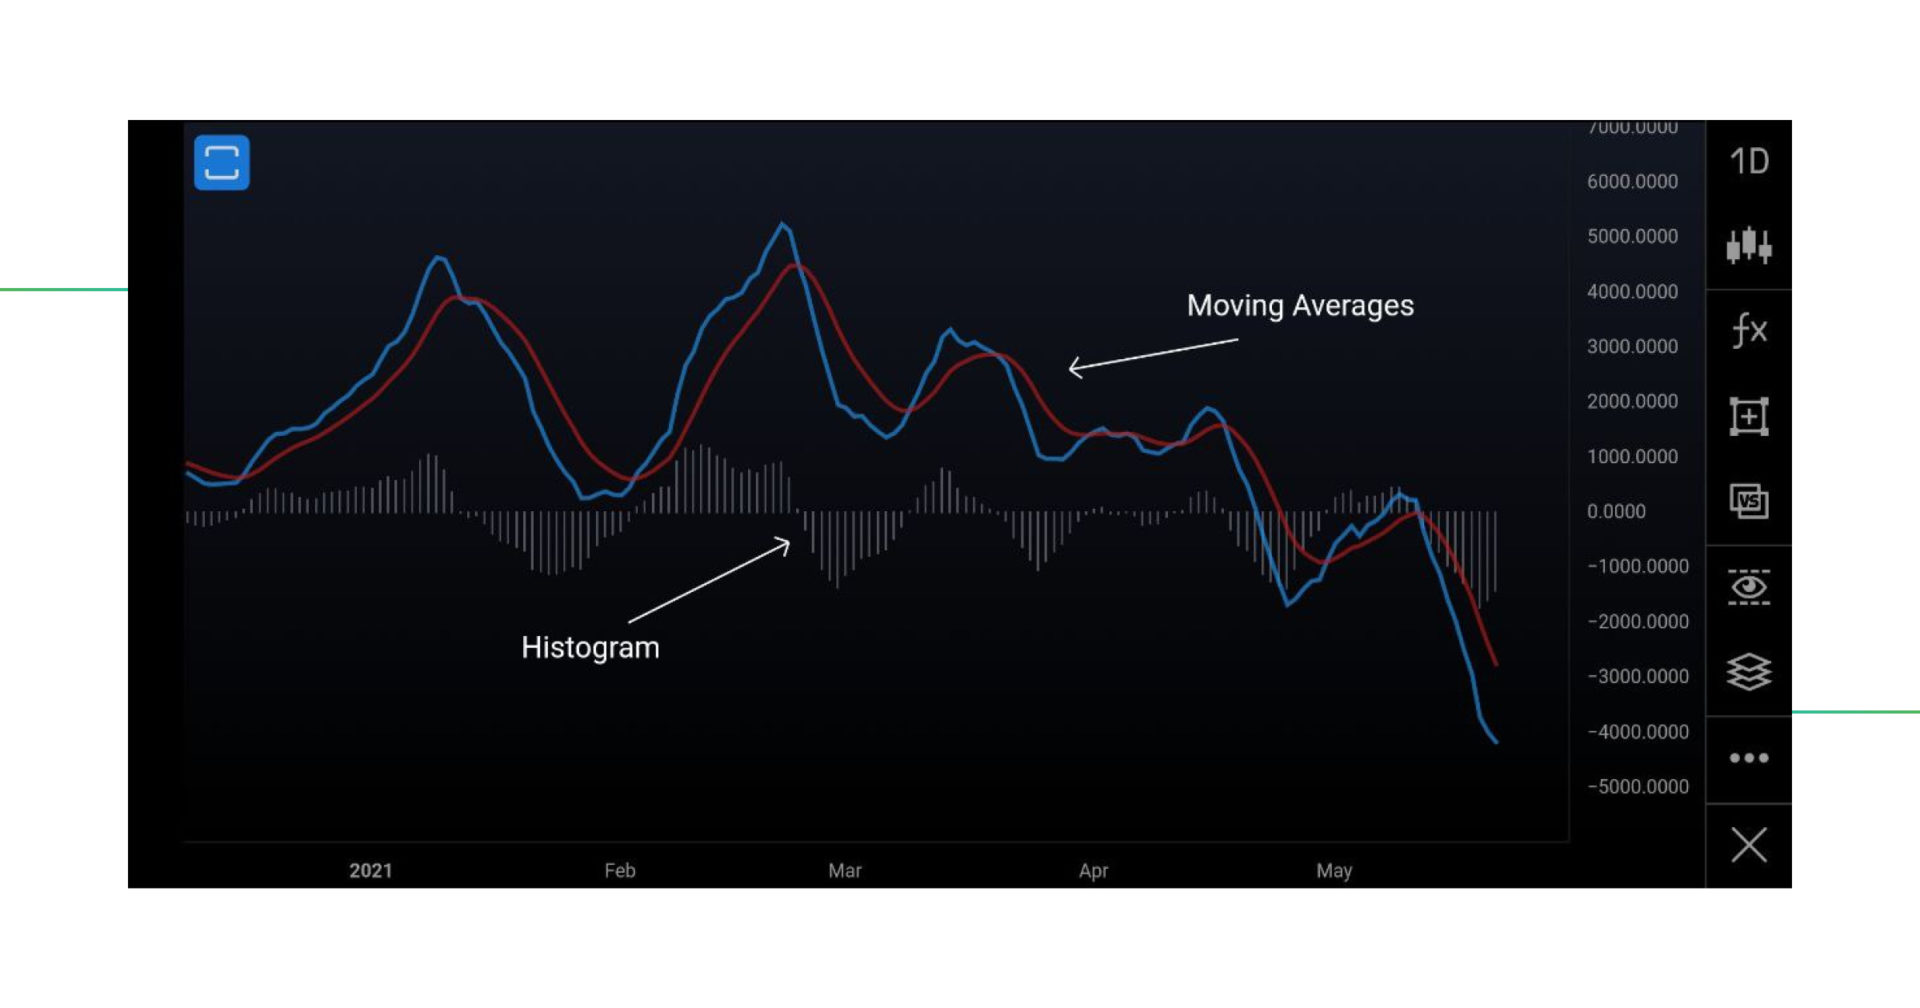
Double-tap the field of the indicator to make it full-screen sized. Now, we can see both the Moving Averages and the Histogram. The blue line represents the 12-MA and the red one the 26 MA.
We have explained the calculation of the moving averages above, but what is the histogram? The histogram indicates the distance between both of the moving averages.
MACD Сrypto Settings
The MACD indicator uses the 12 and 26-period MA’s standard. These settings are never changed and it is best to keep them this way. Remember, indicators also work better when most people are seeing the same signals. That’s why it’s advised to keep the bitcoin MACD crypto settings always at 12 and 26.
This means that every MACD you see is similar. The Binance MACD is the same as the Kraken MACD, the Ethereum MACD is the same as the amazon stock MACD, and so on.
How to use MACD?
To see signals and potentially make trades, it’s important to understand how to use the MACD indicator.
How does MACD work?
Looking at the Moving Averages we can immediately see crossovers. These will play an important role in the use of the MACD indicator.
When making a MACD technical analysis, the most simple way to look at it is by stating that crossovers are sell and buy signals.
When the blue line crosses from under to above the red line, it’s a buy signal. When the red line crosses from under to above the blue line, it’s a sell signal.
Convergence and divergence between MACD and an asset’s price is an important MACD signal to watch for.
Let’s take a closer look at how to use MACD to trade!
MACD Crypto trading strategies for Bitcoin and Ethereum
Many experienced technical analysts have at least once seen or applied MACD trading. It’s a very well-respected and useful indicator that has proven to work on many occasions.
Like any strategy, the MACD strategy should be paired with proper portfolio management and responsibility. After all, not a single strategy is 100% accurate all the time.
Learn how to use the Bitcoin Moving Average in our article on MA’s!
MACD Crypto trading strategy #1: The MACD histogram and crossovers
What is the MACD histogram? As mentioned above, the histogram indicates the distance between both of the moving averages. This is how to read the MACD histogram.
The MACD histogram crossover shows the same crossover as the one seen in the Moving Averages. It’s the most basic yet very effective indication for a sell or a buy when using the MACD in a MACD histogram strategy. This means that the MACD histogram trading strategy is based on the same crossover as the Moving Averages indicate.
MACD histogram trading is fairly simple. Take a look at the chart we had before, and spot the crossovers.
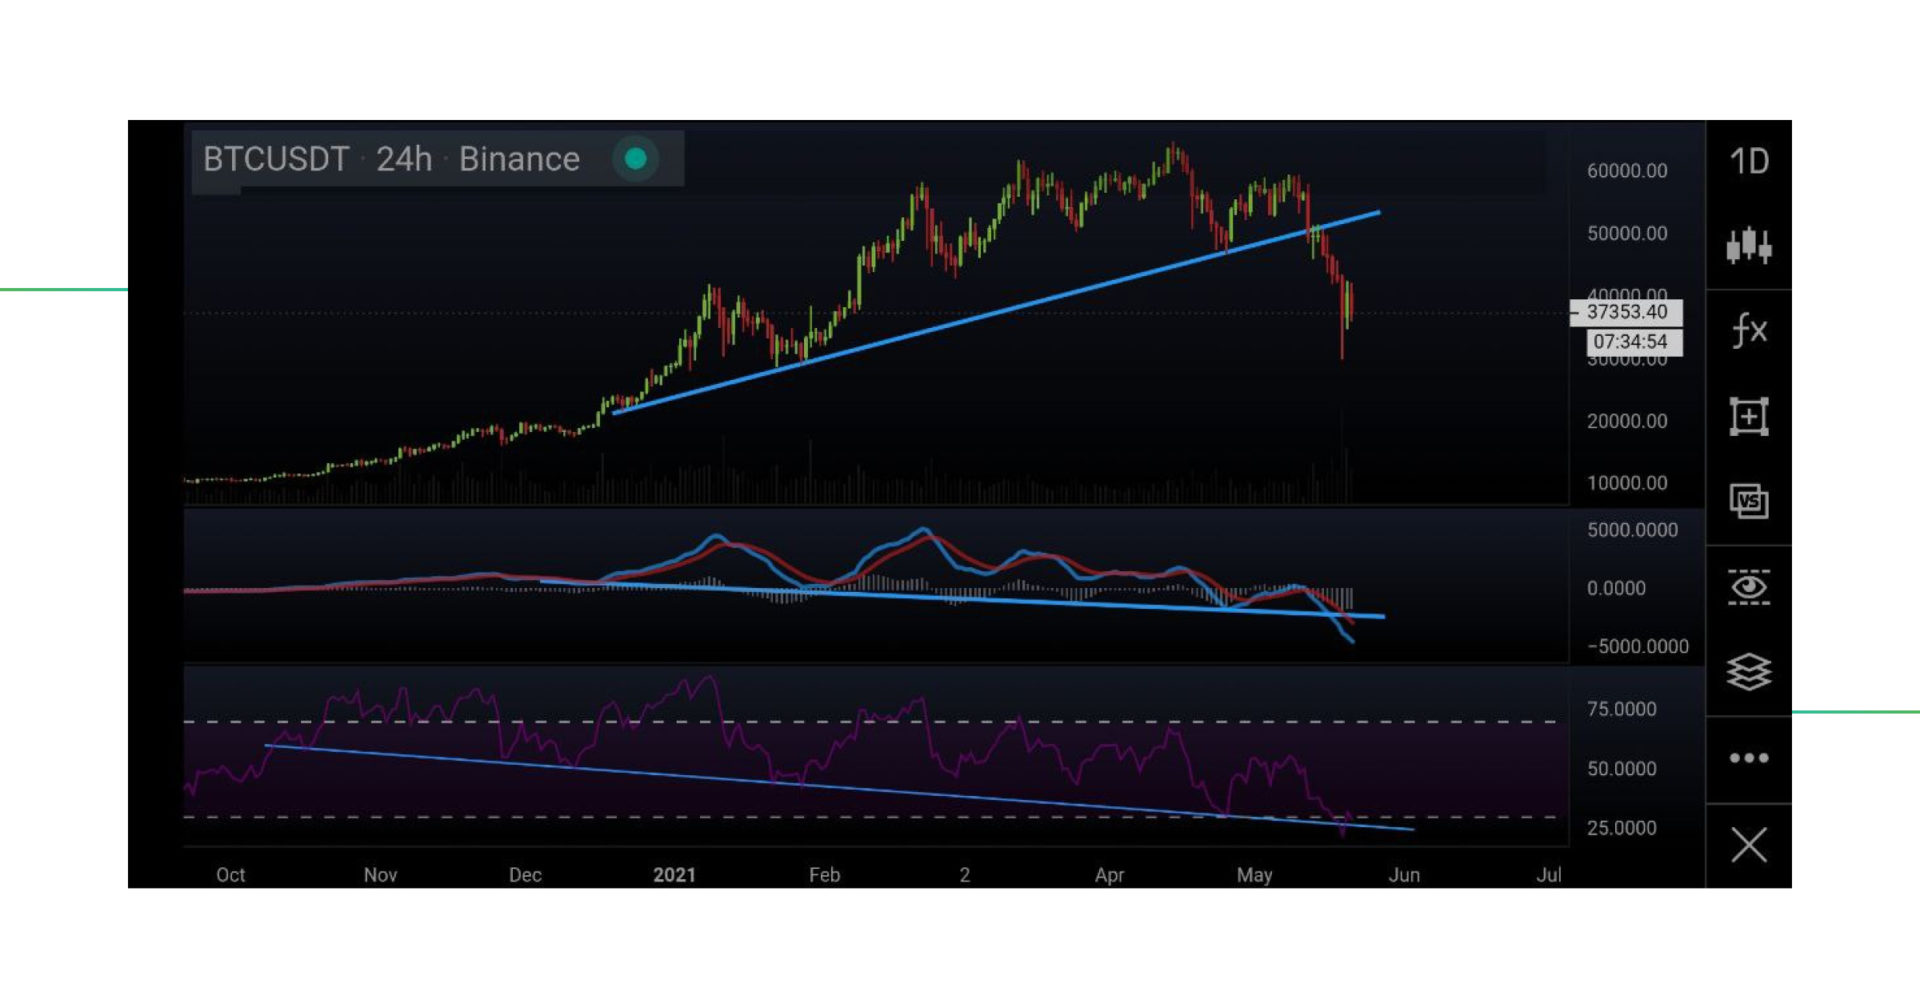
When the Moving averages cross, the histogram will also cross. The crossovers indicate a change in momentum. Next, we’ll look at the price chart combined with the indicator to get a better idea.
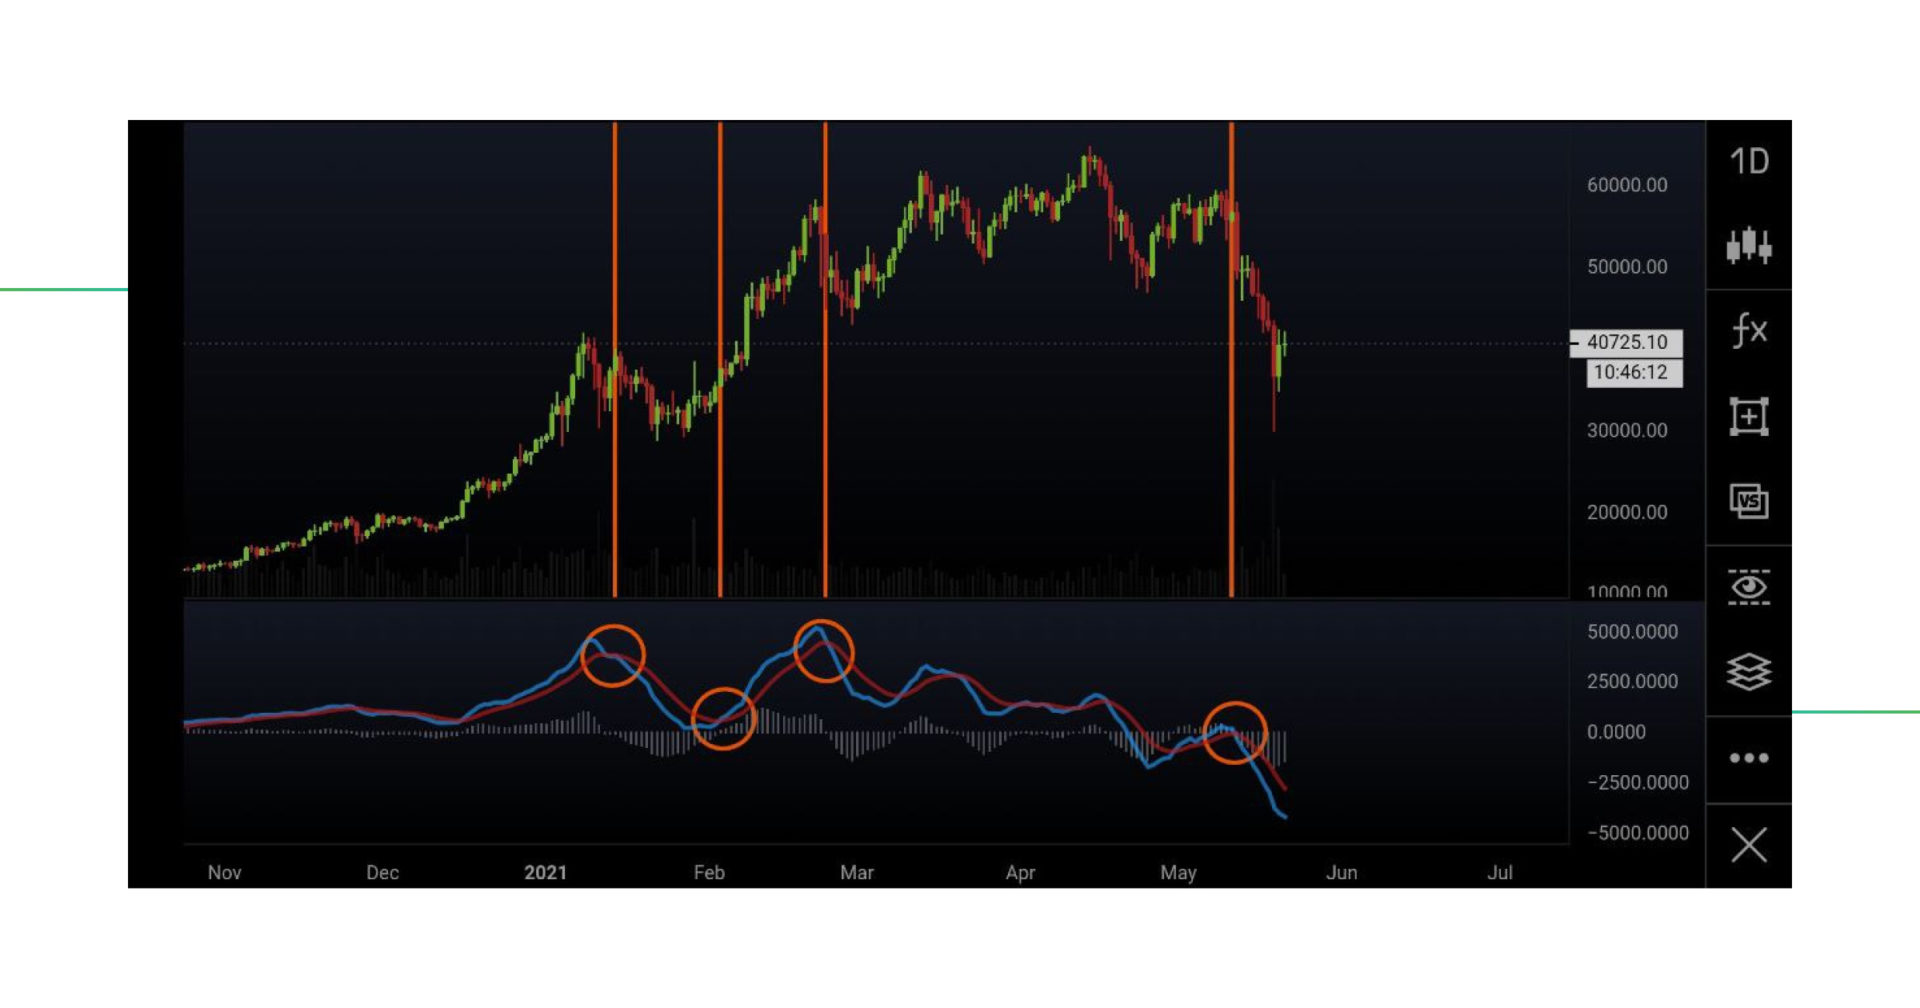
The vertical lines show exactly the moment the MACD crossed. The first three crosses are as follows: Bearish, then bullish, and finally bearish again. The fourth indication and the last cross that happened on this BTC/USD daily chart has the strongest bearish price action attached to it. From the moment of crossing to the trough of the drop, there was a drop of nearly 50%.
A crossover is a tipping point when buyers or sellers change their position in the market. Like a pendulum, momentum swings from one direction to the other, bullish or bearish.
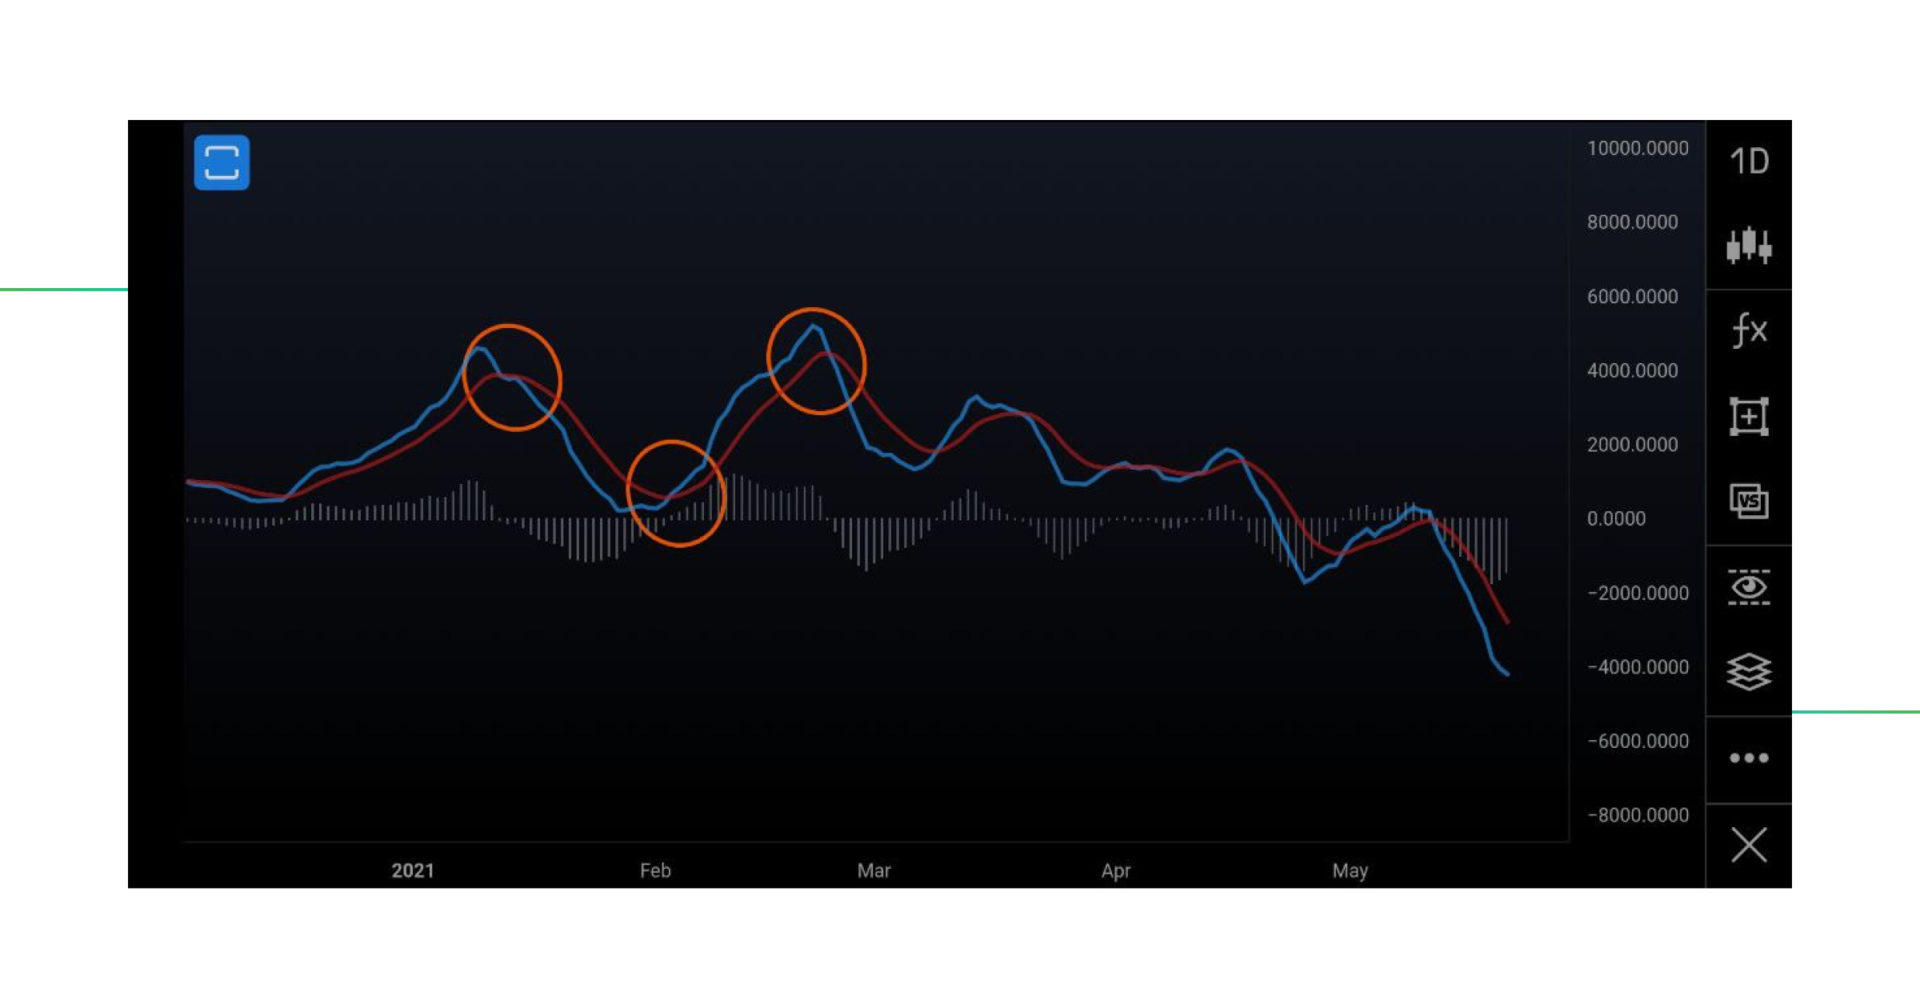
If you remember our RSI article, you might be spotting some MACD histogram divergence in the example above.
MACD Crypto trading strategy #2: MACD Divergences
Moving Average Convergence Divergence MACD, as the name suggests, indicates Convergence and Divergence.
As a reminder: Convergence and divergence are the visual discrepancies between the price and the indicator, or in this case the moving averages of the indicator.
We can either have a bearish divergence MACD or a MACD bullish divergence, depending on the type of divergence MACD is showing us.
Also, we can have bearish convergence and bearish divergence, as explained by the chart below.
How can we create a MACD divergence strategy? For this, we need to understand how a MACD bearish divergence or bullish divergence MACD is created.
Think of it like this, the momentum indicator shows the strength of price movements. Price momentum means the price is going in a certain direction with a lot of force. At a certain point, the momentum will switch from bull to bear or bear to bull.
The history of these movements is registered in the MACD indicator. Every peak of momentum, either negative or positive, becomes an outer point of the indicator. The peaks of bullish and bearish momentum become tops and bottoms of the indicator. These tops and bottoms show the intensity of the momentum.
For example, when a series of tops form a descending trend, the momentum is dropping. When a series of bottoms form an ascending trend, the momentum is increasing.
What is MACD trading at this point? It means analyzing the trend and its momentum and then comparing it to the price action to spot divergence or convergence.
Then, the MACD divergence indicator is used by comparing this momentum with the price action.
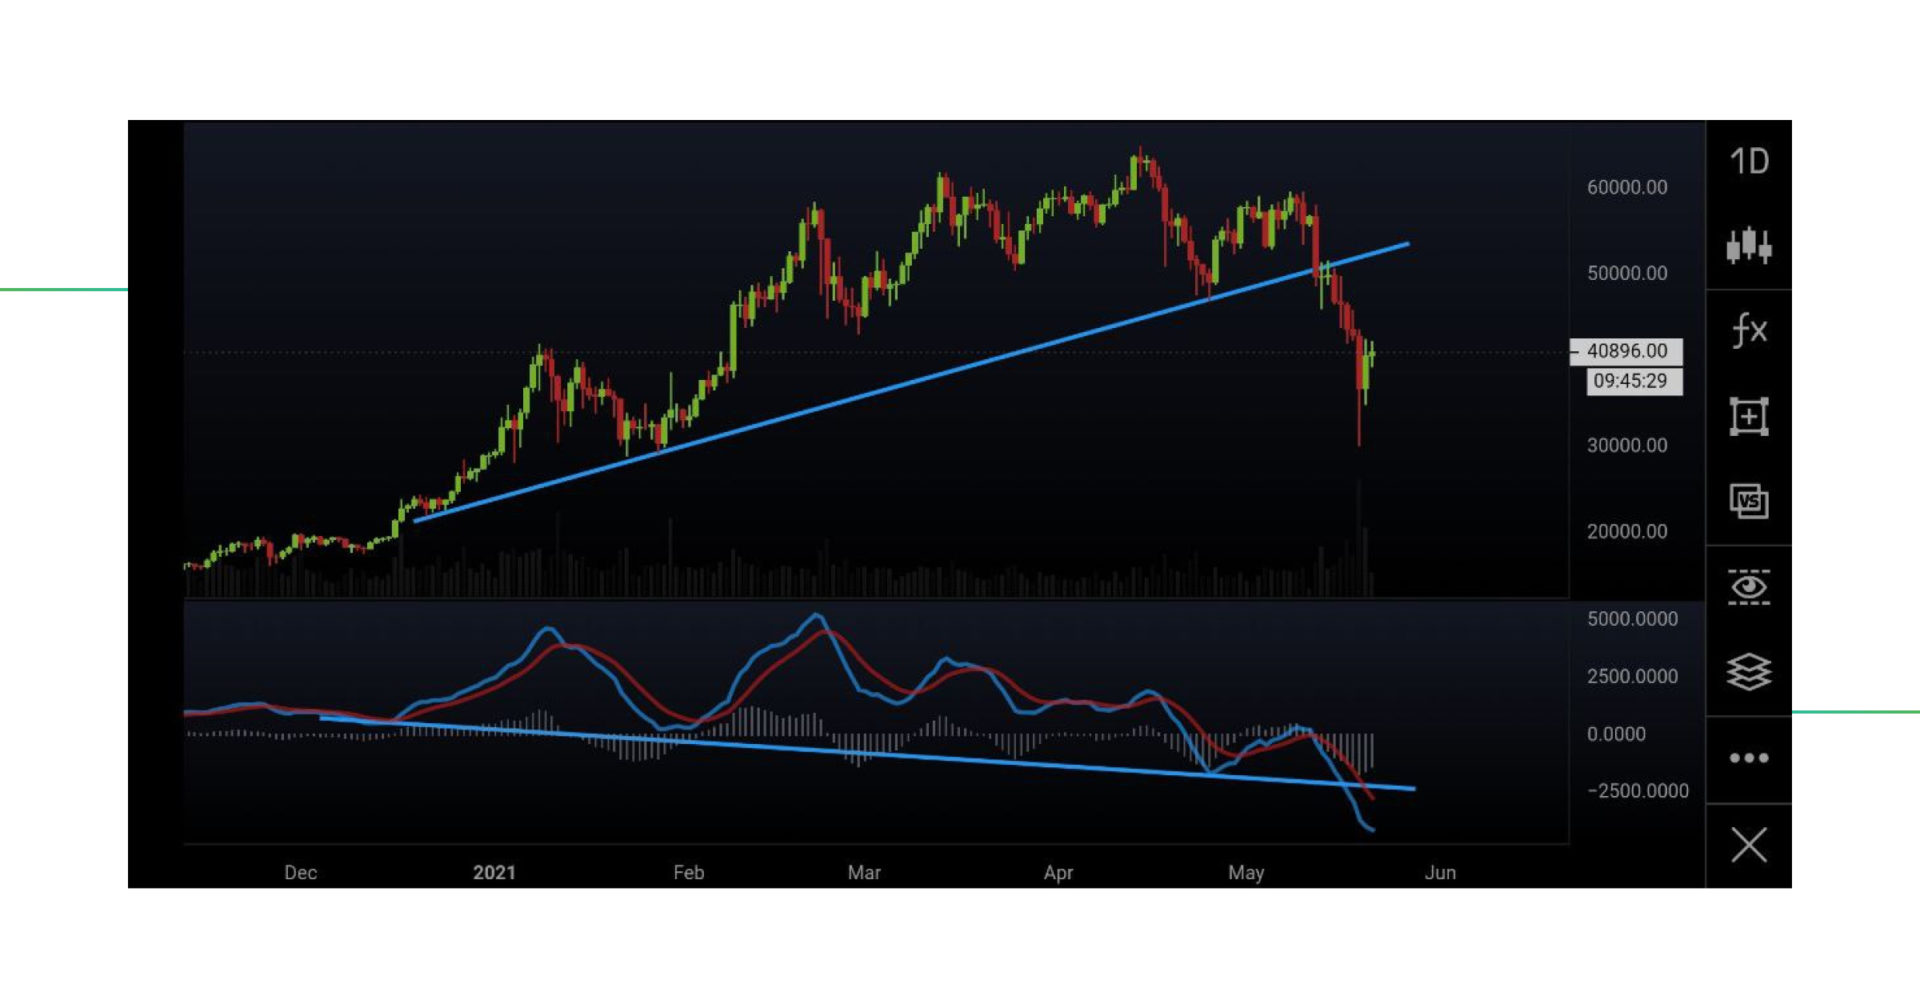
To conclude: this chart shows negative MACD divergence.
- Divergence is when the price makes a higher high or a higher low, and the indicator makes a lower high or a lower low in the meantime.
- Convergence is when the price makes a lower high or a lower low, and the indicator makes a higher high or a higher low in the meantime.
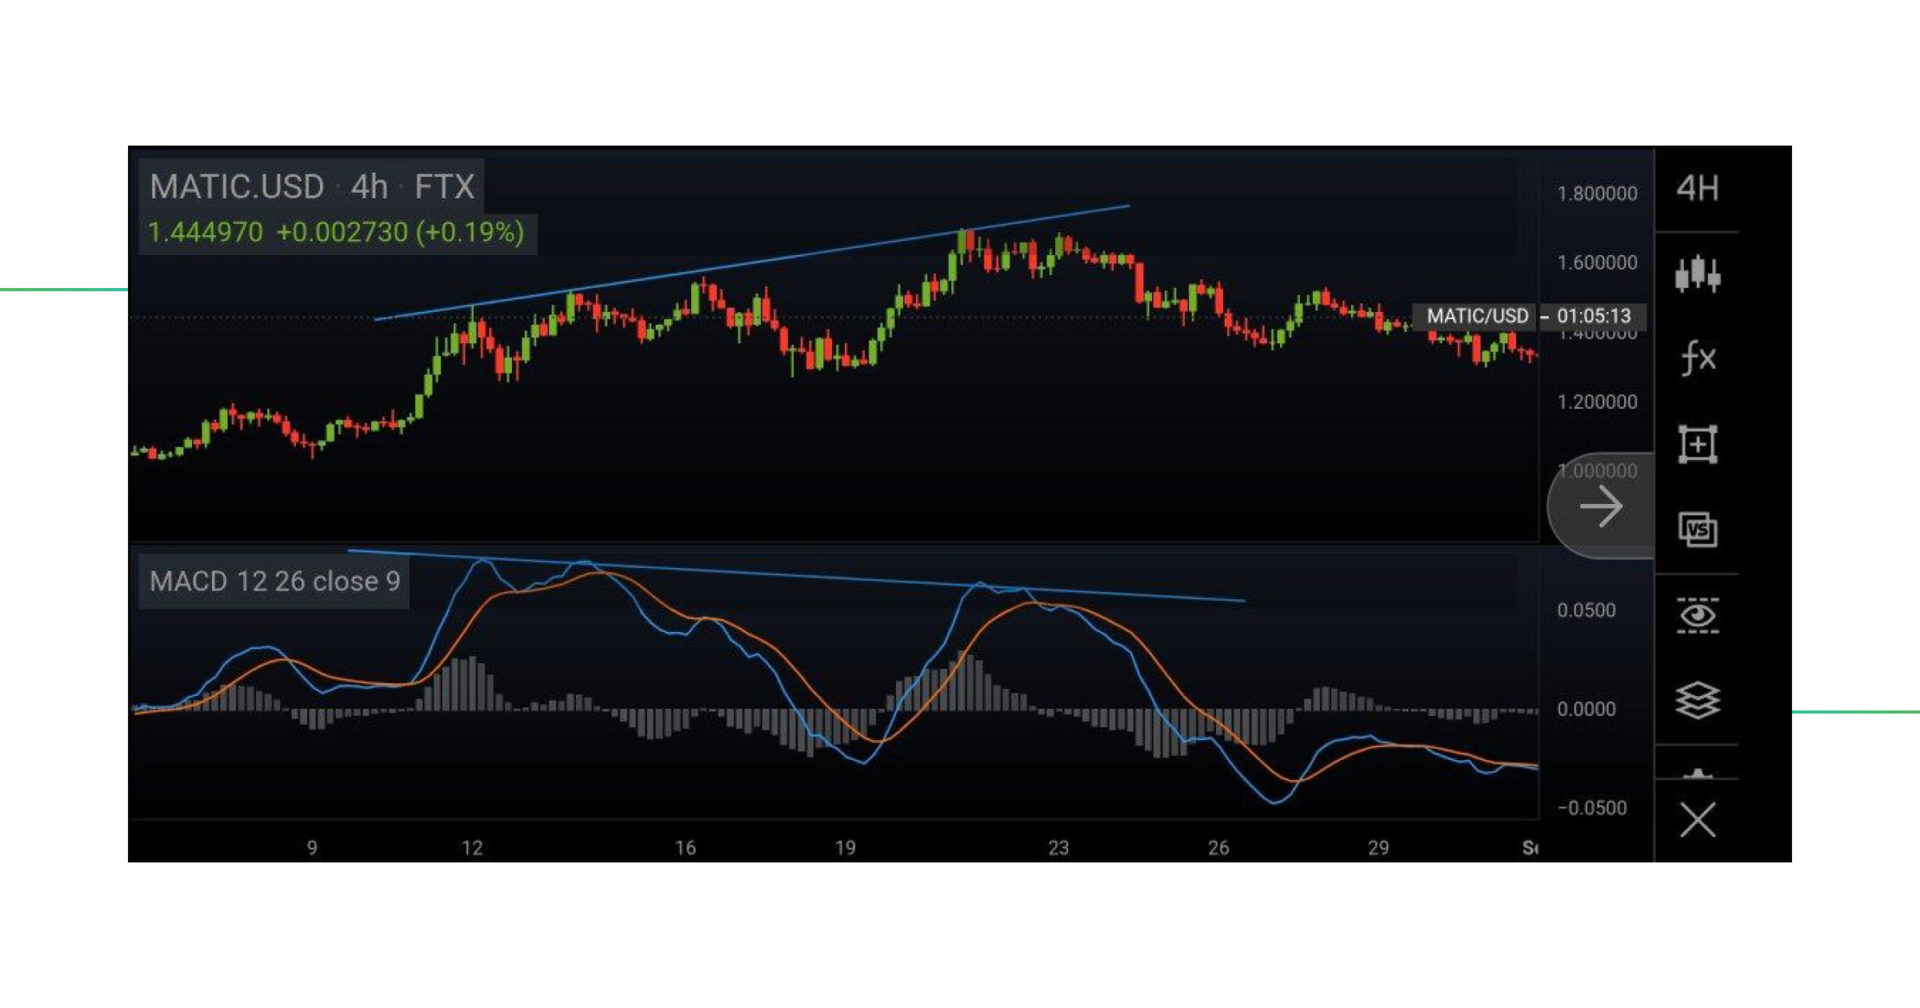
In this example of MATIC/USD, we see a sell signal because of the higher high in price, but a lower high in the MACD indicator. This divergence played out, and the price moved from above $1.6 to $1.3.
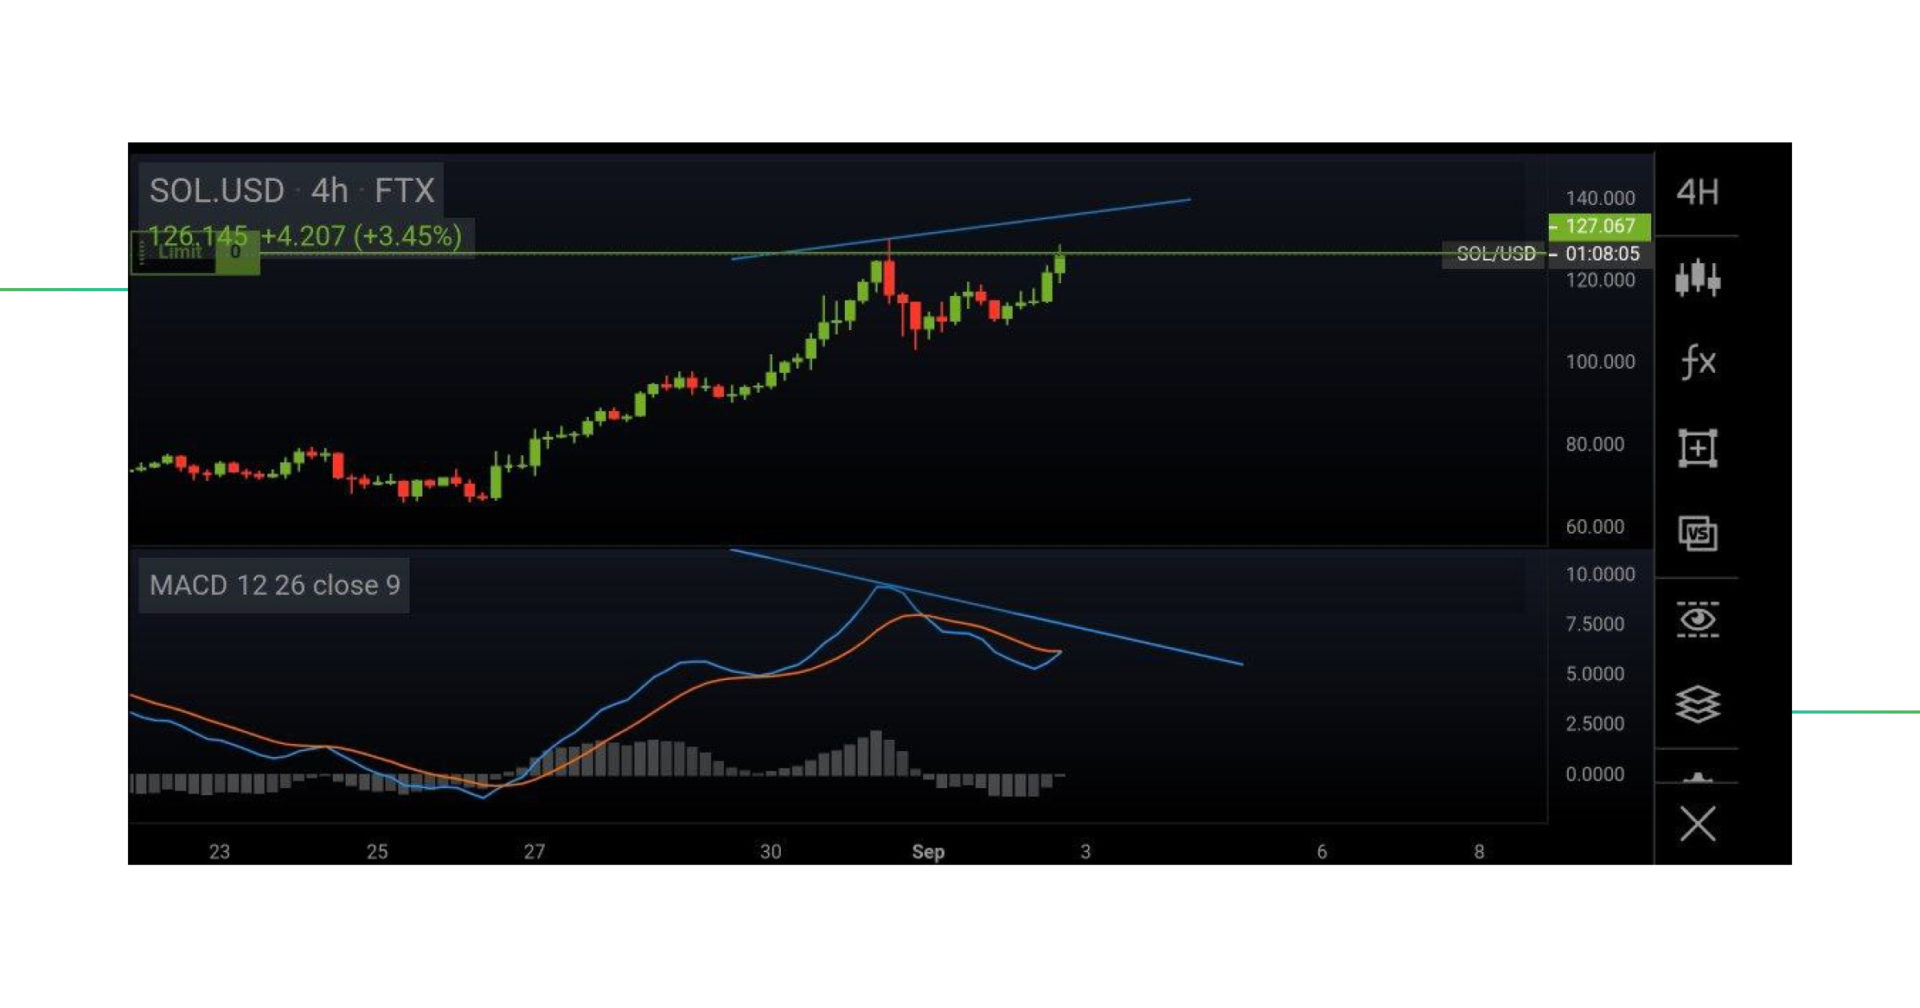
The last example shows how a potential scenario can happen. A trader can see that IF the price makes a higher high, but the MACD makes a lower high, there is divergence. So, if the trader follows the chart and the indicators, he knows ideally the MACD goes higher as before, to show the market is still strong enough and continue the trend. A lower high in the MACD would indicate weakness on the buying side and a potential reversal.
Visualized in a simple chart we see the rules of Divergence and Convergence:
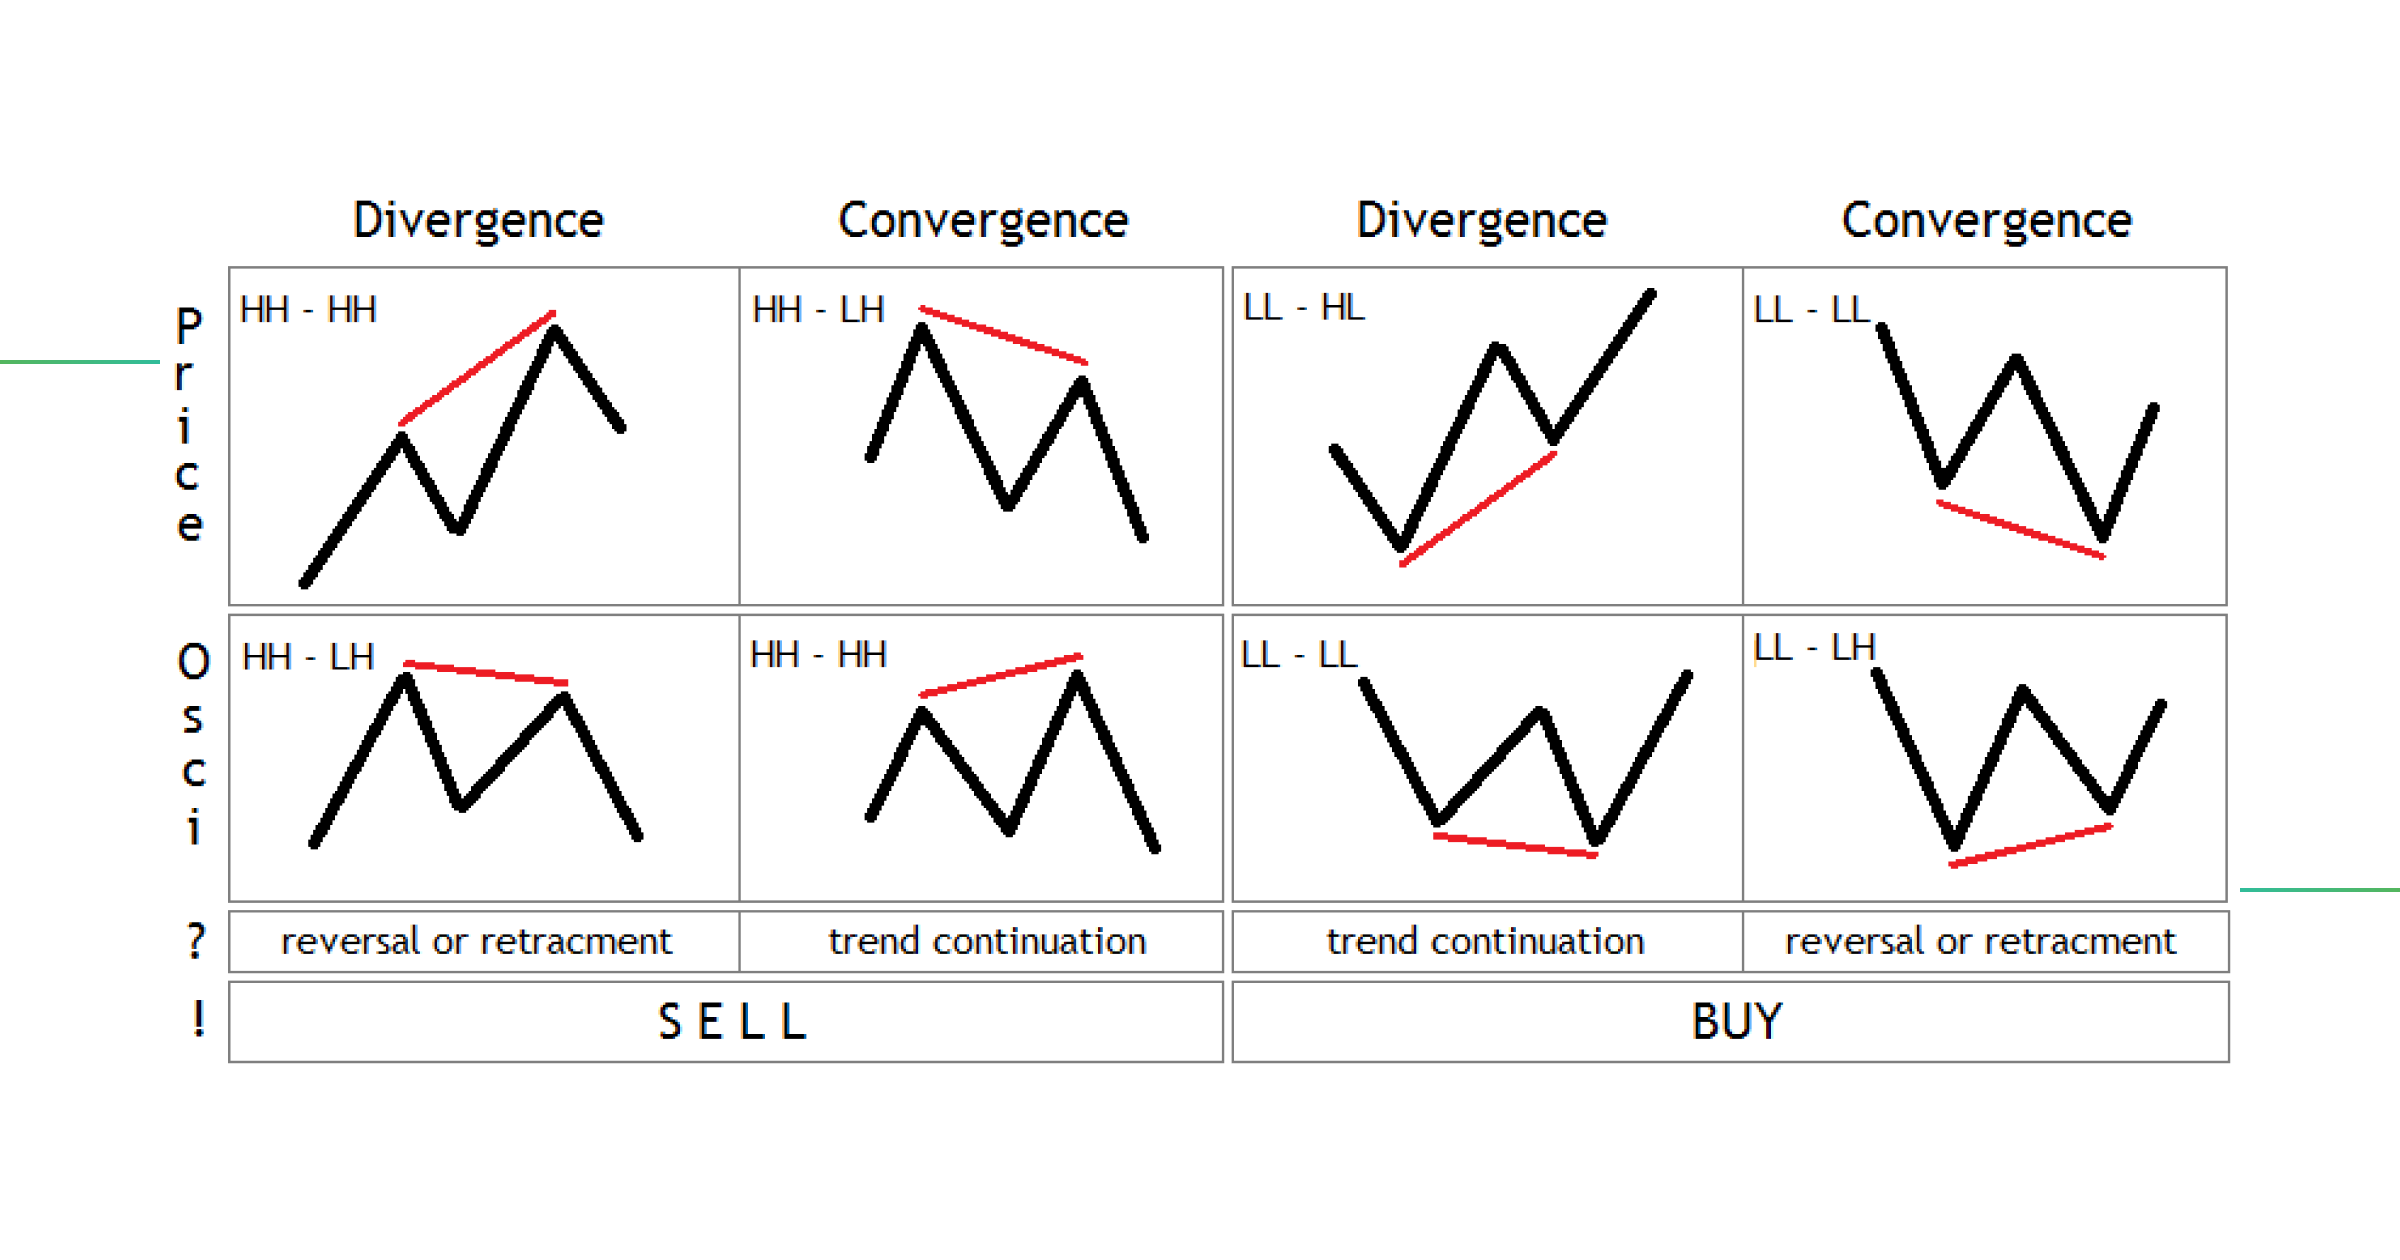
Note:
HH = higher high
HL = higher low
LH = lower high
LL = lower low
MACD Crypto trading strategy #3: MACD vs RSI trading strategy
The ideal MACD day trading strategy will most likely be to open a trade once a crossover has happened. When comparing the RSI vs MACD, the MACD has the advantage of showing these crossovers and making it easier to see reversals of momentum.
MACD vs Stochastic trading strategy
Although many people often find them similar, the MACD and Stochastic indicators are entirely different. The Stochastic indicator is based on the speed of price differences. The moving average is simply creating an average of all the previous prices. The Stochastic is therefore a momentum indicator, and will not help you to indicate a trend.
Summing up
In the same way as the RSI indicator, MACD doesn’t give you the exact trade setups like for example Bollinger Bands or Moving Averages, because it’s an indicator that is expressed in its own frame. Meaning, it’s not placed immediately on the candles/price movement.
Besides this downside, the MACD indicator is extremely powerful and very well respected by traders. Being separated from the price chart keeps the price chart clean and still provides great insight into the momentum of the market.
Before entering a trade, it’s a good idea to open the MACD indicator and have an extra look at what you can read. After this guide, all the significant signals you can read should be clear!
Trade with MACD in Good Crypto
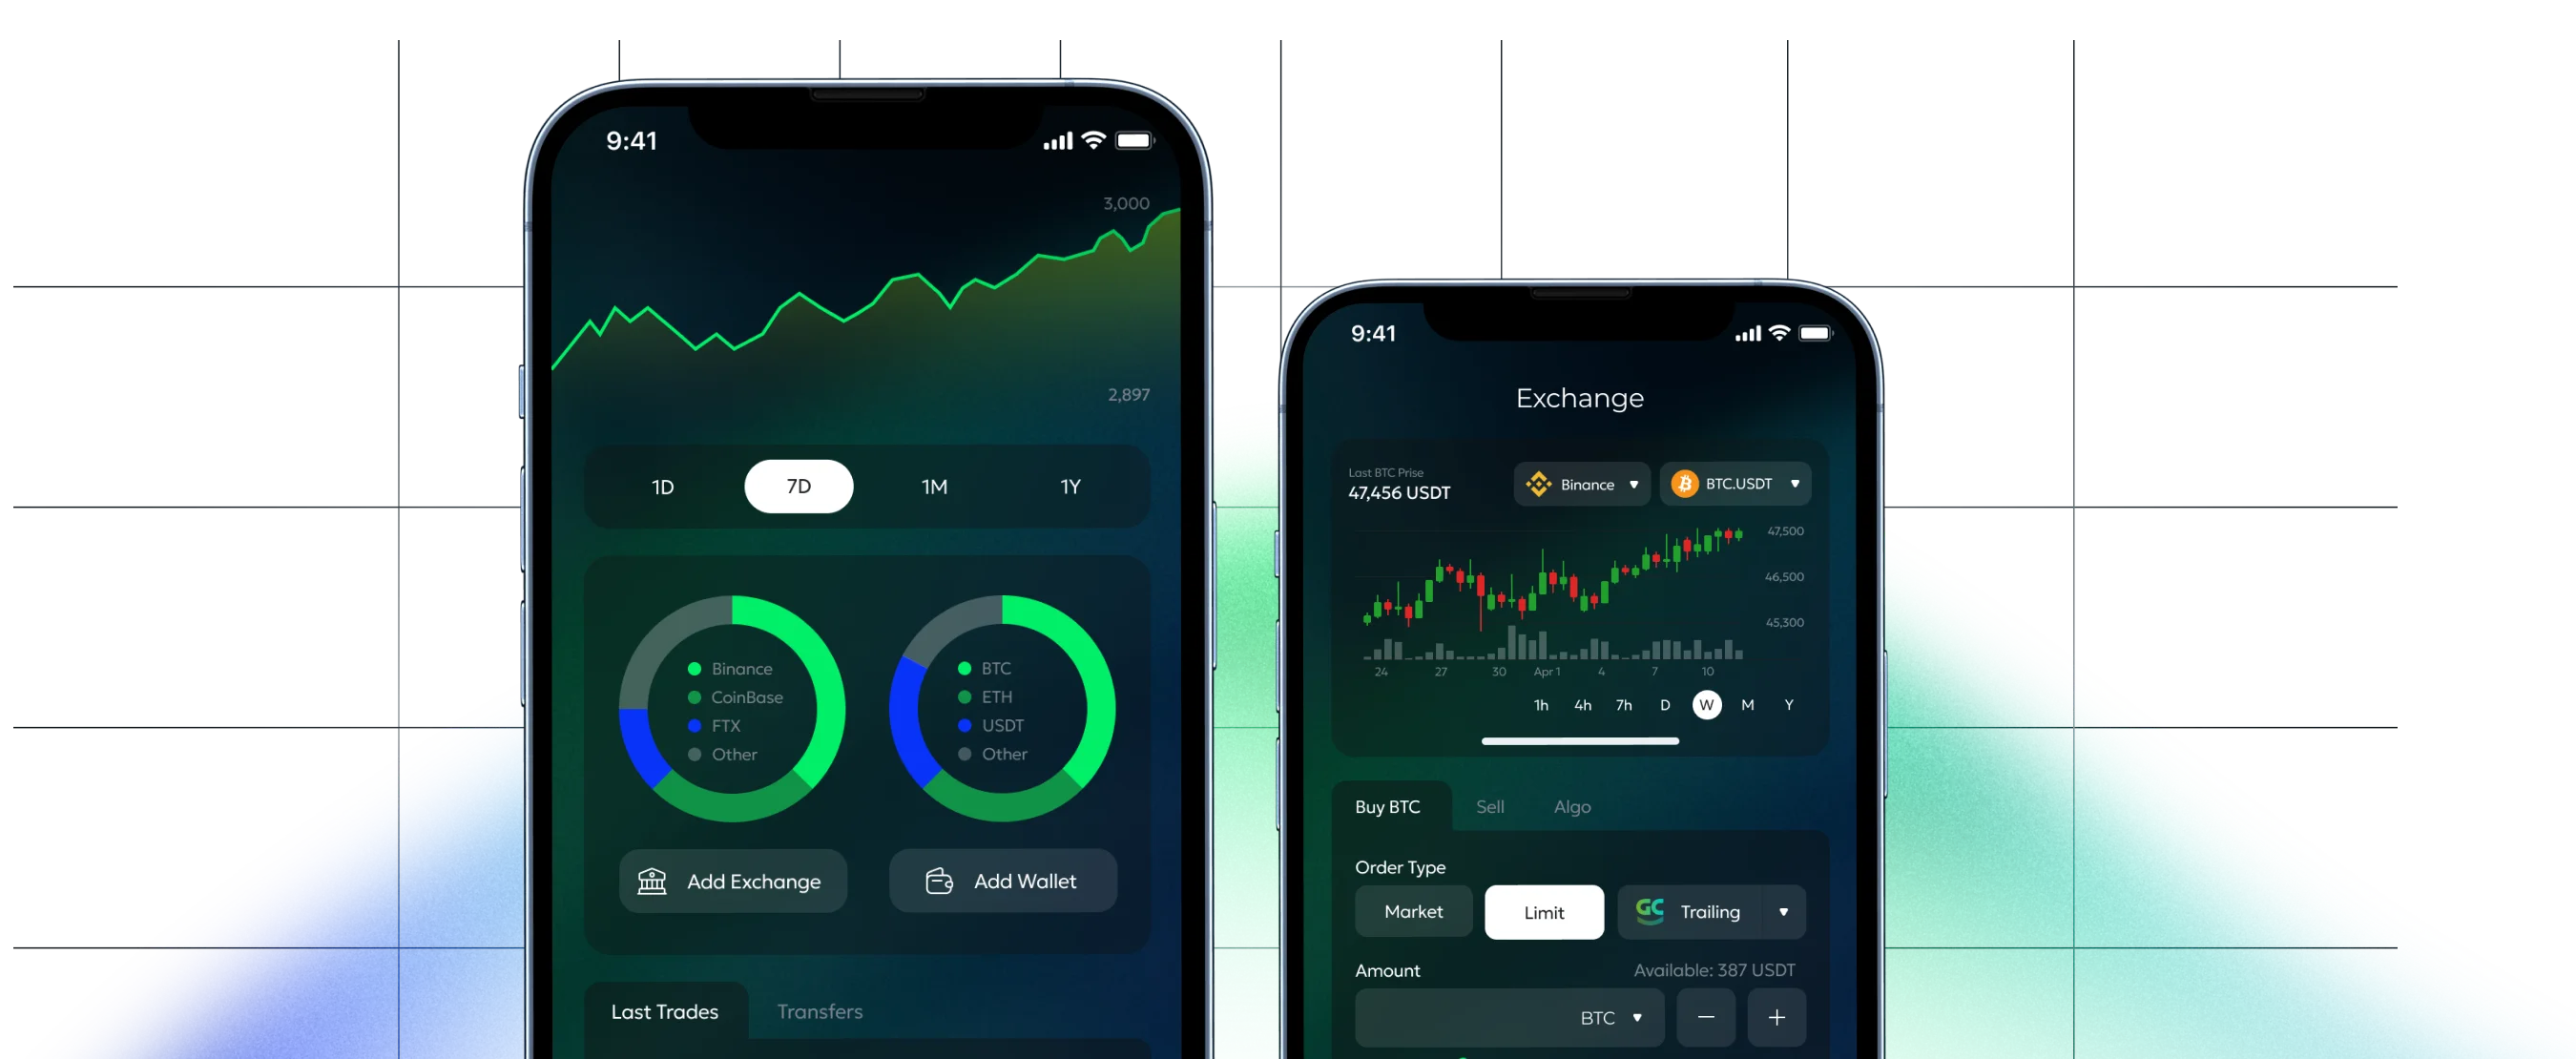
Good Crypto is a mobile crypto trading terminal that provides traders with the best crypto trading tools on the market:
- Combining all your exchange accounts into one place, allowing you to trade where you go, and showing you every cryptocurrency market you can imagine.
- Trades and transactions are all aggregated into one neat-looking portfolio. Performance is tracked over time and the history is fully collected.
- Over 20,000 markets on 35 exchanges can be discovered inside the app. Organizing these markets by performance will make it possible for you to find the most promising coins and tokens, and trade their market.
- Placing price alerts gives you the chance to grab opportunities exactly when they are there. Good Crypto also provides you with advanced alerts like new exchange listings, daily market updates, and significant price changes.
- Smart TA Signals by GoodCrypto use market data and analyze each coin based on 25 Indicators, predicting further crypto price trends or direction with the main goal – help traders decide where to enter or exit the market.
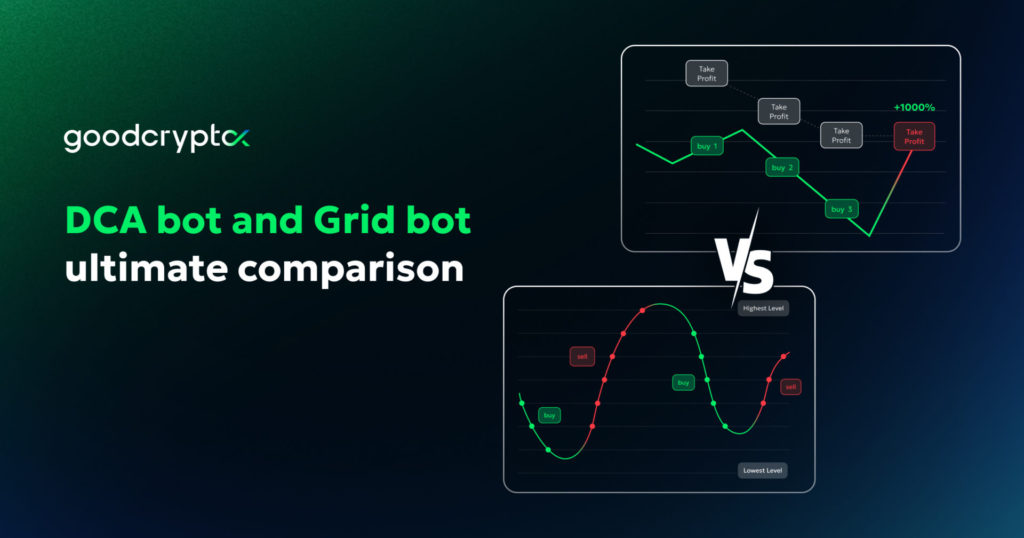
- Sophisticated trading bot strategies, such as DCA, Grid, and Infinity Trailing will help you trade 24/7 while reducing stress, possible losses, and capitalizing on all market cycles.
- When trading, you can go beyond traditional exchange order types. The architecture of the application allows you to create an unlimited amount of orders, without freezing your balance. Placing an order you can then attach a Stop Loss order and a Take Profit order all at once. And, even better, a Trailing Stop order can provide you with a lot more profits, by following the trend for as long as possible.
And of course, Good Crypto provides advanced charting tools with a full suite of technical indicators, including MACD, Moving Averages, RSI, etc.
Find Good Crypto on both the iOS App Store and the Android Play Store and discover the most advanced crypto trading app on the market!
Do you have questions?
Connect with the public chat room in Telegram and ask anything, 24/7.