
If you visualize a ball thrown up in the air, it must slow down before changing direction and returning back to the ground. “Momentum always changes direction before a price does.” – George Lane, the developer of the Stochastic indicator.
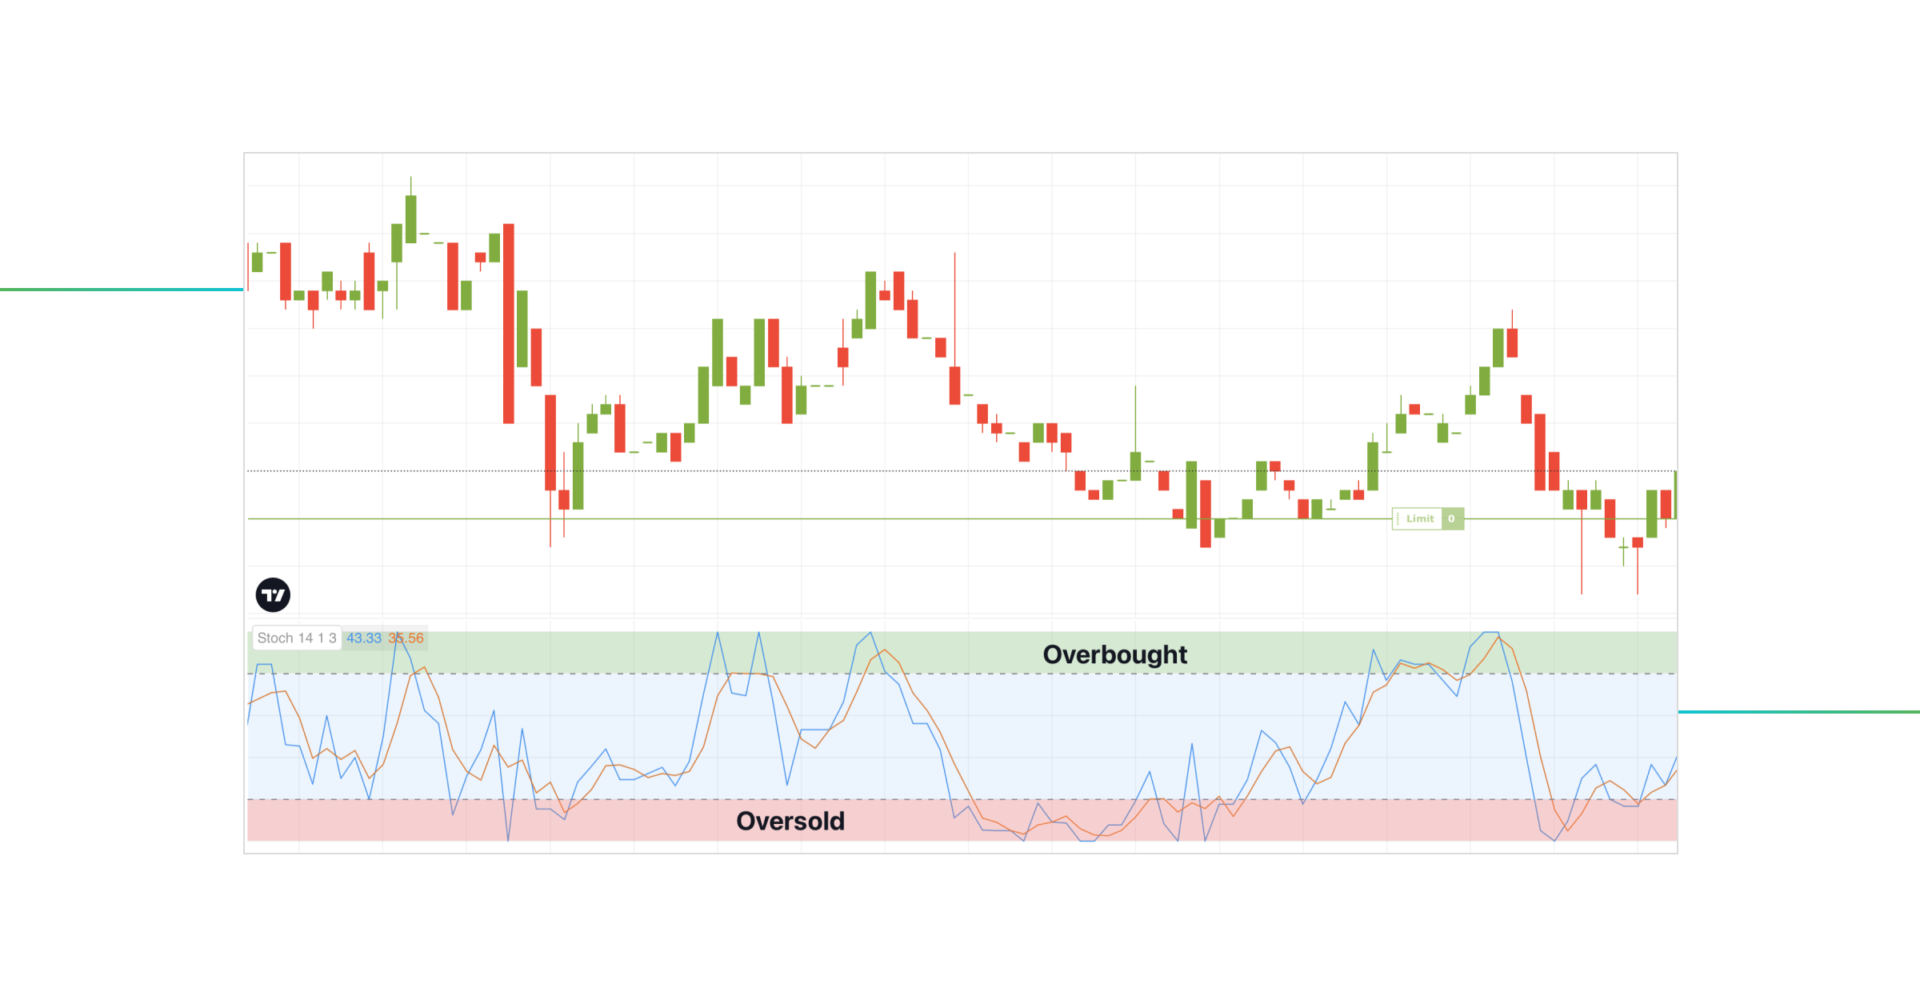
The Stochastic Indicator is made up of two moving average lines that travel between three zones – an overbought zone, a neutral zone and an oversold zone. The overbought zone occurs between the 80 to 100 level on the indicator chart, with the oversold zone occurring between 0 and 20 levels. The neutral zone is the central part of the indicator chart, which is of less importance.
Stochastic Oscillator is a big fish in the pond of other Momentum Indicators like MACD, RSI, and MOM. In this article we will shed light on what is a Stochastic Oscillator, break down three of the most common strategies and figure out the difference between RSI and Stochastic.
Here is a brief article recap:
- Stochastic Oscillator is a technical indicator used to assess the momentum of a price.
- The indicator is represented by two separate lines that travel in sync with each other between three zones – oversold, overbought, and neutral zone.
- The indicator is bounded between 0 and 100. It oscillates, that is why it is called a Stochastic Oscillator.
- A Stochastic Oscillator belongs to a group of leading indicators – those that provide insights about future market shifts before they actually happen.
- The application of a Stochastic Indicator ranges from facilitating entry into new positions and anticipating market reversals to guiding the exit from existing trades in anticipation of market corrections or reversals.
Stochastic: Meaning and Fundamentals
The Stochastic Oscillator operates by analyzing price momentum, similar to RSI and MOM, classifying it as a momentum oscillator. Basically, all momentum indicators look at the rate at which price changes. Much like the RSI we’ve explored in our previous article, it gauges overbought and oversold conditions, but with a little twist – Stochastic Oscillator considers not just the previous prices, but also takes into account the highest high and lowest low within a predetermined timeframe. This subtle yet significant nuance enriches its analysis, encapsulating the market’s historical vigor and vulnerability.
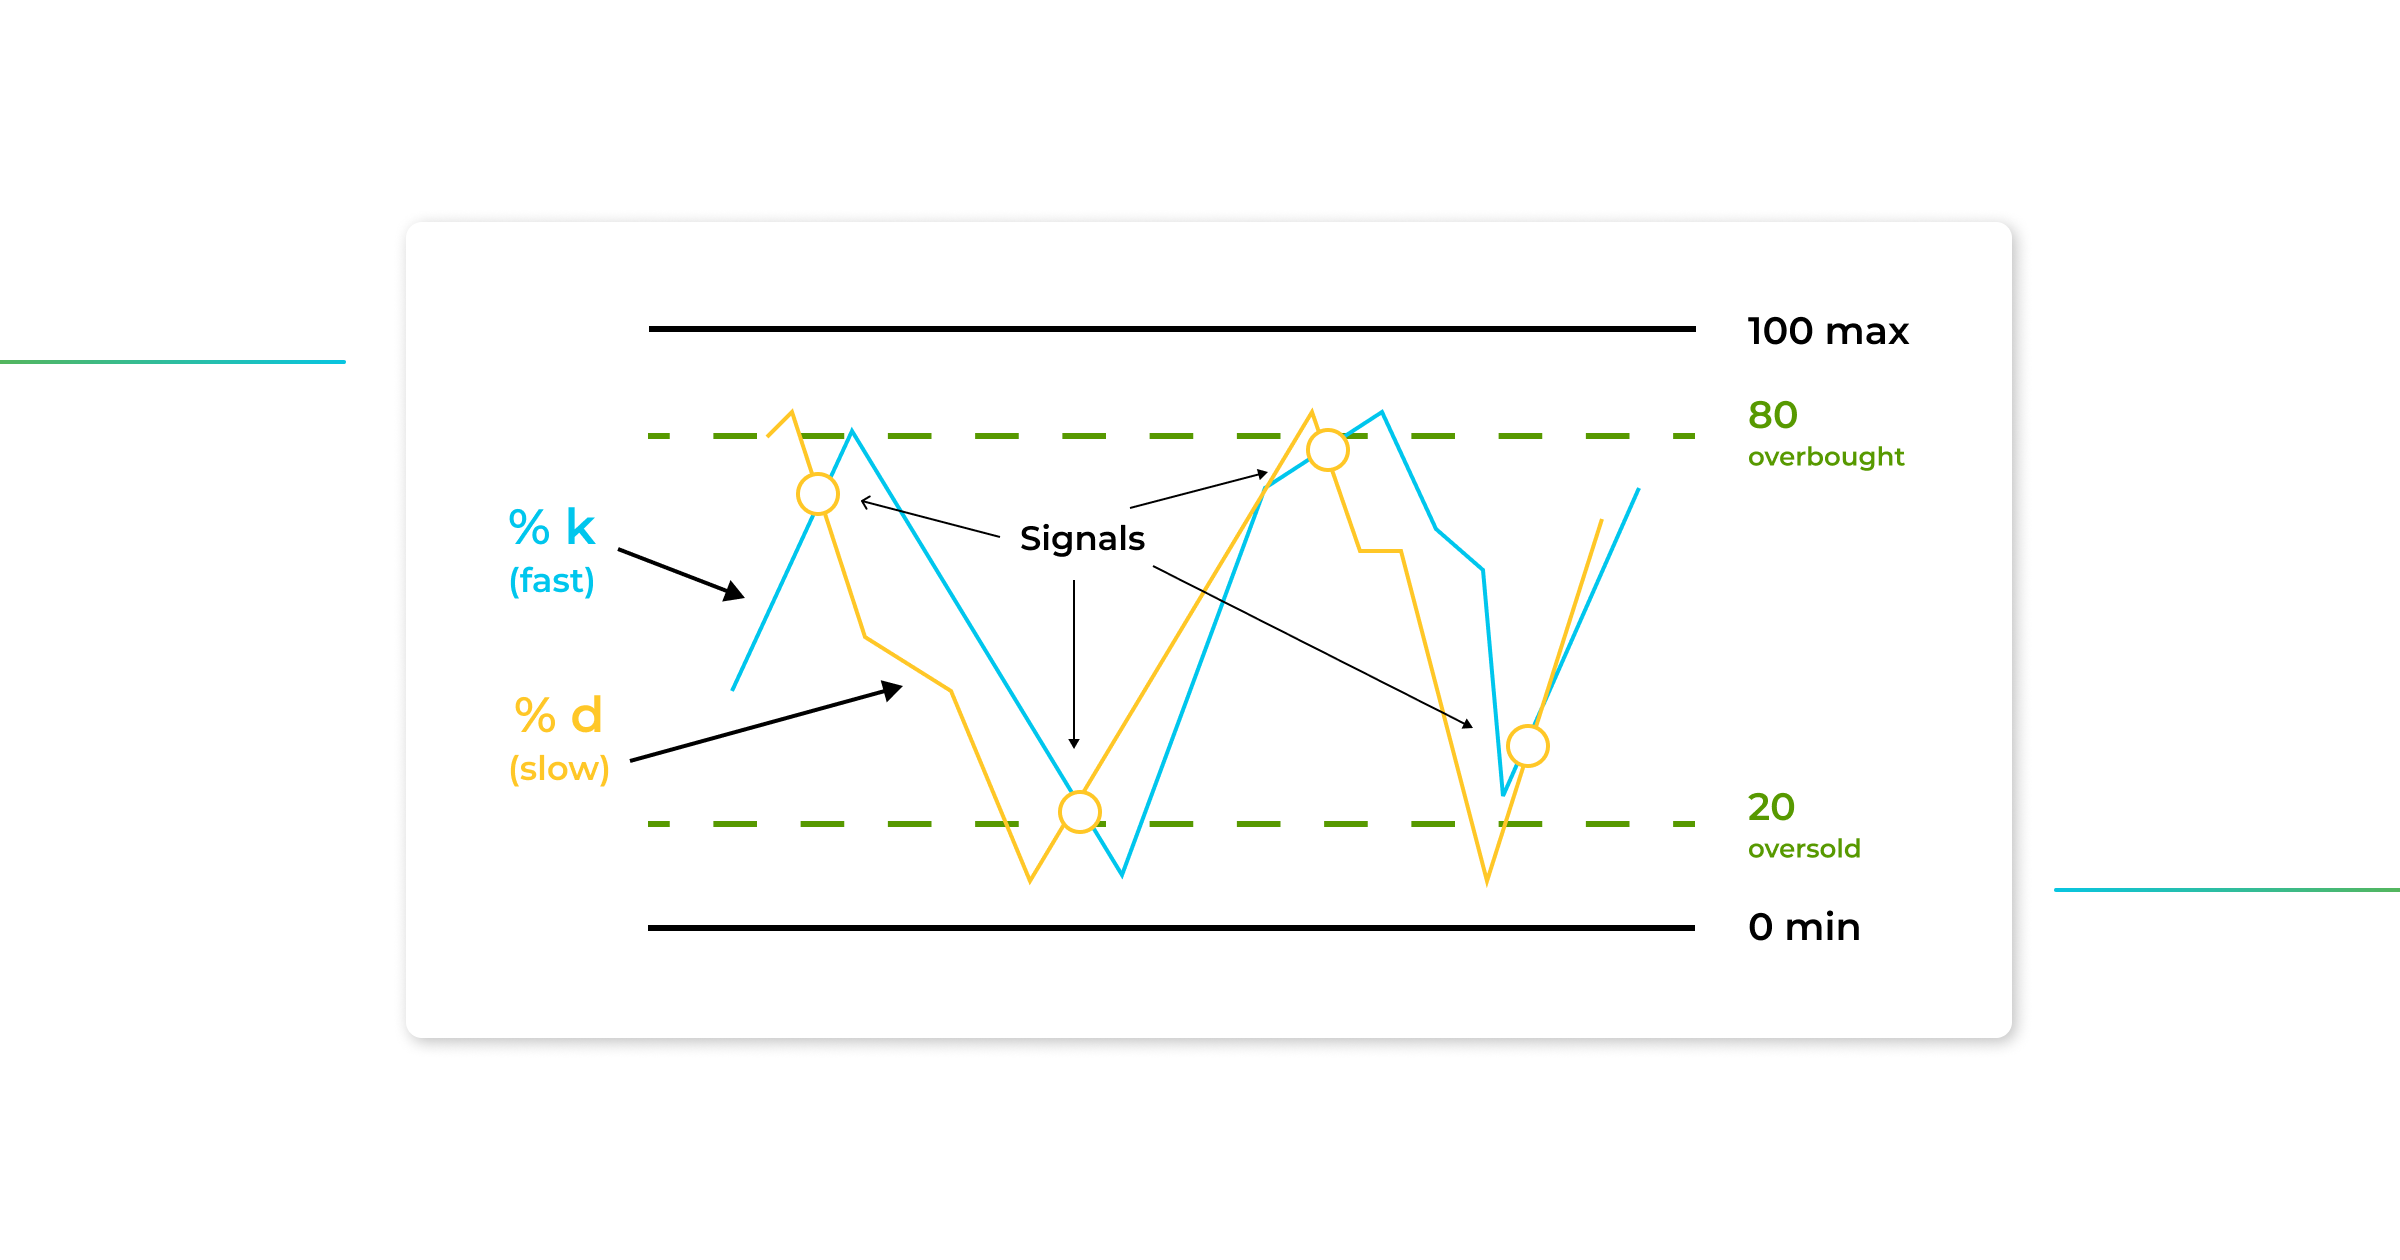
A Stochastic Oscillator is plotted on the chart as two lines: a blue-colored line (%K) represents the oscillator’s value for each session, while a yellow-colored one (%D) reflects its three-day simple moving average. They both travel between overbought and oversold zones, occasionally intersecting. A point where two lines cross is considered as a sign of a potential reversal, a large shift in momentum.
The premise behind the creation of the Stochastic Oscillator is often associated with George Lane, which is partially true. Indeed, the famous security trader and technical analyst deserves praise for playing an essential part in developing and popularization of the Stochastic Oscillator, but he wasn’t its sole originator. The indicator came to be in 1957 due to the collaborative effort of several futures traders, including George Lane, that decided to remain nameless.
Developed in the late 1950s, Stochastic Oscillator remains not only one of the most widely employed momentum indicators but also among the most utilized technical indicators to this day.
Stochastic Formula and Calculation
As we identified earlier, Stochastic Oscillator consists of two moving averages (%K and %D lines) that move in tandem.
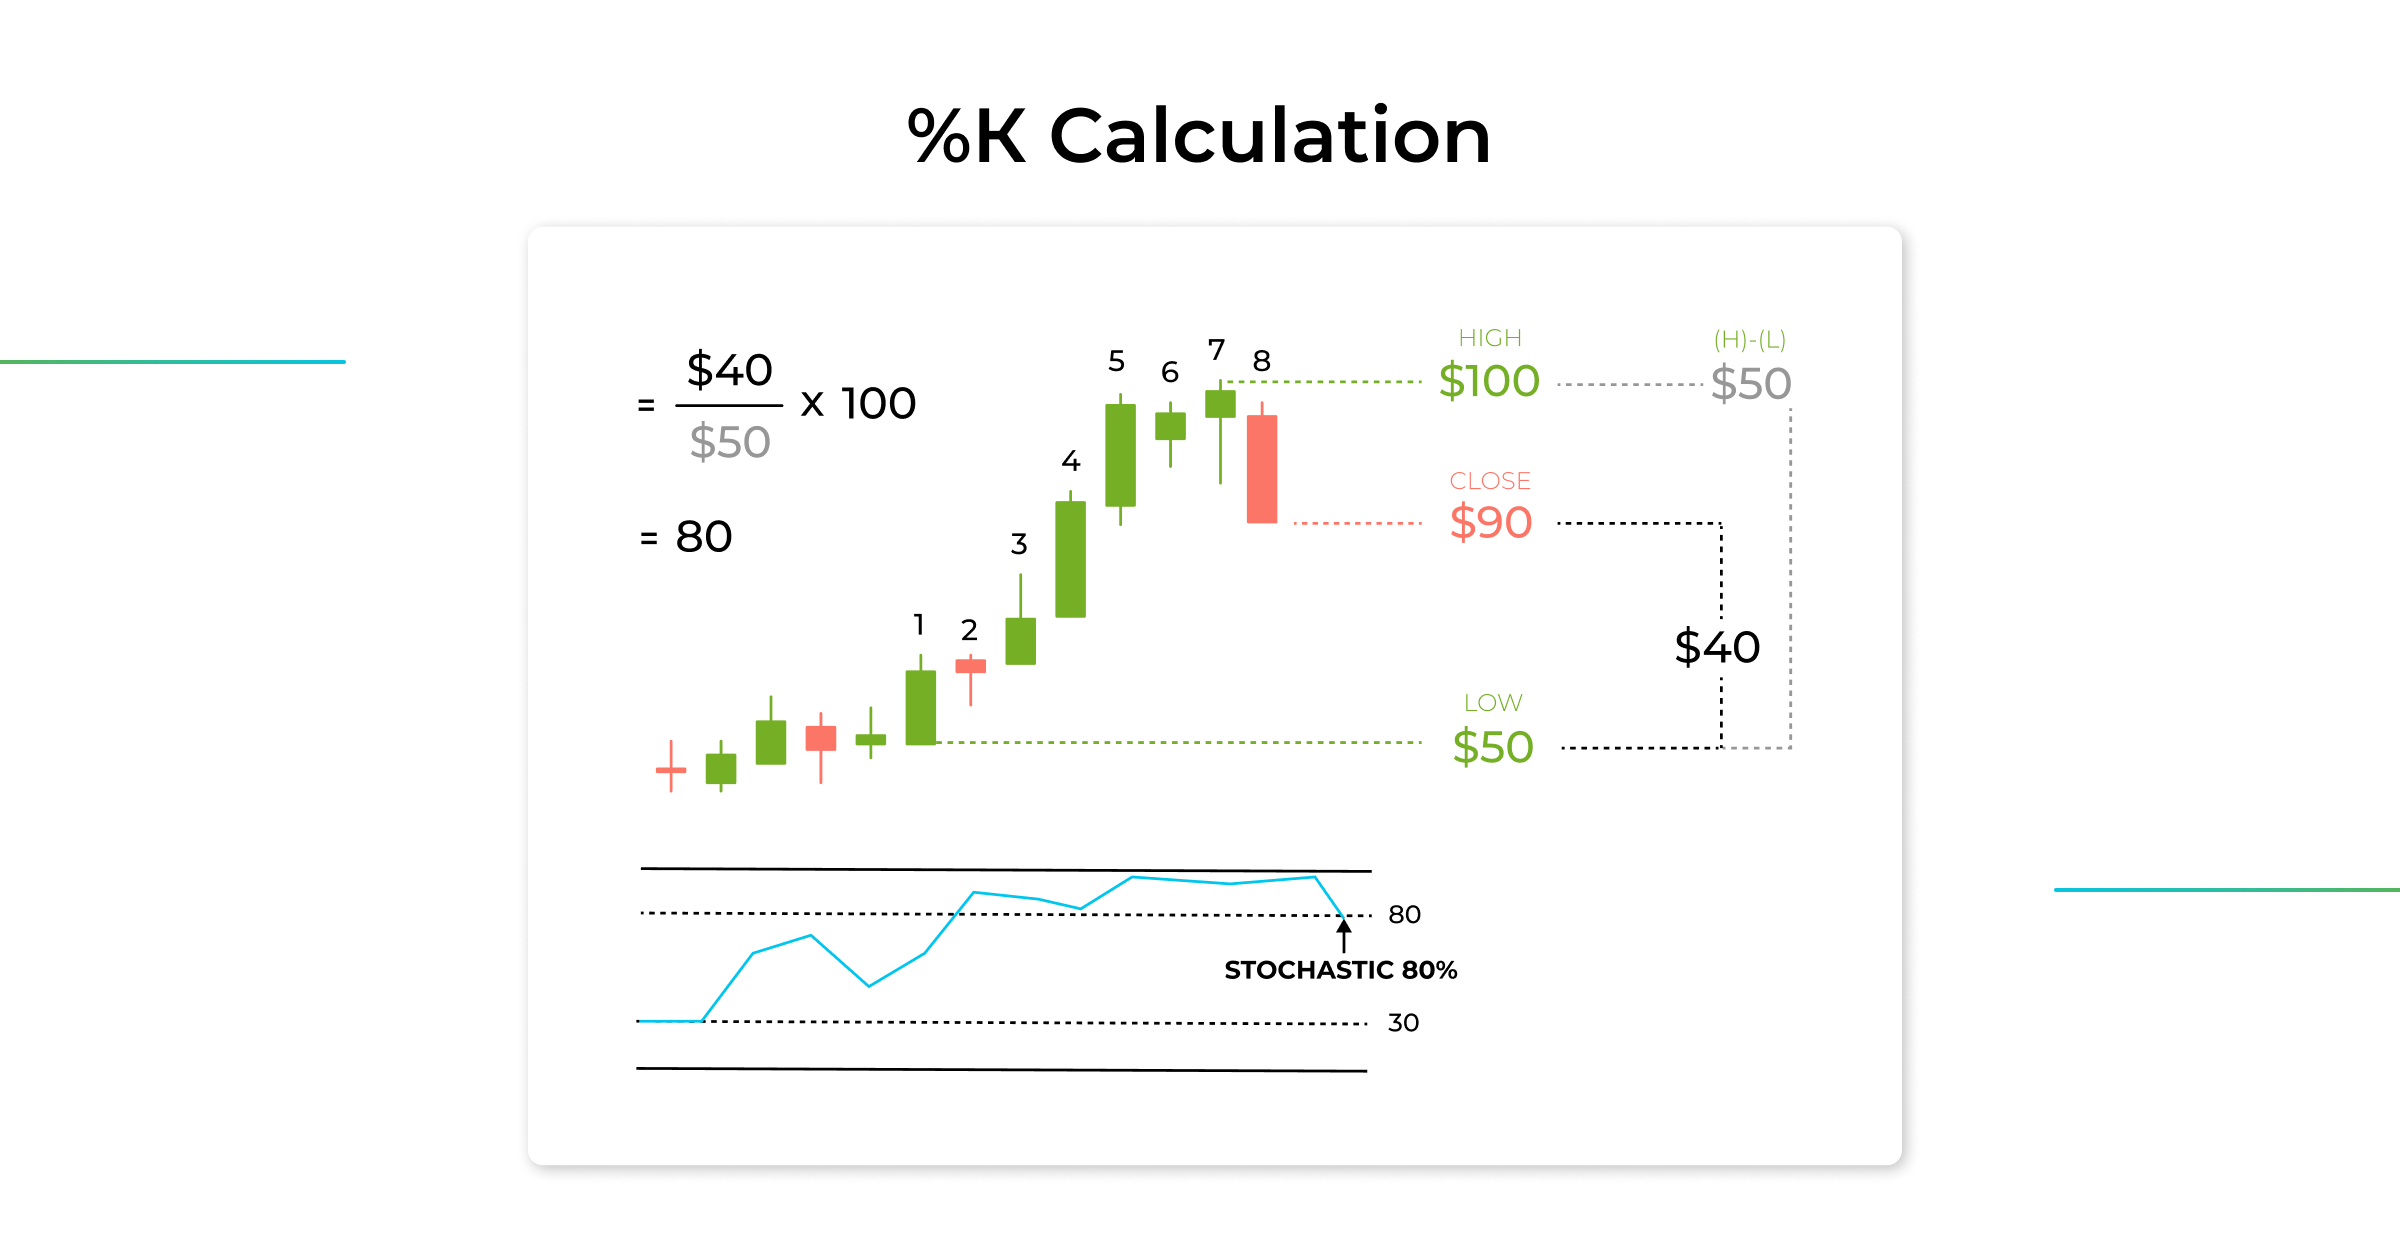
%K = (Current Closing price – Lowest Low)/(Highest High – Lowest Low) * 100
%D = The 3-Period Simple Moving Average (SMA) of %K
Lowest Low and Highest High are prices for the look-back period, which can be 14 days/weeks/months or an intraday timeframe.
The calculation of %K, which is a key parameter in a Stochastic Oscillator is simple. The %K line considers the highest high and lowest low prices over the last 14 data points and compares them to the current closing price.
Then we have the %D line, which is like a signal line. It takes the average of %K values over a 3-Period Simple Moving Average, creating a smoother line that helps us understand the trend better. The %D also known as Deviation is plotted alongside %K to act as a trigger line.
Within the trading community, it’s common to hear %K being mentioned as the fast stochastic indicator. On the other hand, traders often attribute the “slow” stochastic indicator to the %D line.
Components: Stochastic %K Line and %D Line
So, how did the %K and %D lines come to be? Well, it’s all thanks to the strong determination and manual work of 5 aspiring traders, including George Lane himself. The whole technical analysis journey kicked off with a spark of inspiration, driving the team to dive into endless days full of experimentation. Their commitment was remarkable – no paychecks, no weekends, just pure dedication as they rolled up their sleeves and got to work, putting pen to paper (quite literally) to crack the code.
During their extensive research, the team faced a challenge – the indicators they were developing were causing chaos on the charts. To address this, they come up with a technique: expressing these indicators as percentages, utilizing the alphabet to label them (%A, %B, %C, and so forth). This approach not only streamlined charting but also facilitated effective analysis and interpretation.
But the real breakthrough came after putting in a lot of hard work. It became clear that %D and %K were the keys to understanding price momentum. And the result of their determined collaborative effort? The birth of the well-known %K and %D lines – tools that traders use to this day to figure out a price momentum.
Fast, Full And Slow Stochastic
Slow, Fast, and Full Stochastics are variations of the Stochastic Oscillator, each offering insights into market momentum and potential reversals.
- Slow Stochastic: This version smoothes out the readings by using a longer time period for the %K and %D calculations. It’s ideal for traders seeking a broader view of trends, as it’s less reactive to short-term price fluctuations. Slow Stochastic is often used to confirm trends observed in other indicators. Some sources suggest that C. Ralph Dystant may have been the developer of the slow Stochastic Oscillator. However, it’s important to note that Lane himself did not attribute the creation of the slow Stochastic Oscillator to his own efforts.
- Fast Stochastic: In contrast, the Fast Stochastic employs a shorter time frame for %K and %D calculations, making it more sensitive to recent price changes. This version provides quicker signals, suitable for traders seeking timely entry and exit points. It’s particularly useful in volatile markets.
- Full Stochastic: As the name suggests, the Full Stochastic incorporates both the Fast and Slow versions by displaying the Fast %K alongside the Slow %D. This combined view can offer a comprehensive understanding of both short-term and long-term trends, helping traders make more informed decisions.
How To Read Stochastic Oscillator?
When the price experiences significant drops due to excessive selling pressure, the stochastic indicator tends to provide an oversold reading. This signals to the trader that a current market direction could potentially shift. Conversely, when prices surge to extreme highs due to heavy buying activity, the stochastic indicator delivers an overbought reading. This serves as an indication to the trader that the current market direction might be on the verge of transitioning from an upward trend to a downward one.
The neutral zone of a Stochastic Oscillator’s reading adds another layer of analysis. Crossing above 50 signifies the upper trading range and bullish dominance, while moving below 50 suggests the lower range and bearish sentiment.
Now that we’ve figured out how to interpret overbought and oversold zones, let’s move on to understanding moving averages:
- When %K goes above %D, it suggests things are moving up, possibly toward a bullish trend. On the flip side, if %K falls below %D, it could indicate things are heading down, hinting at a bearish trend.
- Watch %D at 80 or 20 – if it goes above 80, things might be overbought, signaling a potential drop ahead. If it falls below 20, it could mean things are oversold, suggesting a possible bounce back.
Stochastic Oscillator Settings
As a trader, you can decide to change the Stochastic oscillators parameters to suit your trading style. However, it is important to note that it is vital to test whatever settings you decide to use.
The standard settings indicating an overbought zone are between 80 and 100, while the oversold zone is found between 0 and 20. Here is how the modifications to overbought and oversold zones will impact your trading experience on Good Crypto or any other trading platform:
- Lowering the overbought level to 70 or raising the oversold level to 30 will accelerate signals generated by a Stochastic Oscillator, allowing you to get into the trade sooner. The downside of this settings correction is that it would also increase the number of false signals given, potentially leading to more losing trades.
- By increasing the overbought level to 90 or reducing the oversold level to 10, signals will be generated later and with reduced frequency. In this configuration, overbought and oversold signals will only be triggered when there is a drastic change in price momentum.
Other indicator parameters within your control are %K and %D. You also have control over other important indicator parameters, namely %K and %D. By default, they are set to 5 and 3, respectively. Common alternative settings include 14, 3, and 21, 5.
- Modifying %K and %D settings can significantly impact your trading experience. Increasing the settings to speed up the indicator lines will result in quicker entries into overbought or oversold zones. This could generate more trade signals, but be cautious as it may also lead to more false signals, potentially causing frequent losses that challenge sustained profitability.
- Decreasing these settings will slow down the lines’ movements between overbought and oversold, requiring more patience for entry signals. While this may reduce false signals, it might also cause you to miss some trading opportunities. Finding the right balance between these settings is crucial for effective and informed trading decisions.
How to Trade a Stochastic Indicator?
Similar to RSI and other momentum indicators, the Stochastic Oscillator serves as a powerful tool for comprehending price direction and projecting future shifts. Essentially, the Stochastic Indicator has a spectrum of applications:
- Anticipating reversals;
- Identifying overbought and oversold signals;
- Spotting crossovers between the two moving averages (%K and %D);
- Assessing trend directions;
- Detecting divergence signals (the first use of Stochastic Oscillator Lane thought of).
Stochastic is not limited to one specific market. Instead, its utilization spans across well-established spaces such as traditional stocks, futures, and ETFs while also making an entrance into emerging markets like cryptocurrencies.
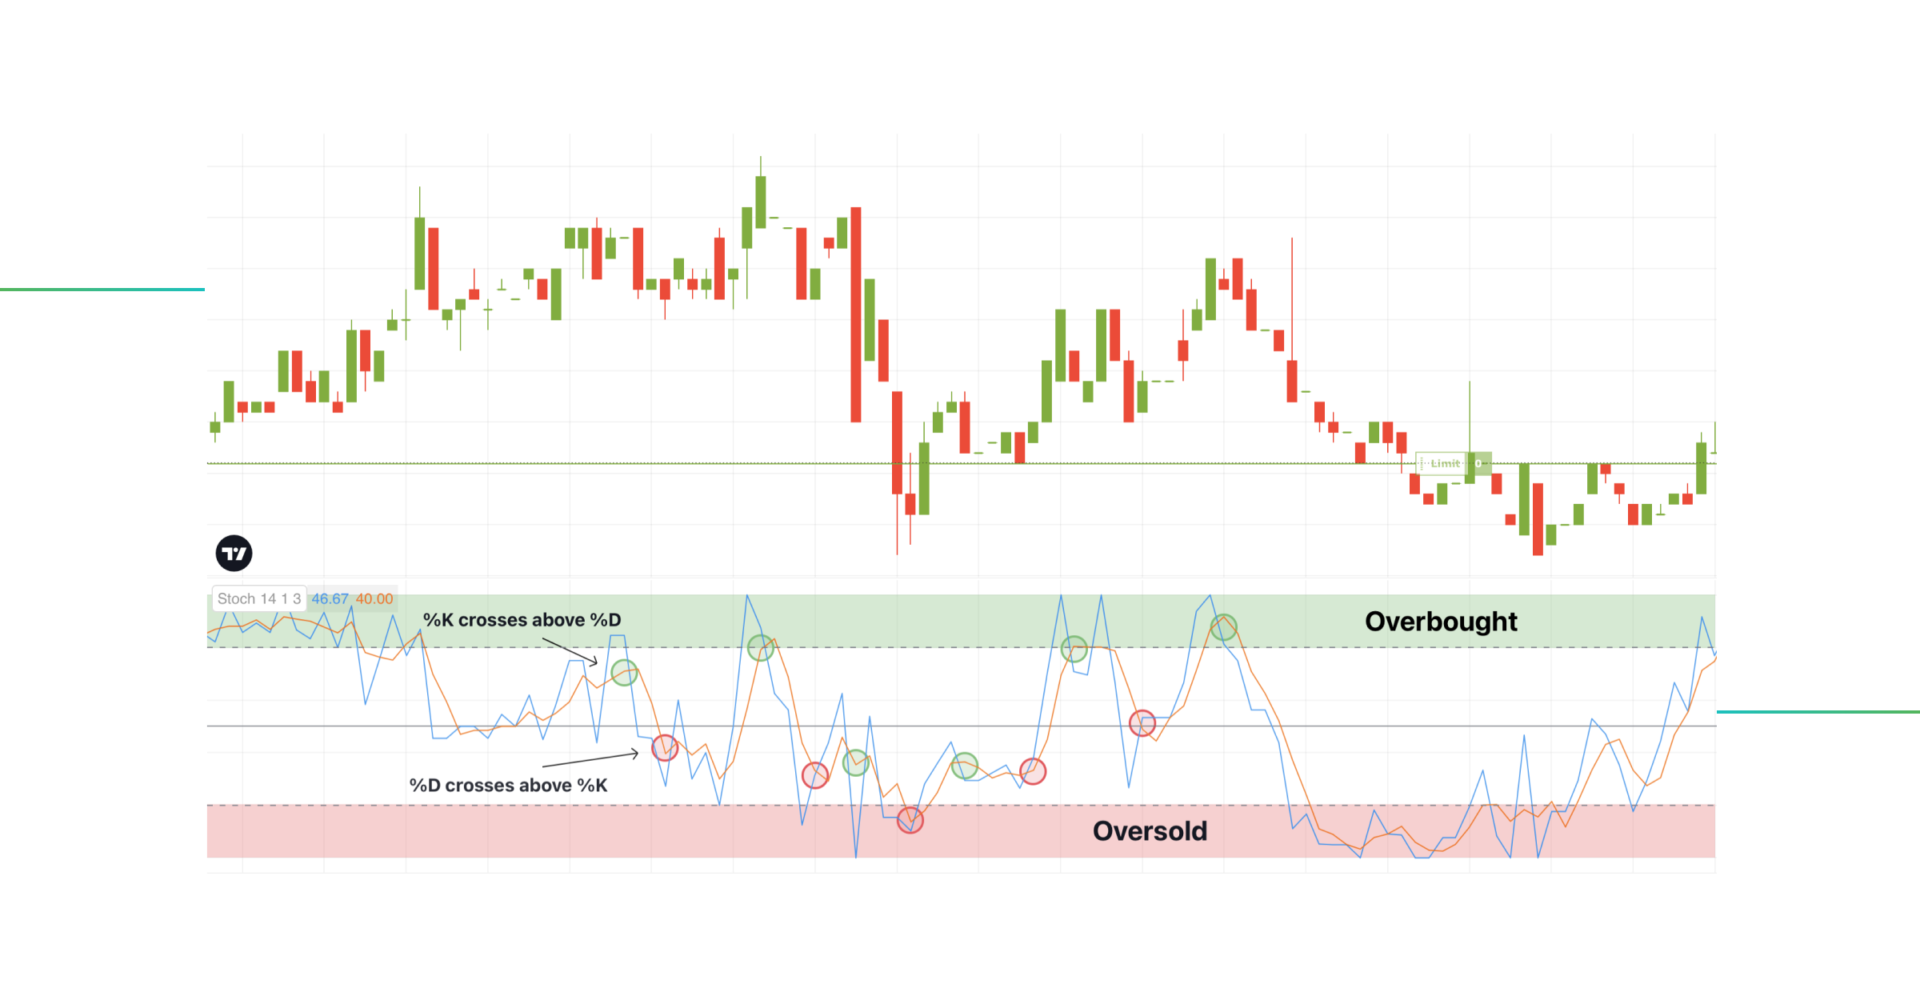
Stochastic Oscillator Strategy #1: %K and %D Lines Crossover
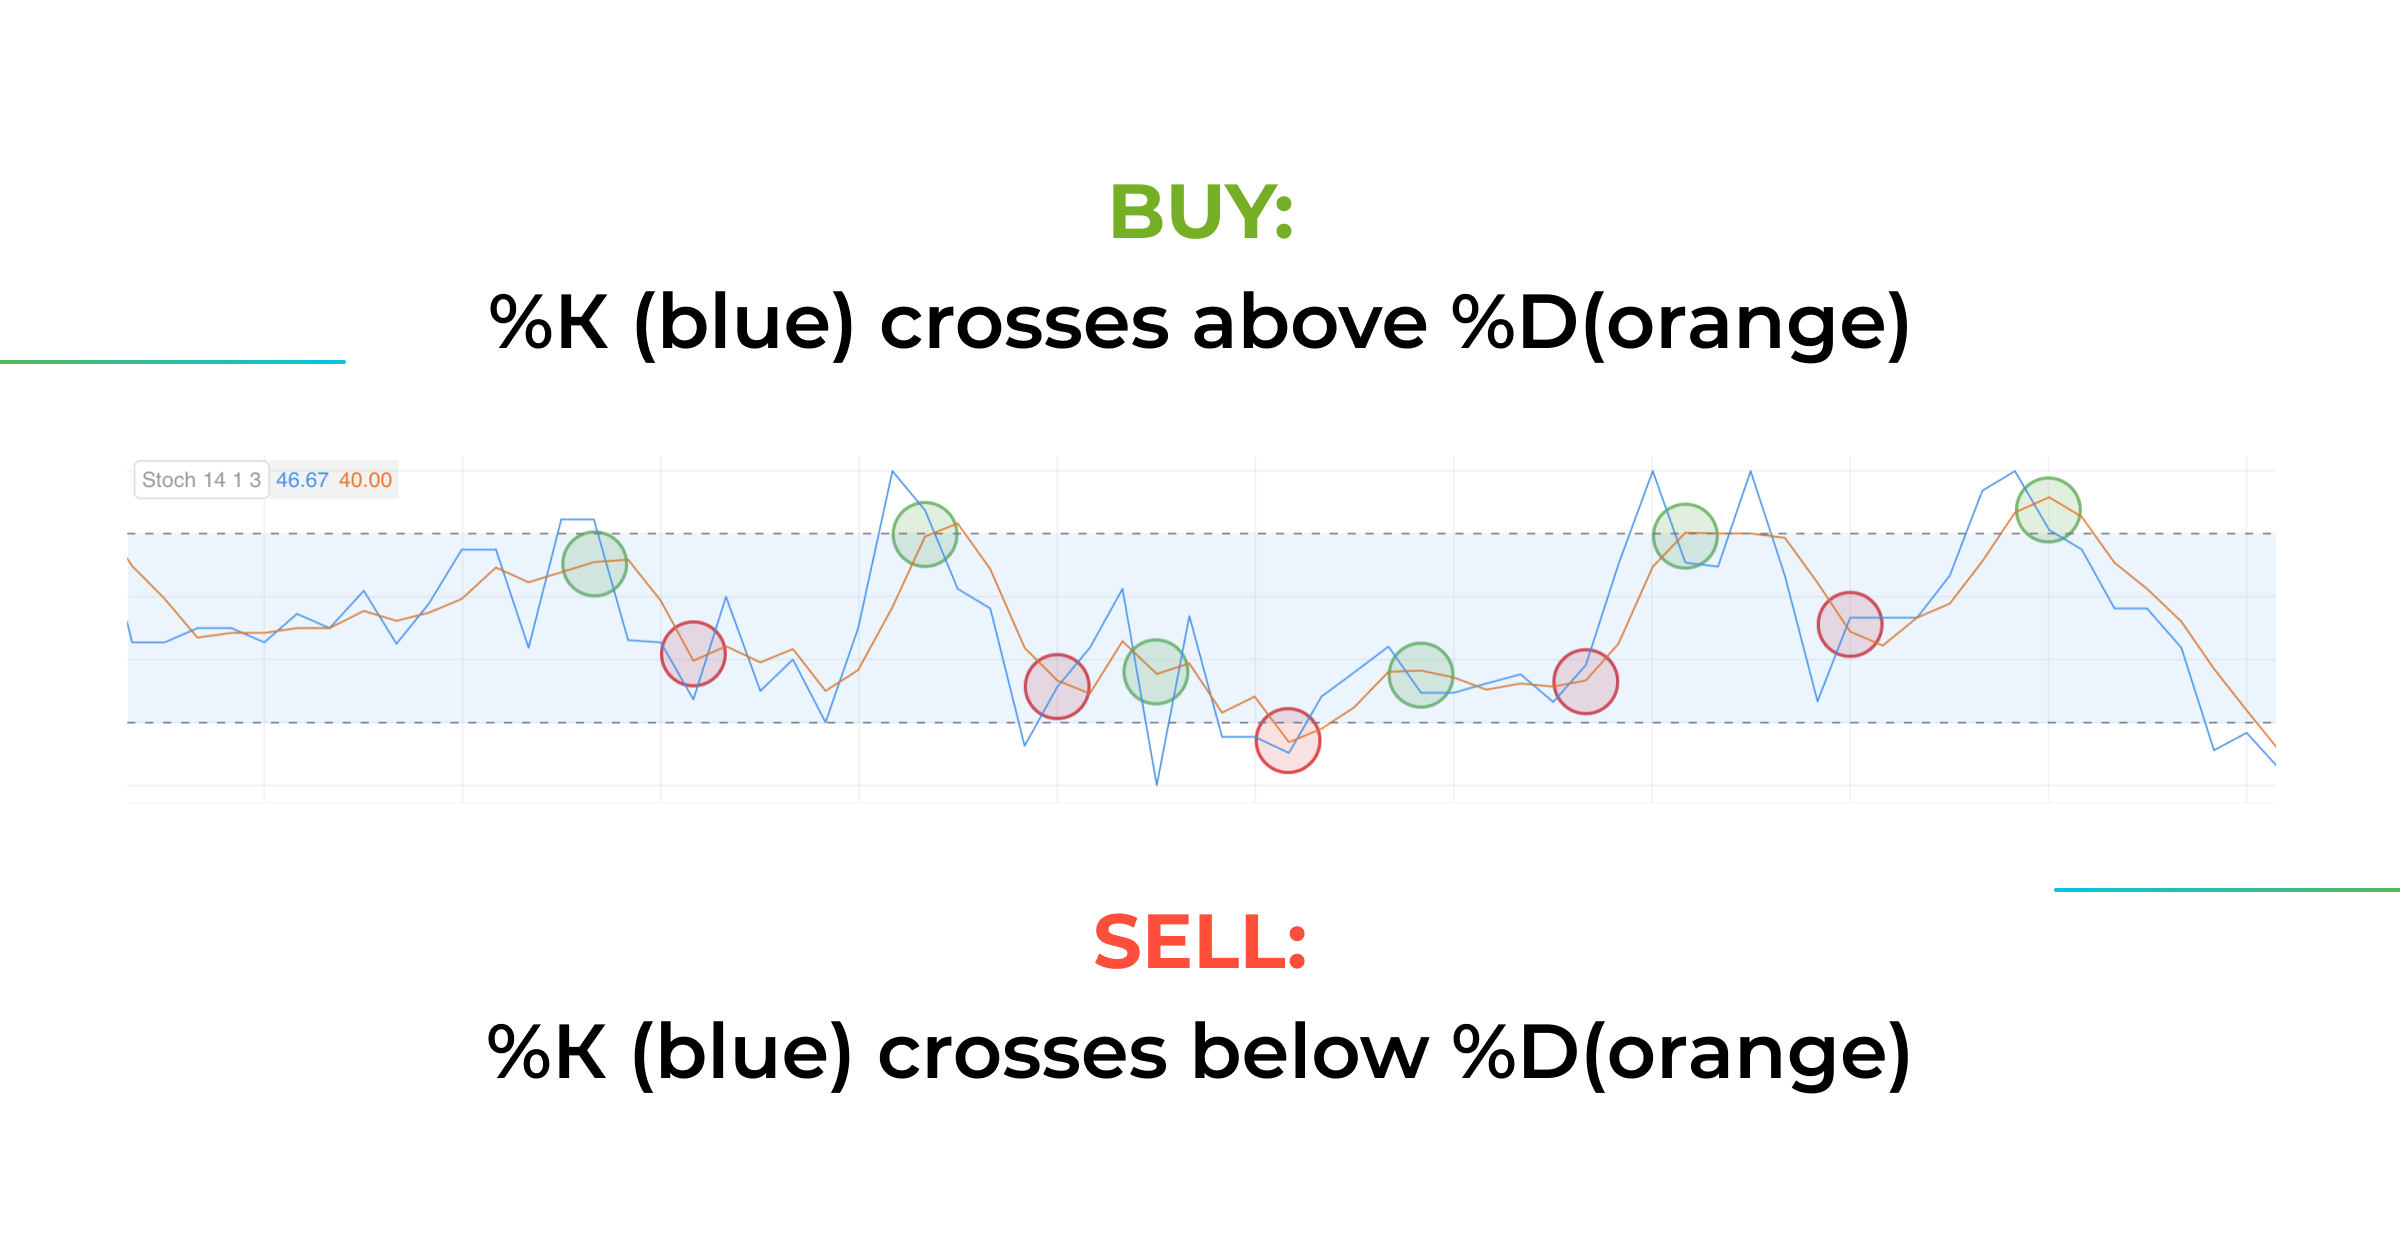
A basic way to use the Stochastic Oscillator is by watching when two lines, %K and %D, cross each other. A rule of thumb you should follow is that when the %K line crosses beneath the %D line, it suggests a selling opportunity. Conversely, if the %K line crosses above the %D line, it indicates a buying opportunity.
When using the Stochastic Indicator for trading signals, it’s recommended to wait for the moving average lines to cross each other, especially after they’ve entered the overbought or oversold zones. For instance, if the lines drop below 20 and then rise, crossing back over 20, this could indicate a bullish signal, possibly signaling a good time for a long trade. Similarly, if the Stochastic lines are above 80 and then drop, crossing below 80, this might suggest a bearish signal, potentially signaling a suitable moment for a short trade.
Stochastic Trading Strategy #2: Overbought and Oversold Zones
So focusing solely on overbought and oversold zones is a very basic usage of the Stochastic Indicator. Basically, this approach centers on using these extreme areas as basic markers for spotting potential changes in market directions.
Here’s the idea: Focus on signals that show when the market is either overbought or oversold. Imagine the indicator going into the overbought area – that’s like a heads-up that there might be a chance the market is hitting a peak. Now, when the indicator goes back out of the overbought area, it could signal that it’s time to consider selling, suggesting the market sentiment might be shifting.
Essentially, this strategy boils down to the Stochastic Indicator helping us see when the market has stretched too far in one direction. If it goes into the overbought zone, it could mean the market needs to correct or might reverse downwards. On the other side, if it gets into the oversold zone, it could signal that a market correction or upward reversal might be just around the corner.
Stochastic Trading Strategy #3: Stochastic Divergence
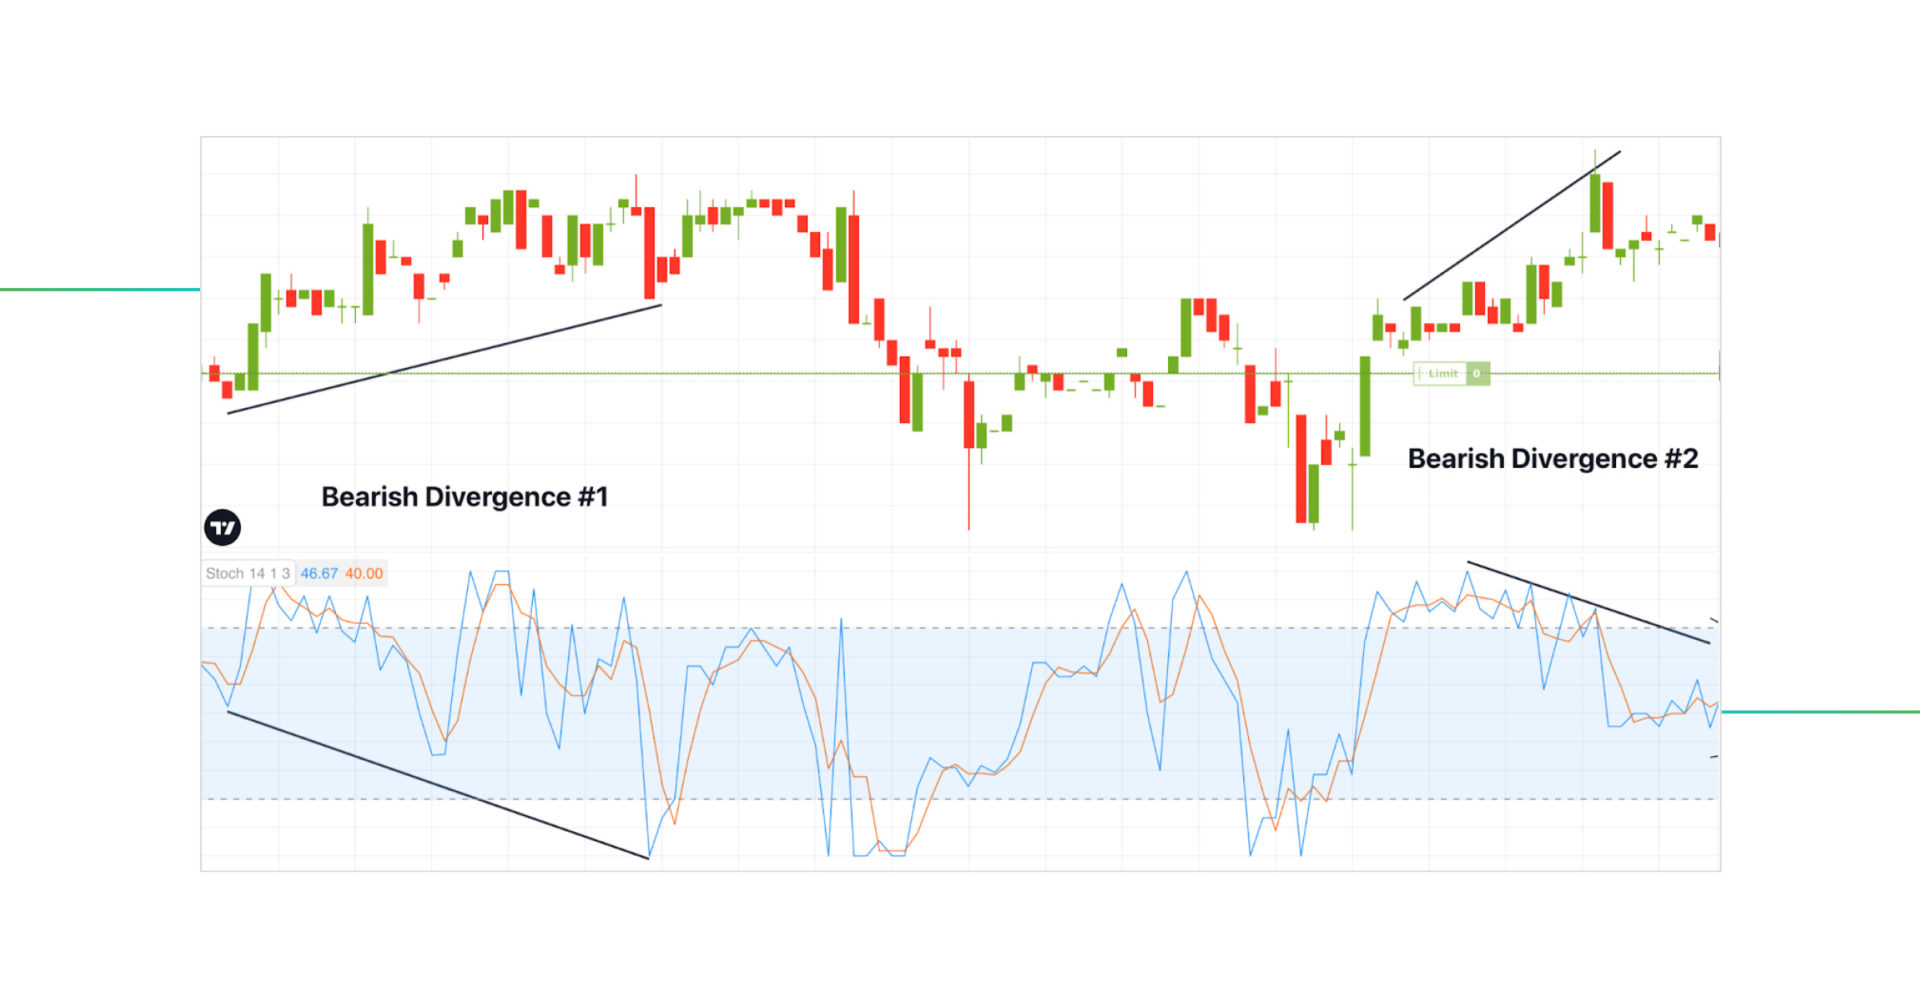
Divergence is a powerful concept that can help us understand market reversals. To illustrate, let’s consider a price chart where we observe the market making higher peaks over time, indicating successive higher highs. Now, if we shift our attention to the Stochastic Oscillator chart below, we initially notice that the oscillator’s movement was in line with the price, both rising. However, a divergence emerges as the oscillator fails to reach a new high and starts to decline.
This divergence between the price and the oscillator can serve as a signal for a potential reversal. It’s like a warning sign that the market dynamics might be changing.
The divergence comes in two forms: bearish and bullish. If the price shows higher highs while the Stochastic Oscillator shows lower highs, it’s a signal of potential bearish divergence. Conversely, when the price records lower lows and the Stochastic Oscillator displays higher lows, it suggests a bullish divergence.
In essence, we’ve discussed three key approaches: looking at overbought and oversold conditions, observing crossovers, and now adding divergence into the mix. Combining these techniques can enhance our trading strategy. We can start by using overbought and oversold signals as a preliminary setup. Then, we seek confirmation by checking for divergence between the price and the oscillator.
RSI vs Stochastic Oscillator
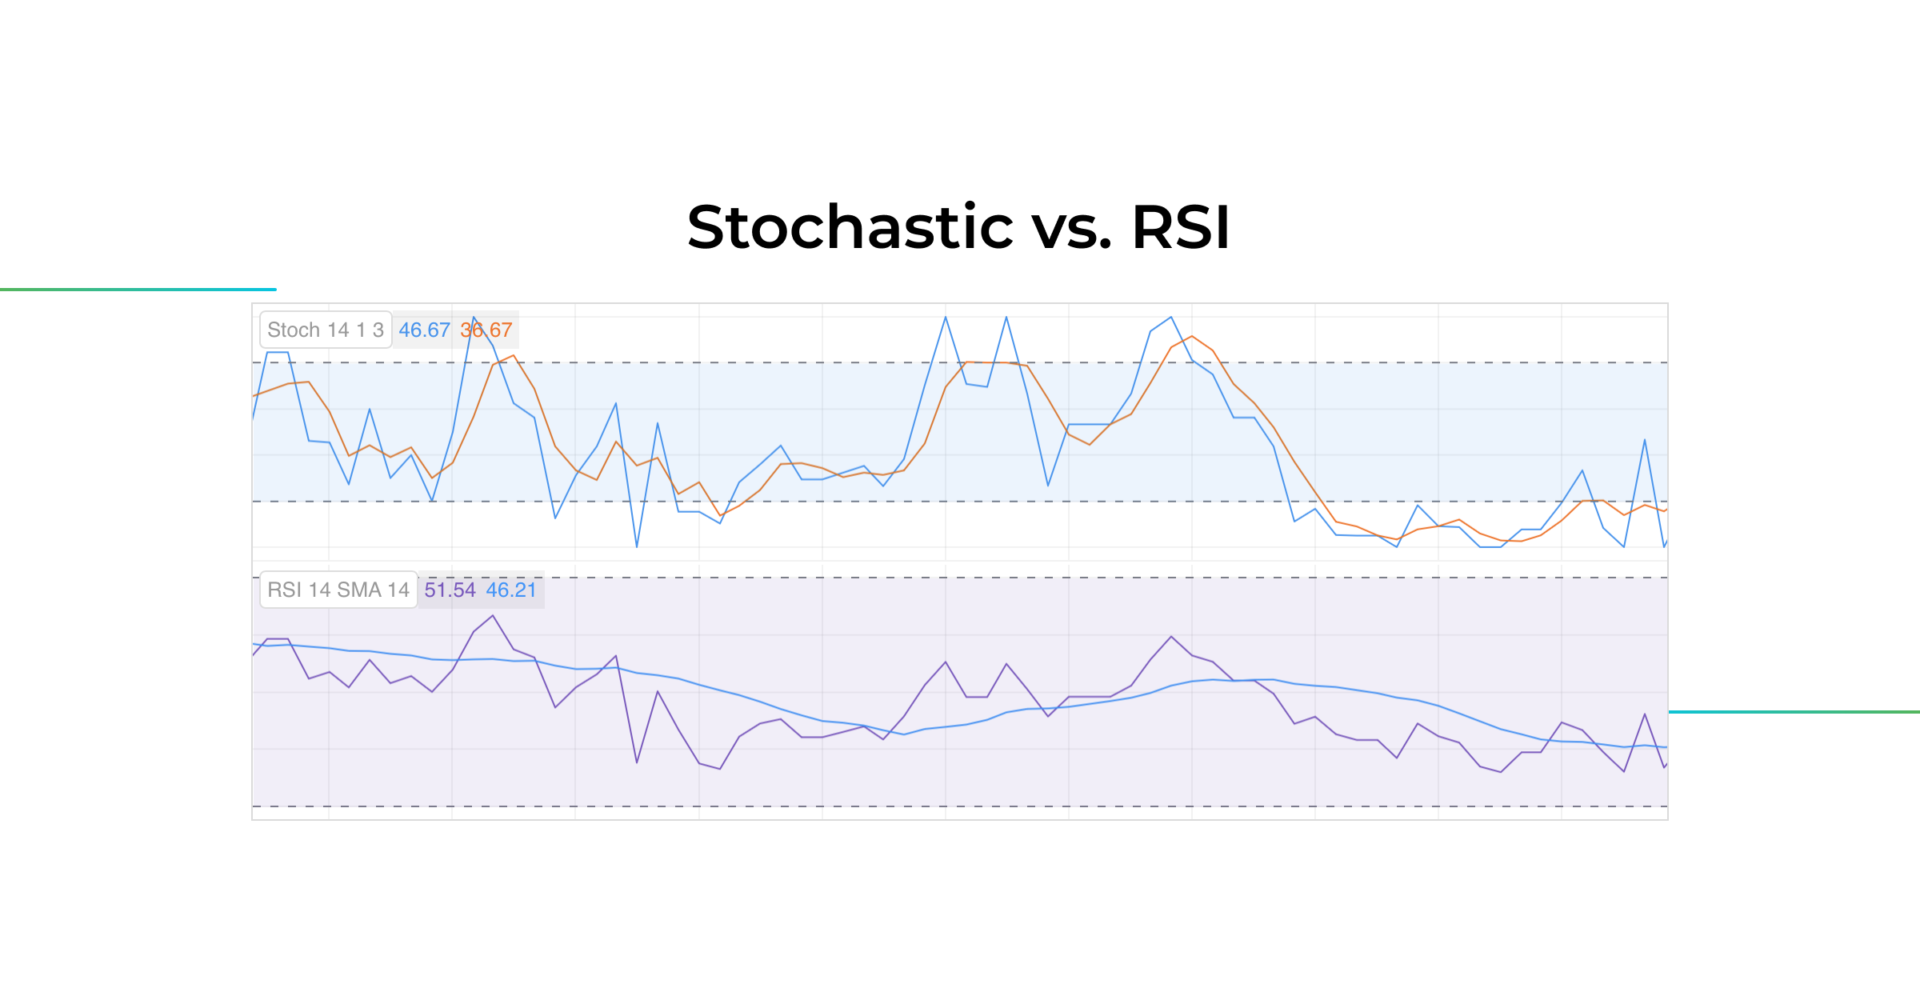
Both RSI and Stochastic are momentum indicators that have been enjoying quite a bit of popularity among traders.
At first glance, when you’re checking out charts and strategies, they might seem pretty similar. But believe it or not, even today, some traders aren’t entirely sure about the differences between them.
Just like the Relative Strength Index, the Stochastic Oscillator also gives us hints about when the market might be overbought or oversold. It does this by comparing the current price to past prices over a certain period. But here’s the twist: The Stochastic Oscillator goes a step further. It doesn’t just look at previous prices; it also takes into account the highest high and lowest low over its lookback period. In a nutshell, the Stochastic compares the current price to the broader range of prices.
If you haven’t checked it out already, we highly recommend taking a look at our detailed guide on the RSI. You’ll see that these two concepts share a lot of interesting points that you might want to discover and explore.
Conclusion
In this article, we dived deep into the fundamentals and the usage of a Stochastic Indicator.
So, here is a quick recap:
- Stochastic Oscillator is a technical indicator used to assess the momentum of a price.
- The indicator is represented by two separate lines that travel in sync with each other between three zones – oversold, overbought, and neutral zone.
- The indicator is bounded between 0 and 100. It oscillates, that is why it is called a Stochastic Oscillator.
- A Stochastic Oscillator belongs to a group of leading indicators – those that provide insights about future market shifts before they actually happen.
- The application of a Stochastic Indicator ranges from facilitating entry into new positions and anticipating market reversals to guiding the exit from existing trades in anticipation of market corrections or reversals.
- The Stochastic Oscillator is pretty good on its own, but it becomes even more powerful when you team it up with some smart risk management tactics. And guess what? One of the coolest risk management tools out there is setting up stop losses, and the real MVP indicator for that job is none other than ATR.
If you’re just starting out and you’re the type of trader who puts their stop loss placements by eye, it’s time to hit the brakes and check out a guide we’ve put together all about the Average True Range.
Start Trading STOCH With GoodCrypto!
Making sense of the Stochastic indicator is no rocket science. All you need is determination, knowledge (which you can get from this helpful guide), and a decent trading platform to try out your strategies and see how the indicator works in real situations.
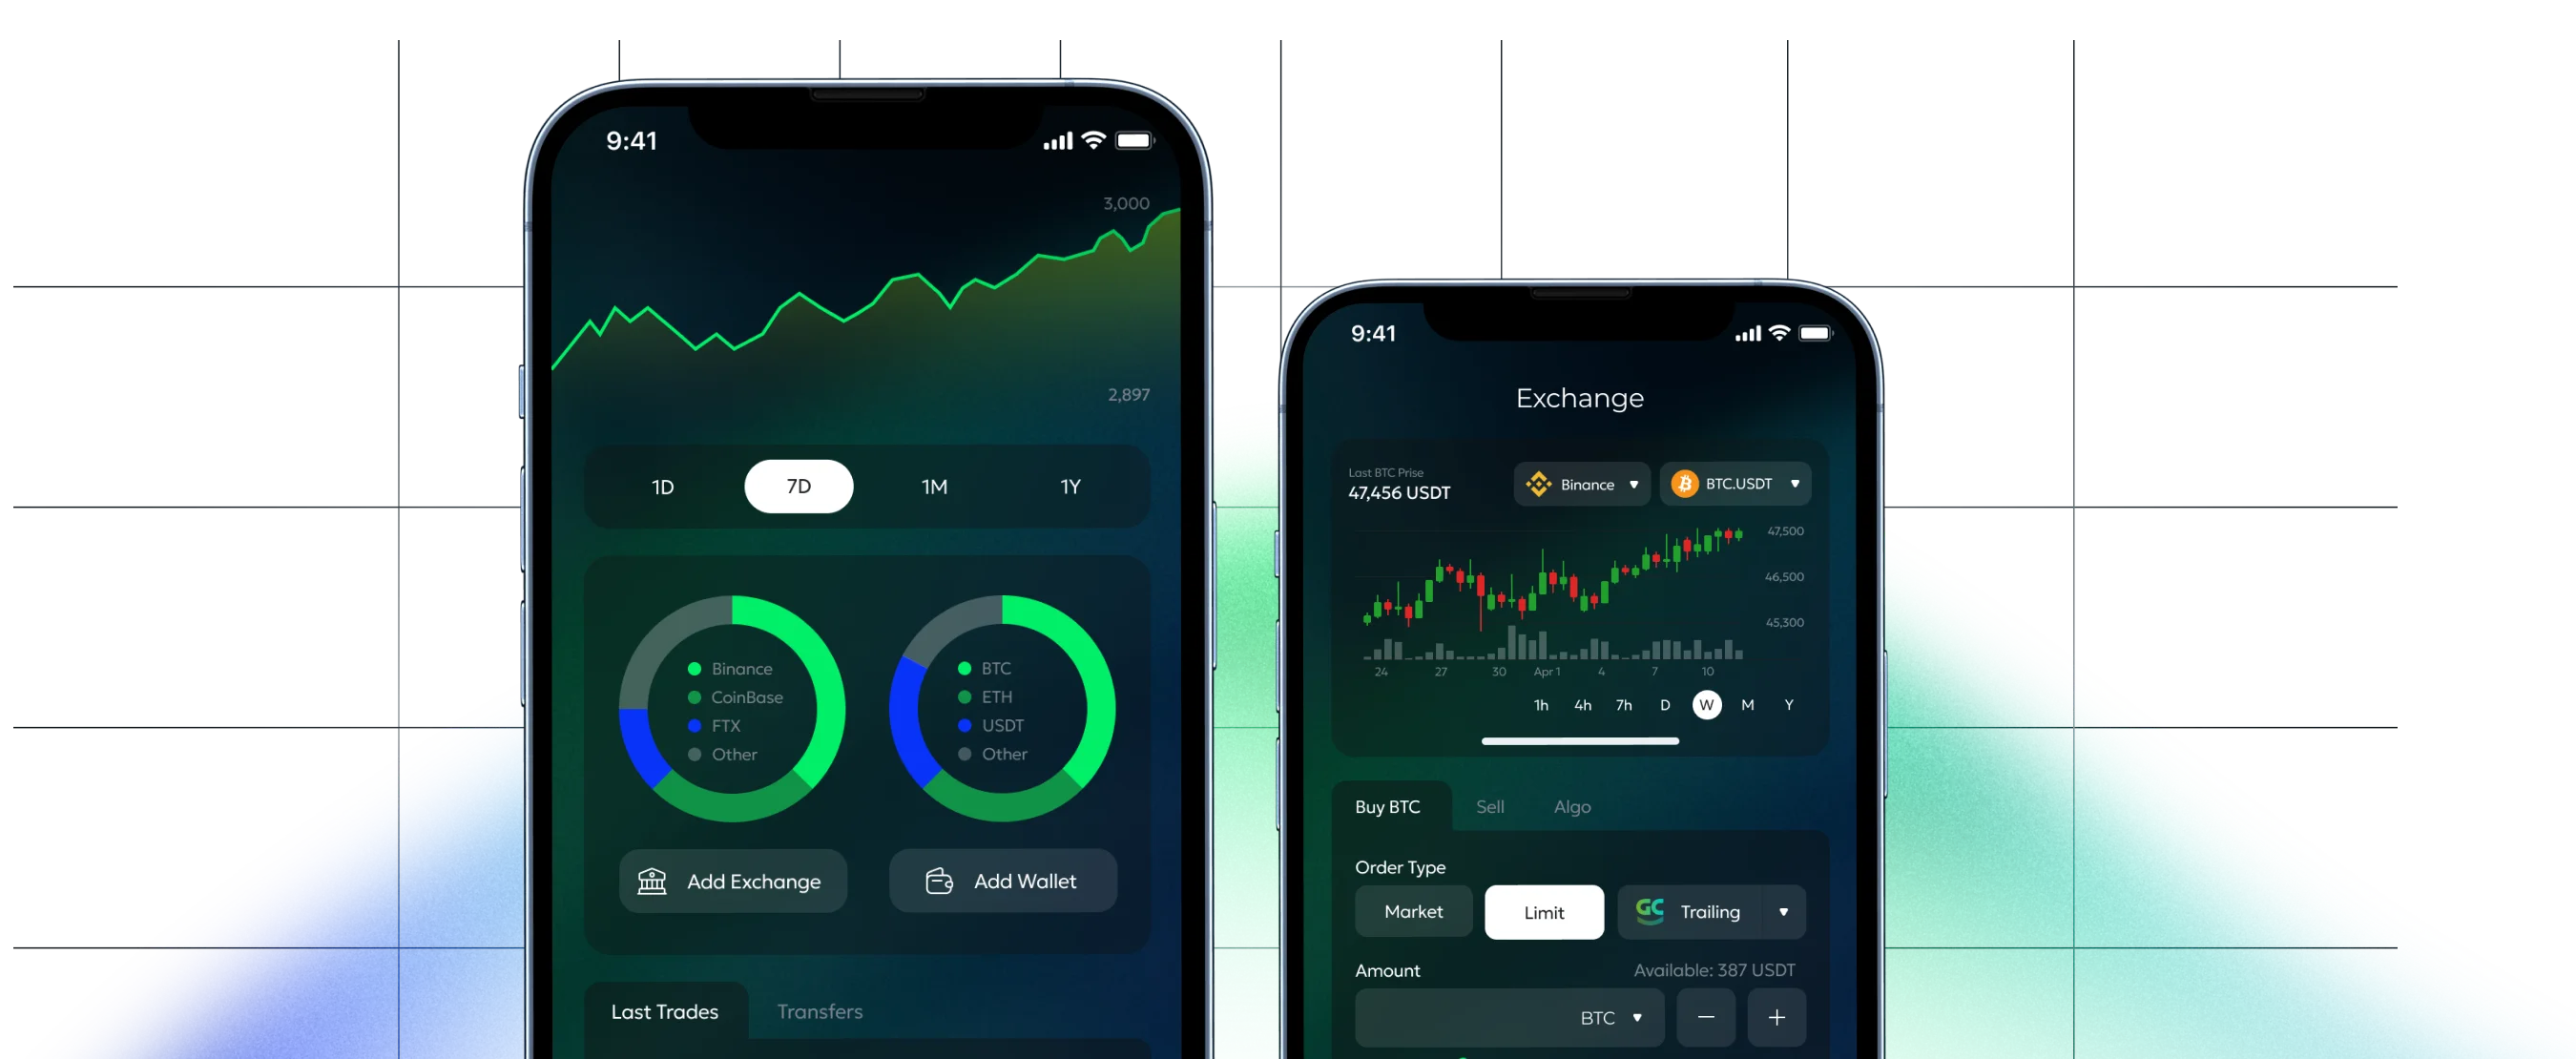
GoodCrypto stands out as a revolutionary crypto trading terminal that offers traders a premium selection of crypto trading tools currently available in the market:
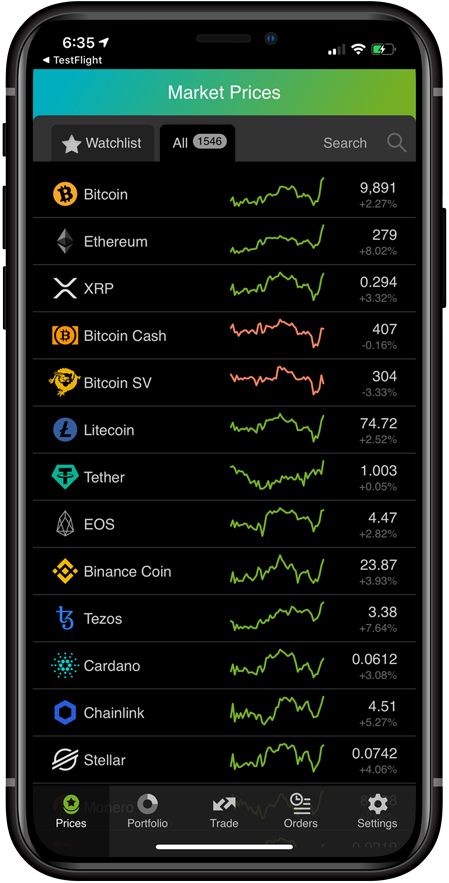
- The platform provides real-time data for thousands of cryptocurrencies from various exchanges.
- GoodCrypto integrates with 36 cryptocurrency exchanges, allowing users to track and trade across over 20,000 markets all in one place.
- With the help of the GoodCrypto app you can monitor your crypto holdings and portfolio performance effortlessly without having to hop between multiple exchanges.
- The platform offers a suite of technical analysis tools, including indicators like the Stochastic indicator, moving averages, momentum oscillator and more.
- Employing advanced trading bot strategies like DCA, Grid, and Infinity Trailing can not only minimize stress and potential losses but also allows you to make the most of various market cycles and opportunities.
- GoodCrypto users get the ability to trigger any order or algorithm on any exchange using the TradingView webhooks.
- The app enables you to set up custom alerts for price changes, volume spikes, and other important market events.
Last but certainly not least, you can find Good Crypto on both the iOS App Store and the Android Play Store. This means that everyone can experience the best features our training app has to offer.
Still have questions?
Connect with the public chat room in Telegram and ask anything, 24/7.