“The object is more likely to stay in motion until an external force is applied to it” – the law of inertia (Newton’s 1st law). Physics and economics are two distinct areas of study with their own methodologies and rules, but they can also be interconnected in certain situations. For instance, the concept of “momentum” originally came from physics.
Similarly, the market in motion tends to stay in motion rather than in reverse. The momentum of an asset’s trend slows before it changes direction. Trends tend to continue. That’s why traders utilize momentum indicators to determine when a trend will change, when they should buy, and when to sell.
There are several reasons why price momentum happens. The most straightforward explanation is buyers are drawn to rising prices, while sellers are drawn to declining prices. The indicator based on the price’s momentum can be traded on short time frames before the trend dries out – that’s why the Momentum Oscillator is more suitable for day trading strategies.
The class of momentum indicators includes at least 20 technical indicators. The most popular ones, like RSI, MACD, and AO, have already been covered in the GoodCrypto blog. It is high time we broke down another momentum indicator – the Momentum Oscillator (MOM) – and tested a few potentially profiting strategies with it.
Excited? We are too! So, let’s get this article started with what is a Momentum Indicator.
What is a Momentum Oscillator (MOM)?
Basically, Momentum Oscillator is a technical indicator that measures and showcases the strength or speed of a price movement. The MOM indicator compares the most recent price to a previously determined price and measures the velocity of the price change. Traders choose whether a price momentum is increasing/decreasing to identify entry and exit points.
Despite being the oscillator-type indicator, MOM is unbounded, which means that there are no overbought or oversold levels on the chart to be looking at. That being said, the MOM indicator should be paired with RSI or Stochastic Oscillator to find out the actual asset’s value compared to its true value.
Momentum Indicator Formula
The momentum indicator may be defined as the pace of change in the price of a financial instrument over a given time frame. Essentially, the Momentum Oscillator showcases the difference between two prices: the most recent closing price in relation to a previous closing price from any time range.
MOM Formula: (Current Close/Close N Periods Ago)*100
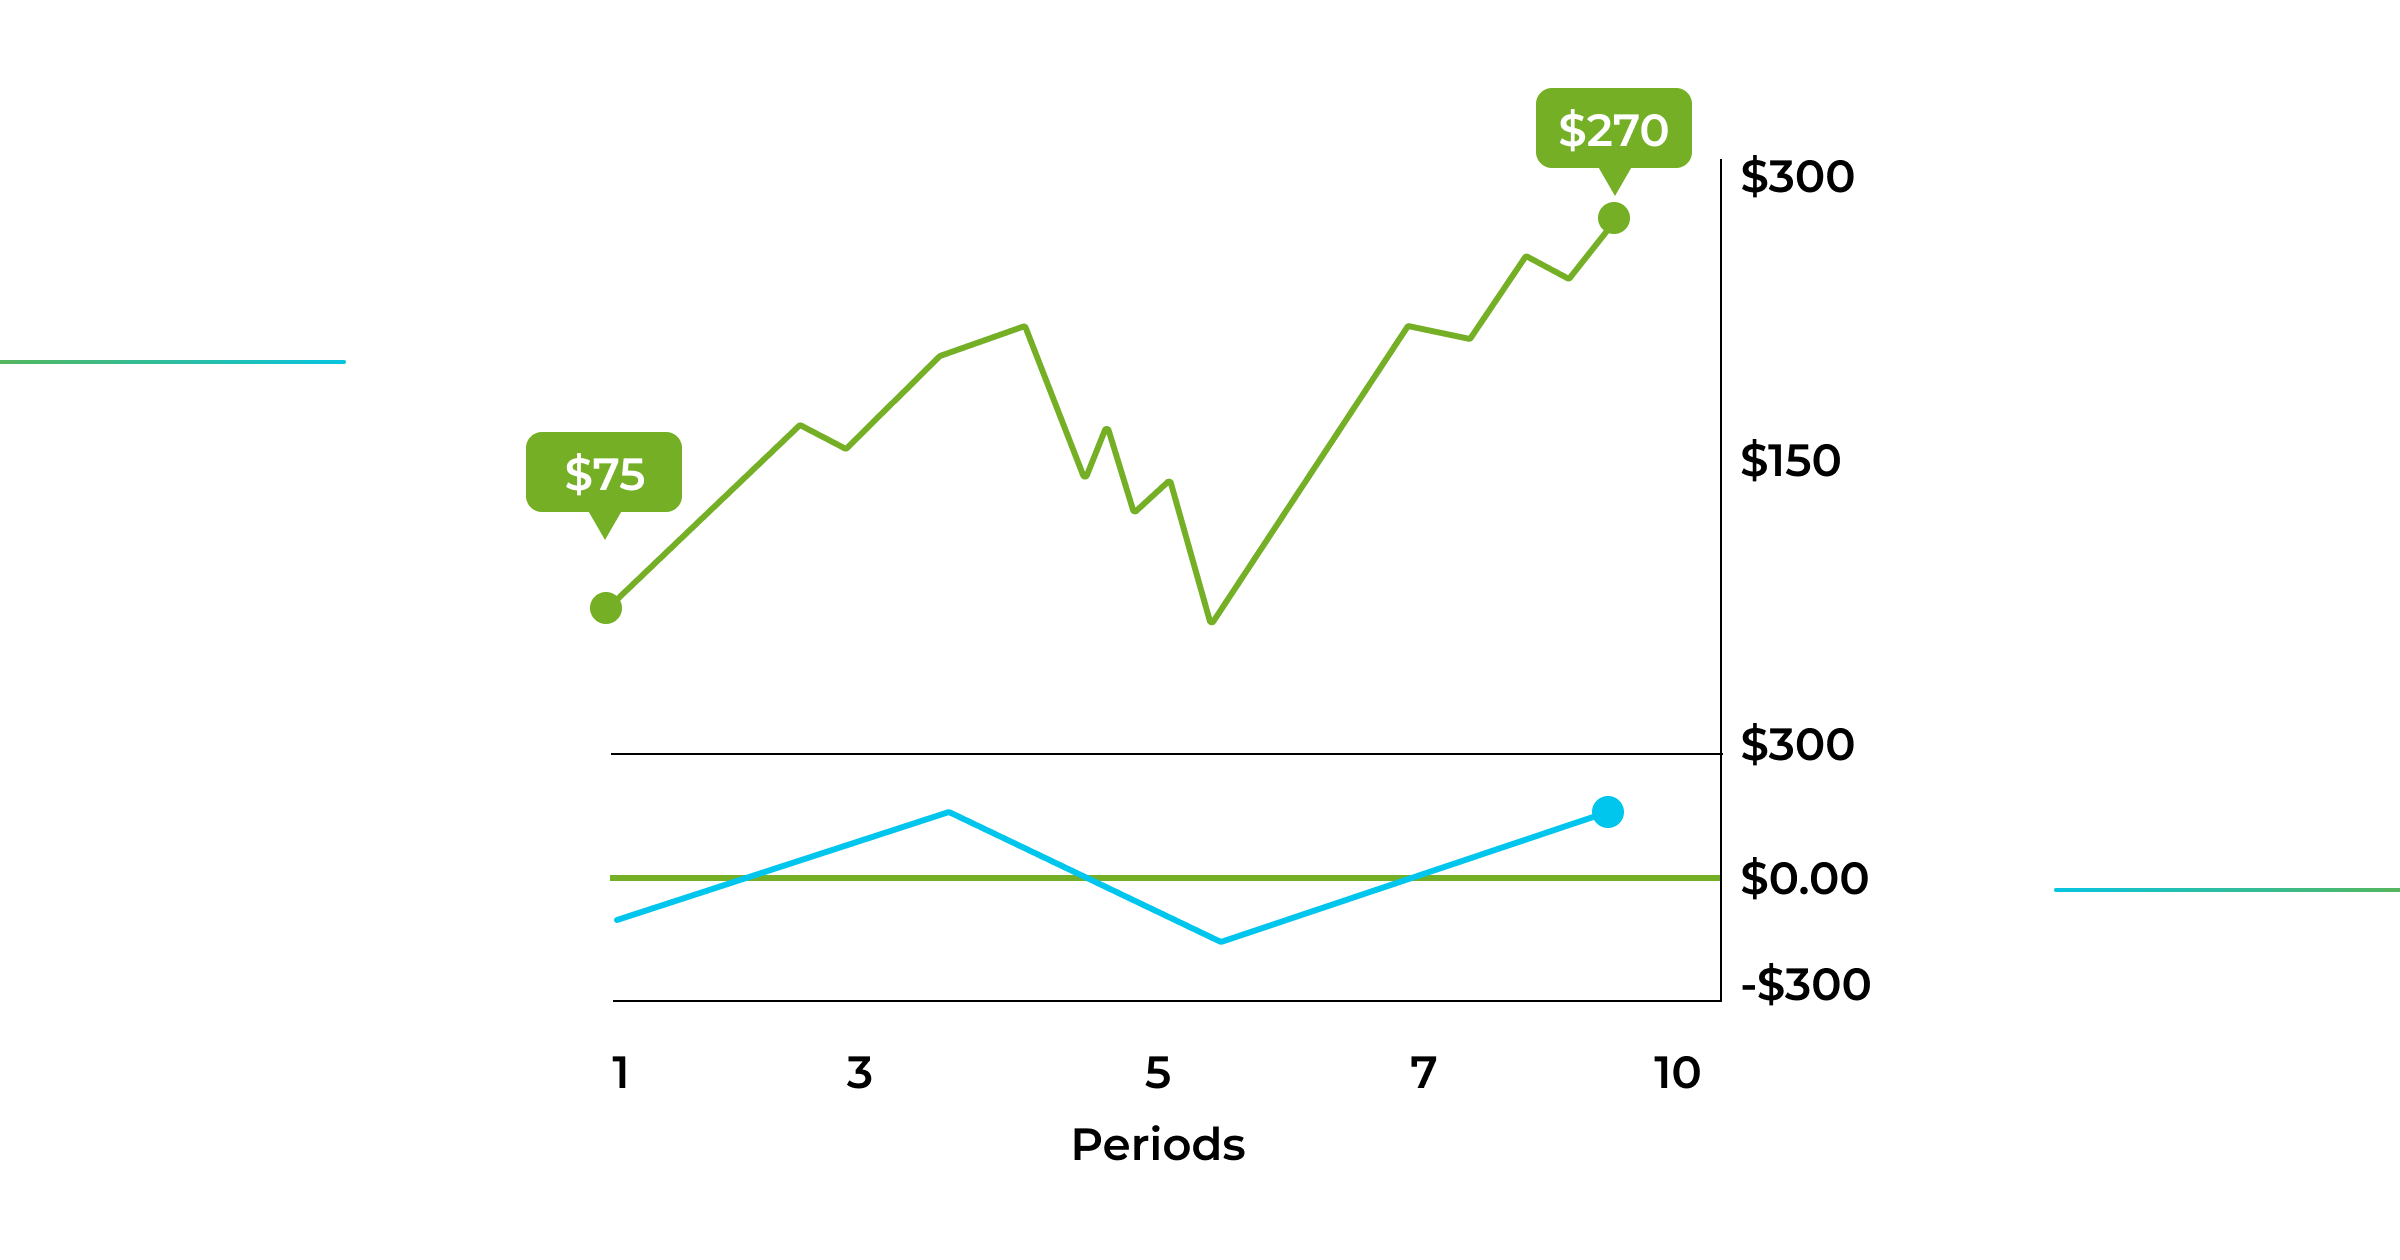
The default “N” value configurations are set to 10 periods. However, a trader can easily change it in the indicator’s settings tab.
The indicator plots the calculated values on the trading chart as a single line.
In short, if today’s price is the same as it was, say, 10 days ago, the indicator plots its value at the zero line; consequently, if today’s price is higher than it was 10 days ago, the indicator plots above the zero line and vice versa.
Note: Zero line isn’t included in the chart by default. You have to add it yourself.
The MOM indicator oscillates around the zero line, and when it crosses it, some investors might consider this a possible entry or exit signal.
A market where the price changes with large price jumps means the momentum increases and the MOM indicator increases. When the price changes with smaller jumps, the momentum declines, and the MOM indicator starts going down.
How to Read Momentum Indicator?
Let’s not forget that the concept of momentum comes from physics because all the statements below are based on laws and patterns on how objects gain and lose momentum:
- If the Momentum Oscillator makes a new high, we expect to see a new high made in price. As traders, we want to buy the next pullback since the price starts gaining upward momentum.
- We expect lower prices if a new low on the MOM chart is made. As traders, we want to go short on the next price bar since the price starts gaining a downward momentum.
- If a price makes new lower lows, but the MOM indicator makes higher lows, the market’s downward momentum is weakening- also known as a bullish divergence. As traders, this may be the time to enter the position.
- If a price makes new lower lows, but the MOM indicator makes higher lows, the market’s downward momentum is getting weaker – it is also known as a bullish divergence. As traders, we might want to enter the position.
- Imagine you are throwing an object up. Before it falls down to you, its upward momentum slows, and it changes direction. The same rule applies to price – a price trend slows down before it changes direction.
Remember that seeing price momentum increase is a sign, not a guarantee, that the current direction will continue.
How to Use a MOM Indicator on GoodCrypto?
Most trading platforms include the Momentum Oscillator in their set of technical indicators. GoodCrypto is not an exception.
If you are looking for a service with free access to primary and advanced technical indicators, GoodCrypto should be the first one on your mind. An interactive trading chart for price monitoring & technical analysis is only one of its many features. GoodCrypto is recognized as one of the industry’s best crypto portfolio management apps. The platform boasts many valuable tools designed to sync your exchanges, wallets, and cryptocurrency investments in one app and streamline your trading experience with sophisticated features, including advanced order options.
However, we don’t generally set up any of the trading bots or TP/SL orders until we’ve evaluated the market of our interest. In this article, we are breaking down how we analyze price movements using the MOM indicator in particular.
To get started, you need to set up the Momentum Oscillator.
P.S. The following guidelines apply to using the GoodCrypto app or its web version. MOM indicator settings may differ depending on the platform of your choice.
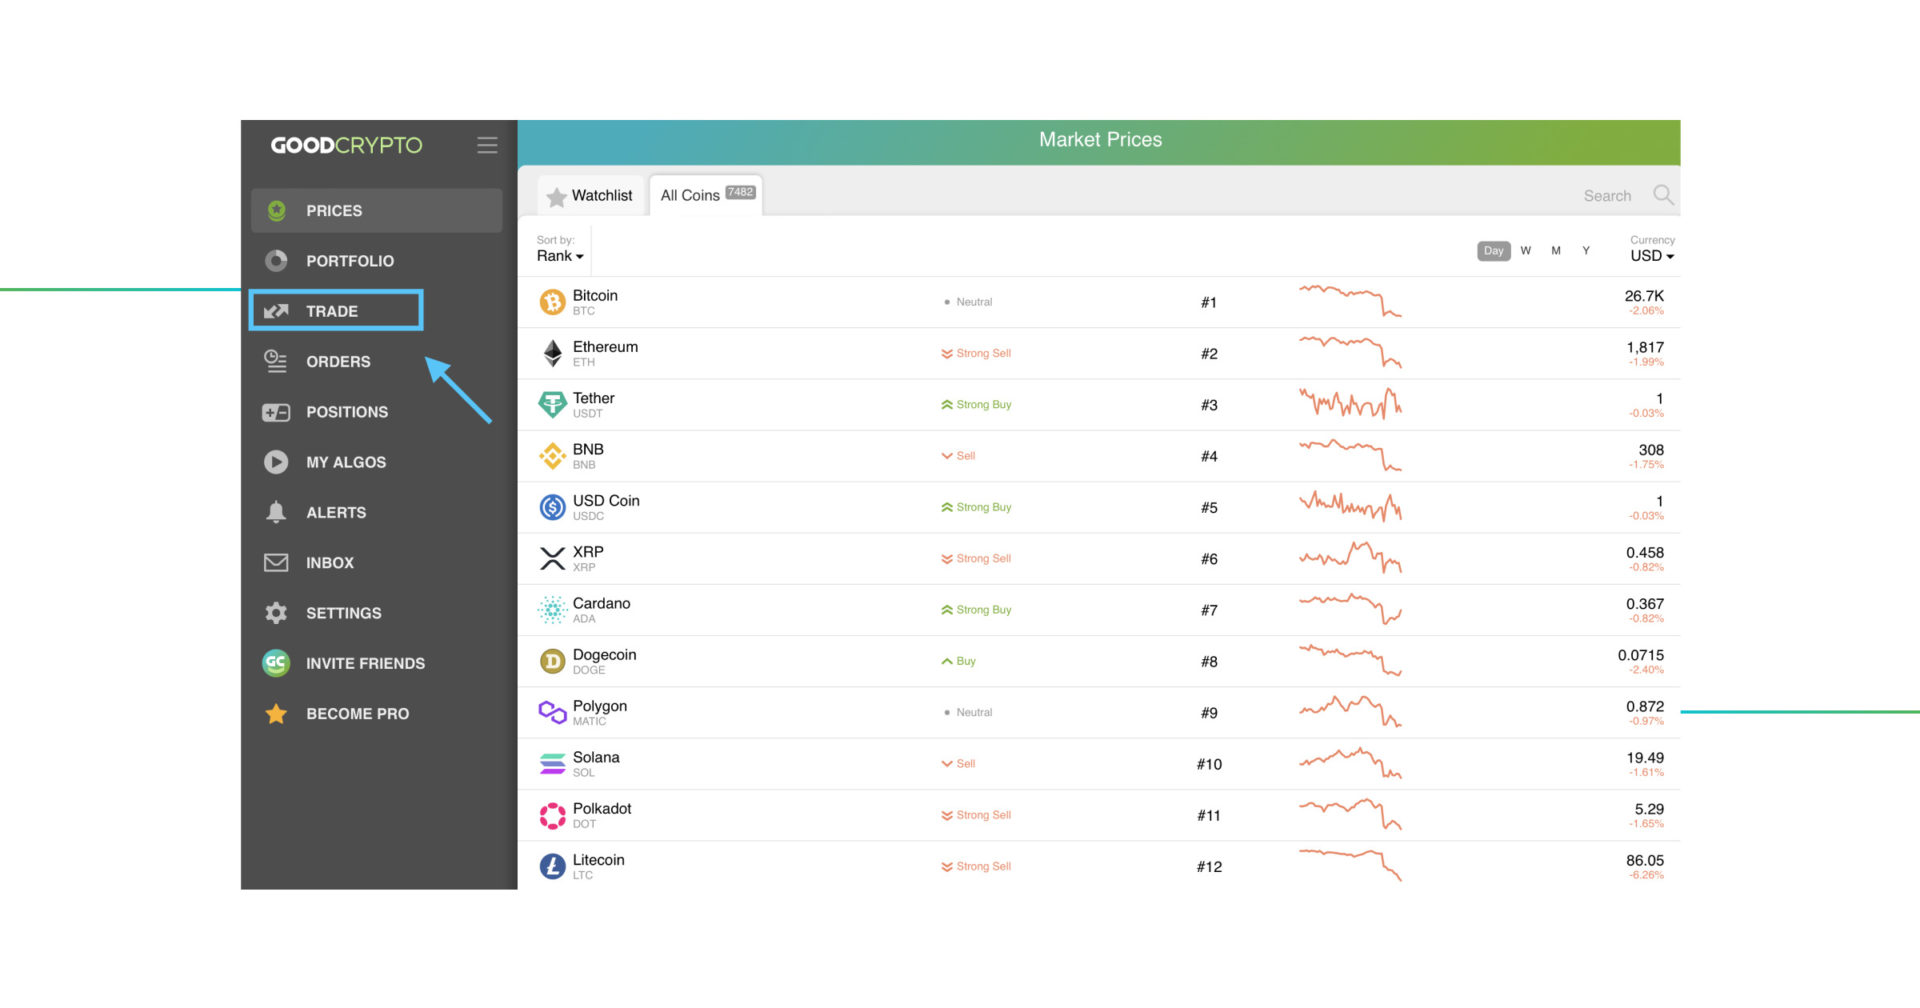
Step 1. To access the trading chart click “Trade” on the left sidebar.
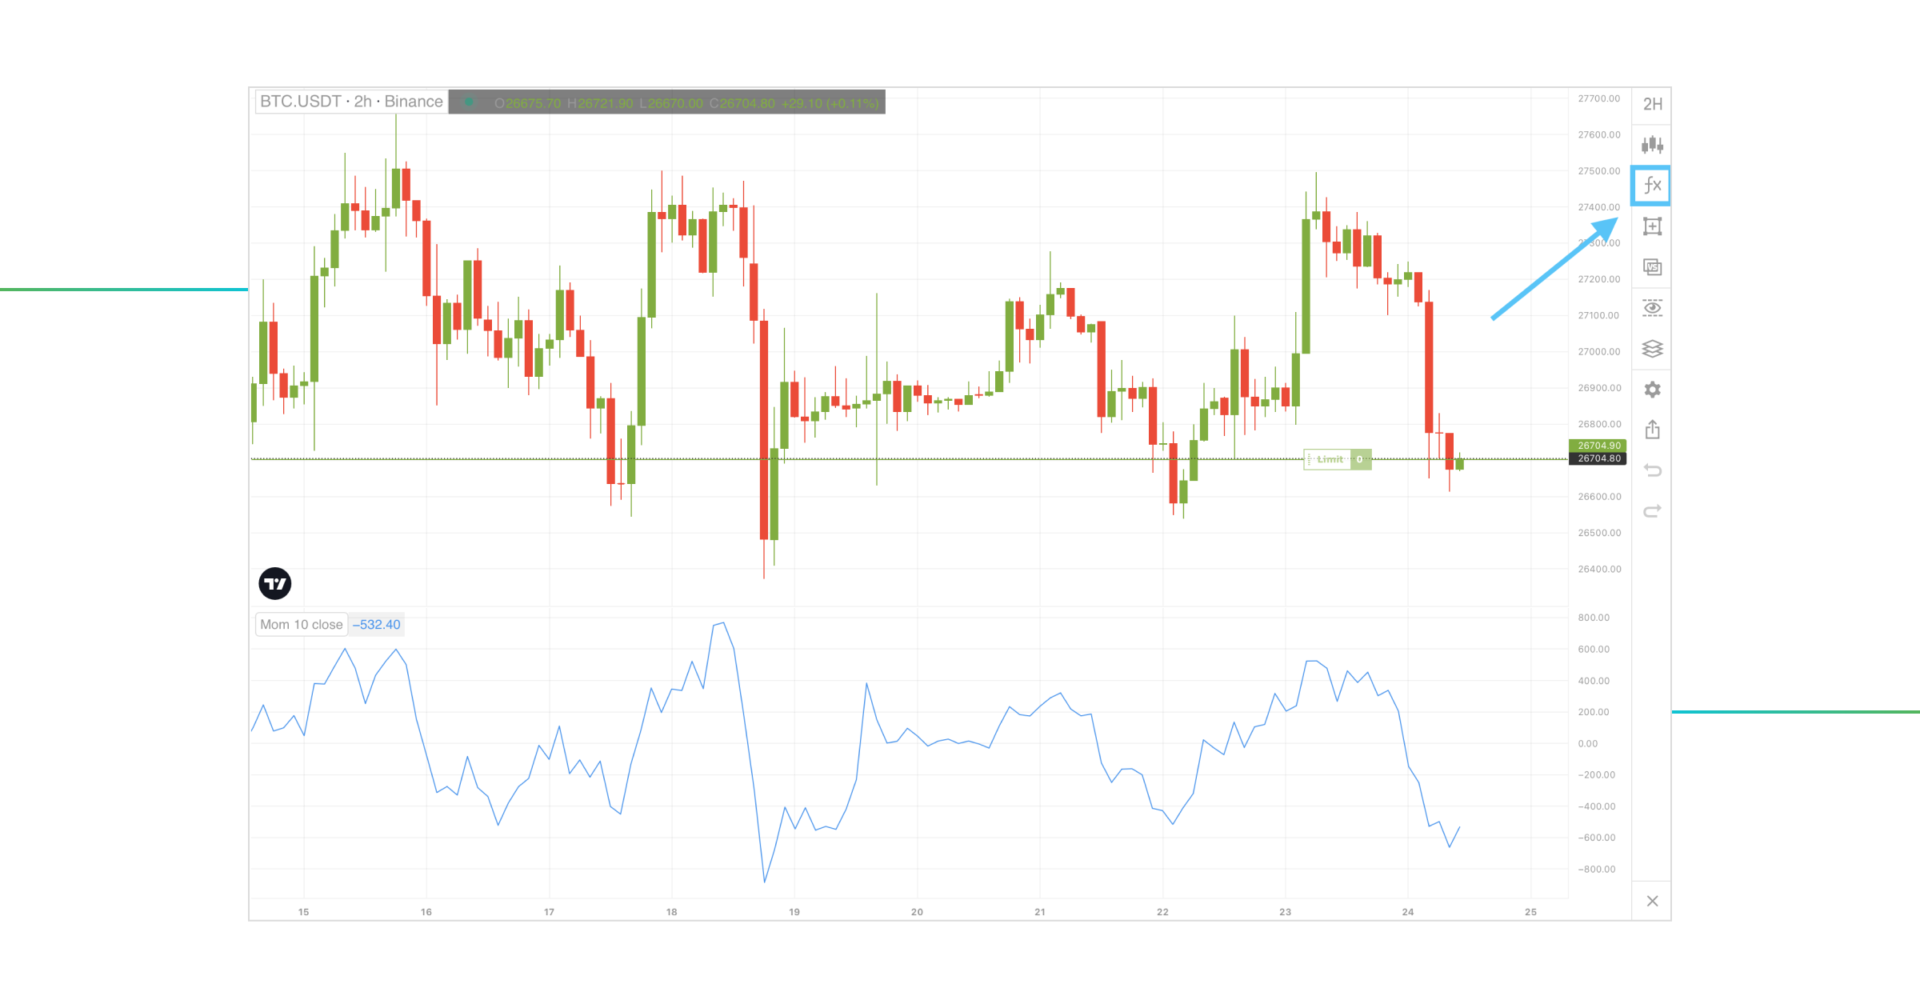
Step 2. Find the “fx” symbol on the left sidebar of the chart and search for the “MOM” indicator.
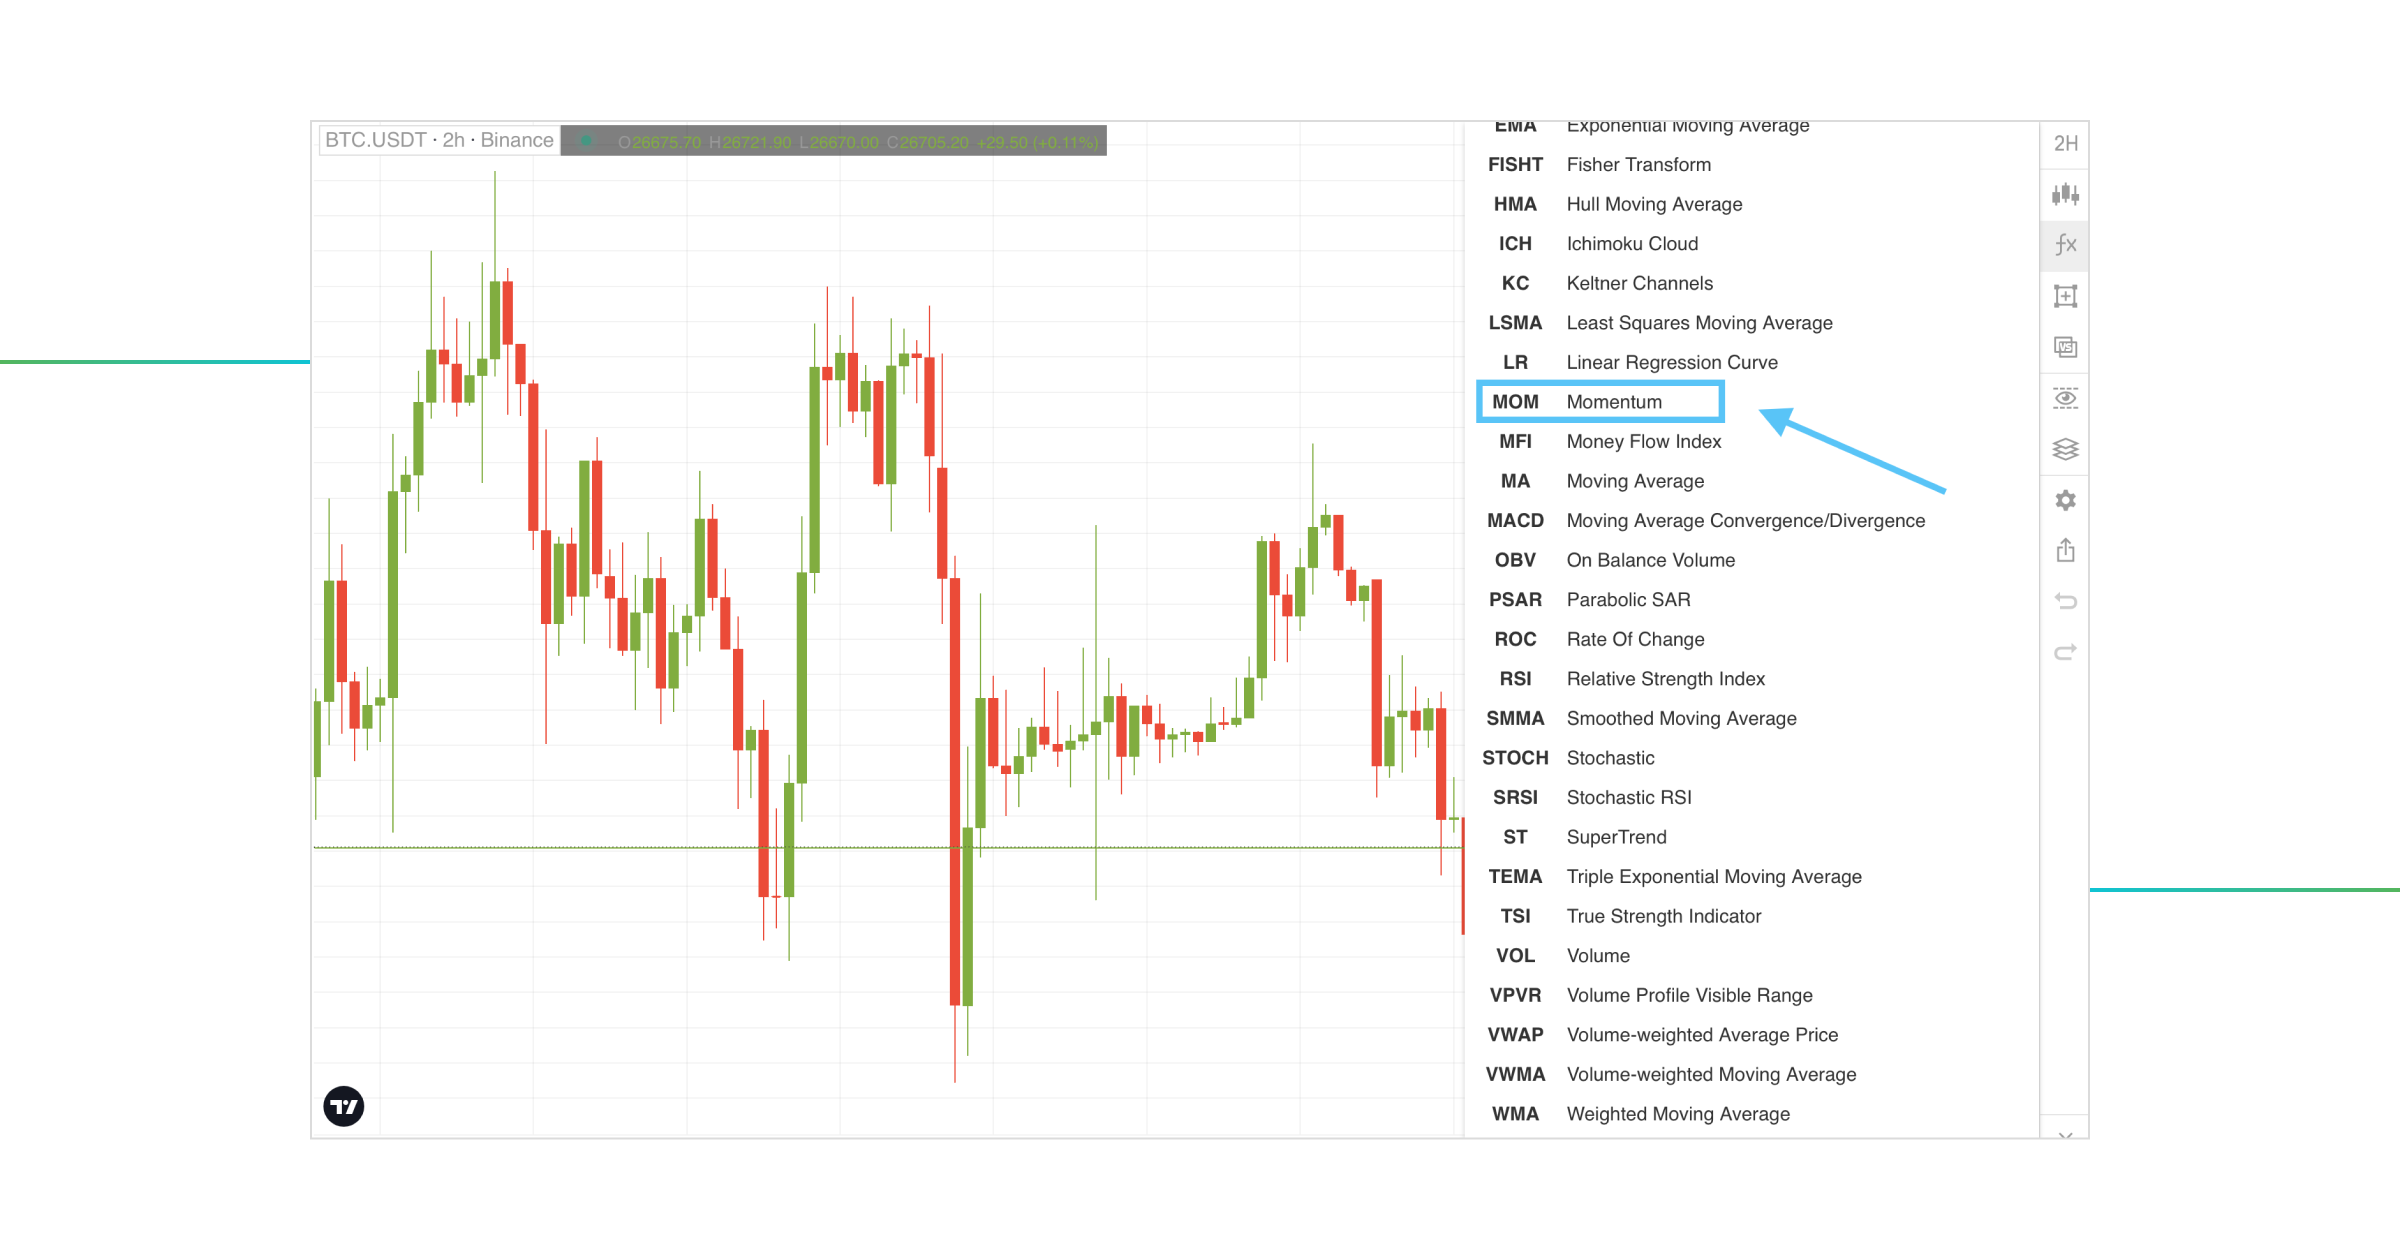
Step 3. Select the indicator which will appear beneath your crypto chart.
Pick The Right Momentum Indicator Settings
As with most trading indicators, you can customize your Momentum Oscillator settings. To adjust the configurations of the Momentum Oscillator, click on the three dots near the indicator and then – the gear wheel icon.
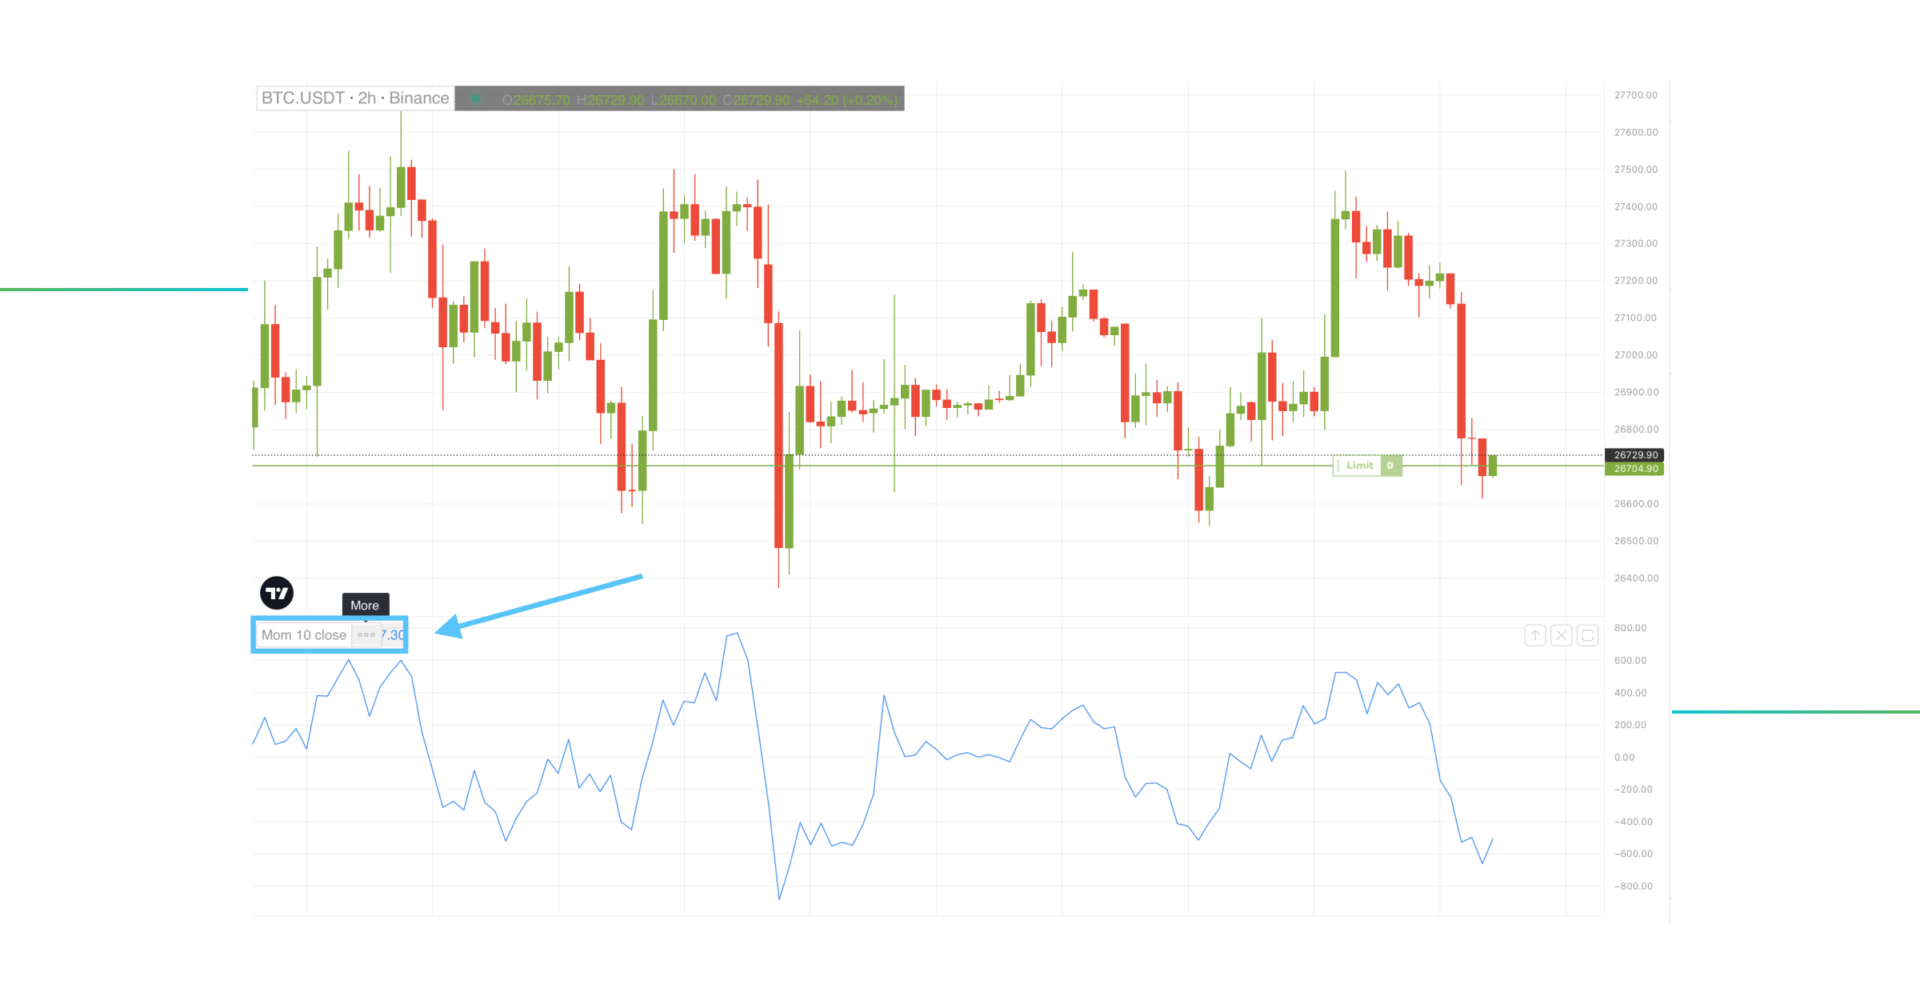
By default, MOM’s period length is set to 10 periods, meaning that on the daily chart, the Momentum Indicator will showcase the average data for 10 days. On the weekly chart – 10 weeks and so on. In theory, this setting can be modified to whatever you want. In the trading community, 7, 14, and 21 are considered the most common and effective.
- Lowering MOM’s period length values, you will make the indicator more sensitive, which can result in many false signals.
- Increasing MOM’s period length values will give you better signals since the indicator becomes less sensitive to price fluctuations.
Navigate to the “Style” tab to alter the color of the MOM indicator and the precision of price values.
By configuring the indicator’s settings under the “Visibility” tab, you can activate the timeframes you want the MOM indicator to display. This indicator modification is helpful for traders who conduct technical analysis on different timeframes.
Momentum Oscillator Trading Strategy
MOM Strategy #1: Zero Line Crossover
The simplest basic Momentum Indicator trading strategy is watching for when the MOM indicator crosses the Zero Line.
Below is the BTC/USDT chart with a MOM indicator attached:
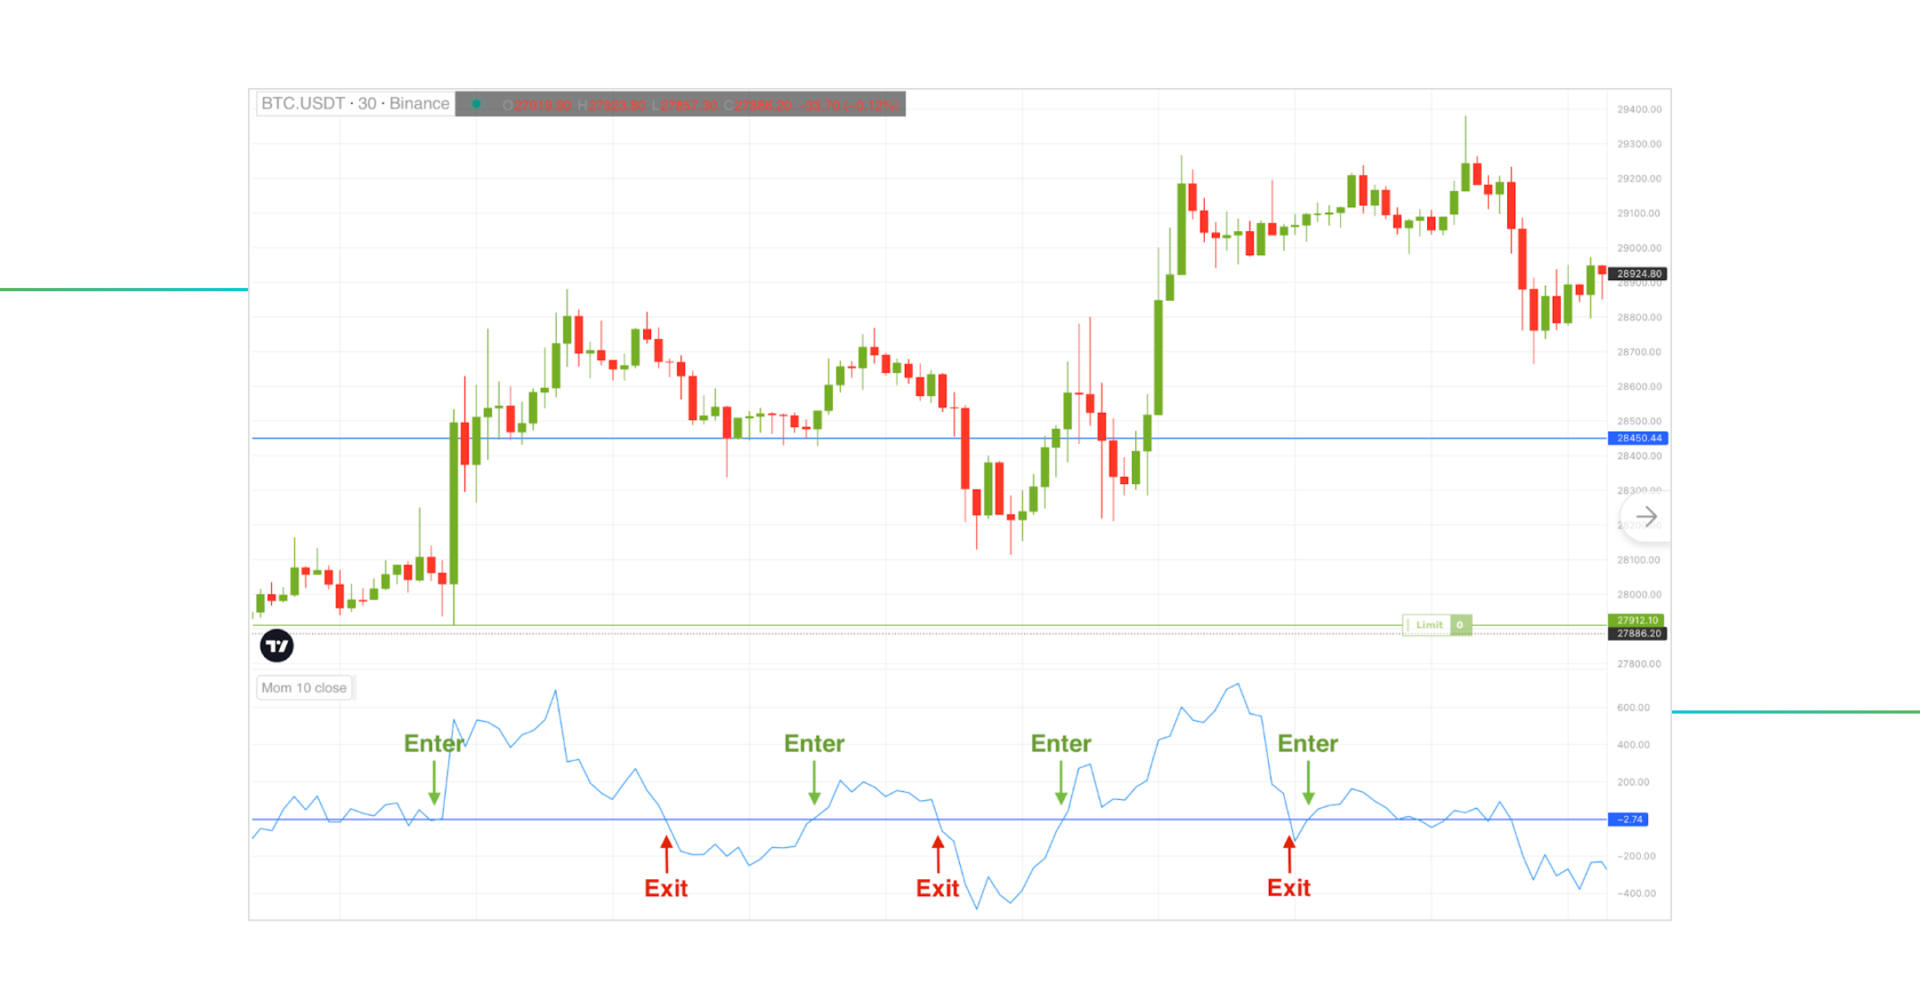
- Seeing a price crossing above Zero Line implies that an asset is gaining an upward momentum and is commonly viewed as a bullish signal.
- Seeing a price crossing below Zero Line implies that an asset is gaining a downward momentum and is commonly viewed as a bearish signal.
The premise behind this strategy is solely based on the fact that the Zero Line indicates that the price is the same as N periods ago, and the assets’ price rising or falling causes the Momentum Oscillator to cross the Zero Line from below or above accordingly.
But not all crossover points are reliable entry or exit signals. To help reduce the number of false signals, consider making MOM’s period length values higher, examine the overall market trend or apply price patterns.
MOM Strategy #2: Divergence Trading + EMA
The MOM indicator can also assist in detecting divergences on the chart. A divergence occurs when price movement differs from the evolution of the indicator, in our case, the Momentum Oscillator. Similar to other momentum indicators, like Stochastic or RSI oscillators, a divergence in the MOM indicator can hint at a potential price direction change.
There are 2 categories of price divergences: hidden divergence and classic (also known as regular) divergence. In contrast to classic divergence, which detects trend reversal, hidden divergence detects trend continuation.
Here we made a comprehensive cheat sheet that explains the difference between classic and hidden divergence:
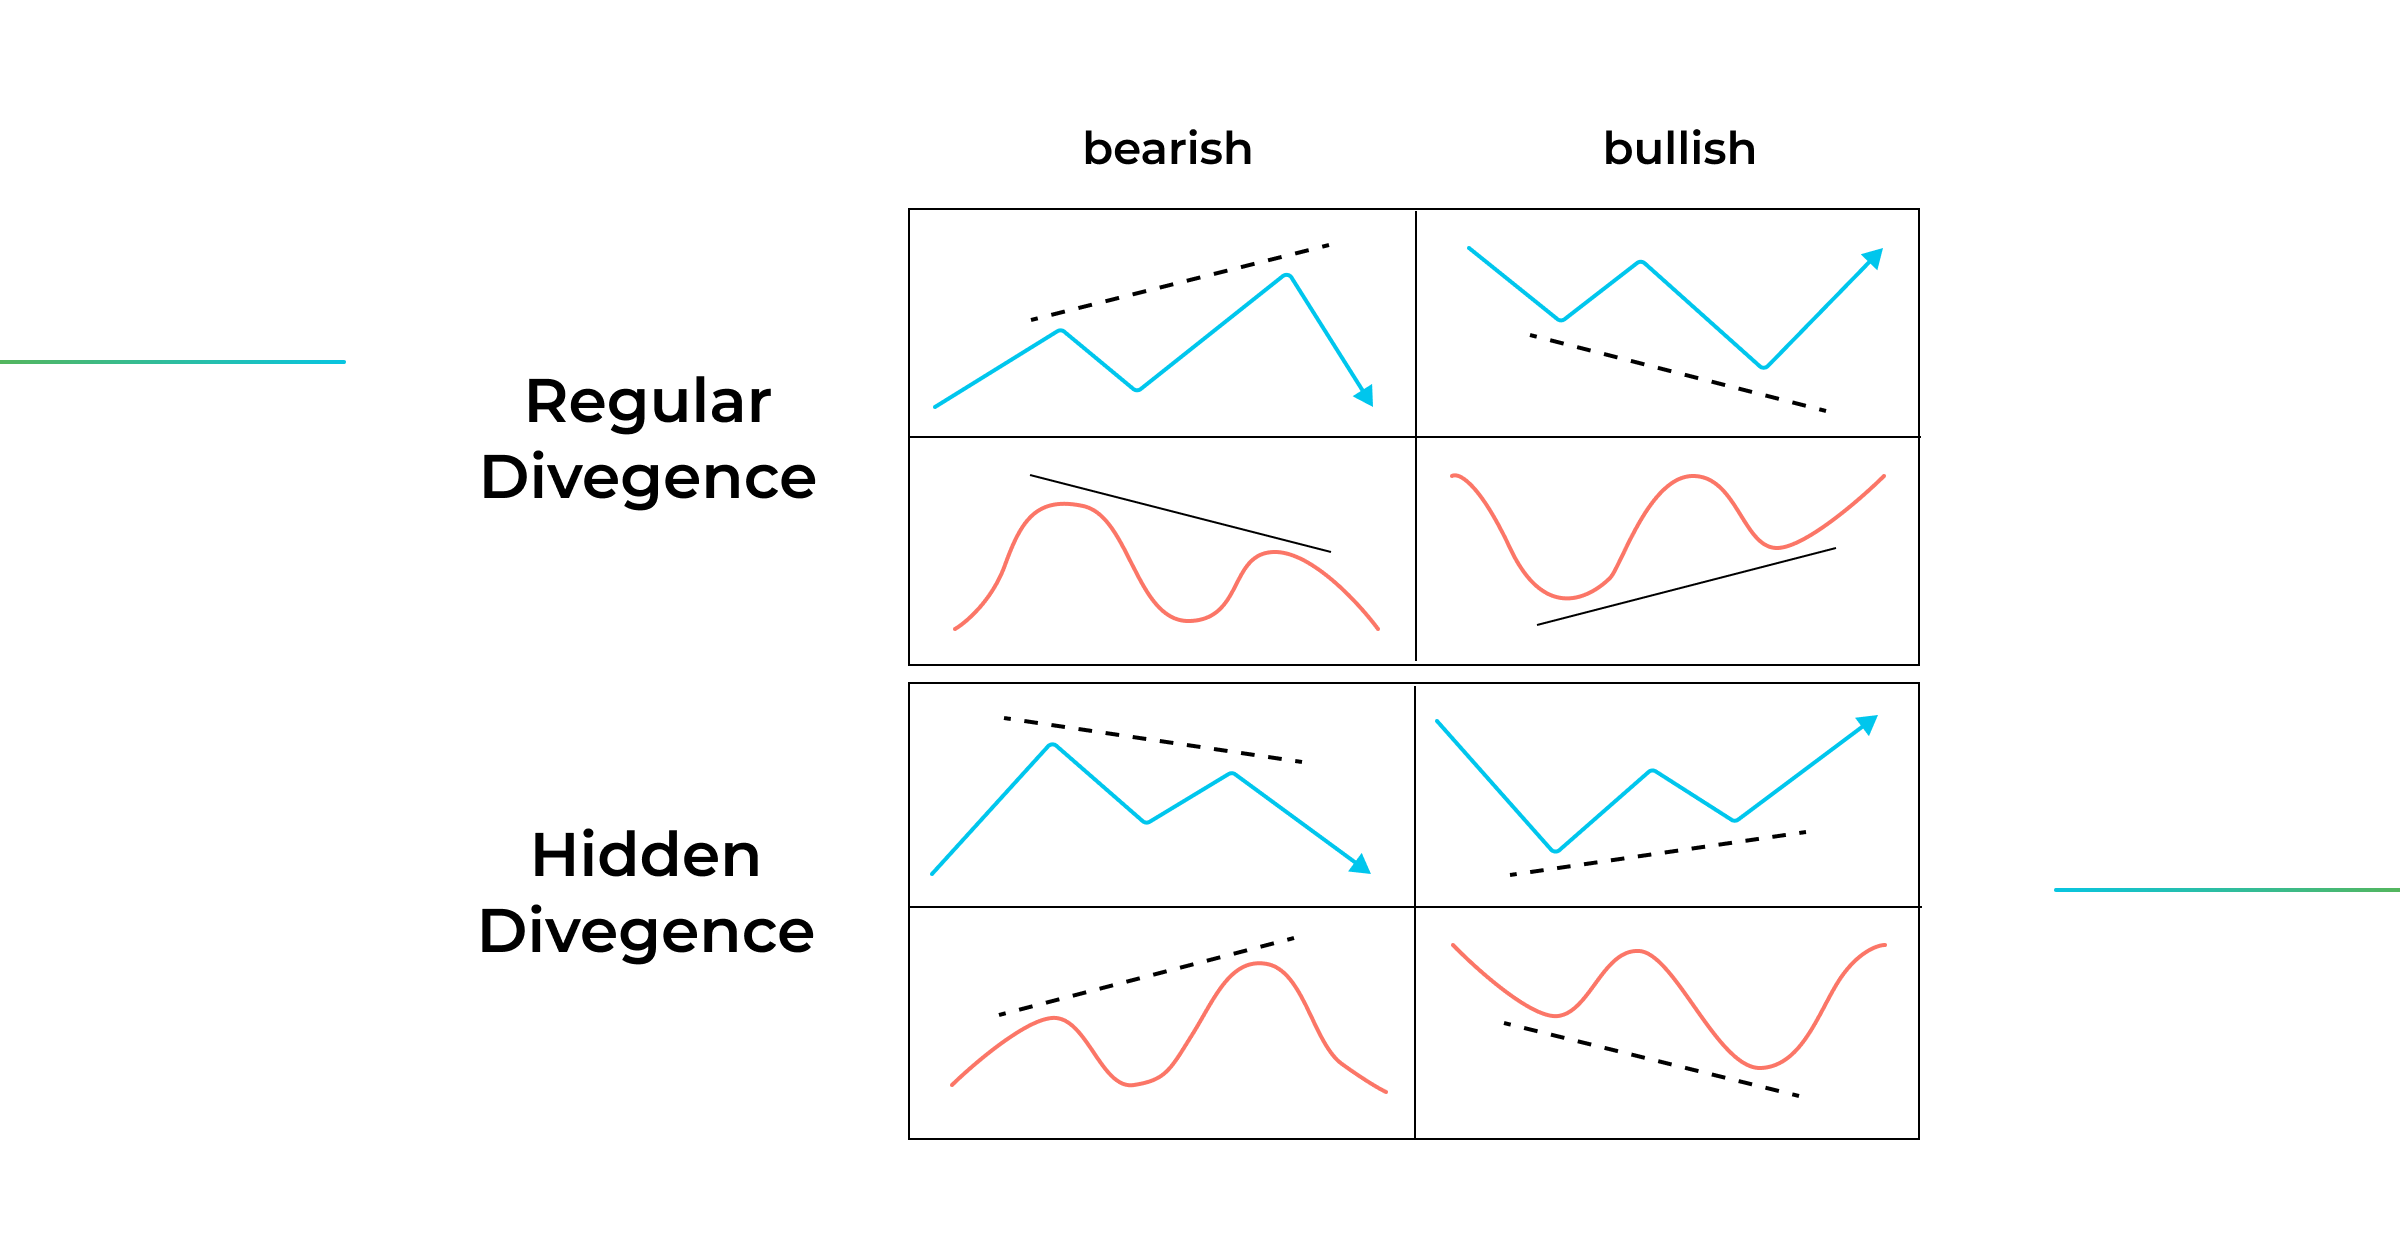
Now that we got acquainted with the fundamentals of divergence trading let’s look at the MOM divergence trading example.
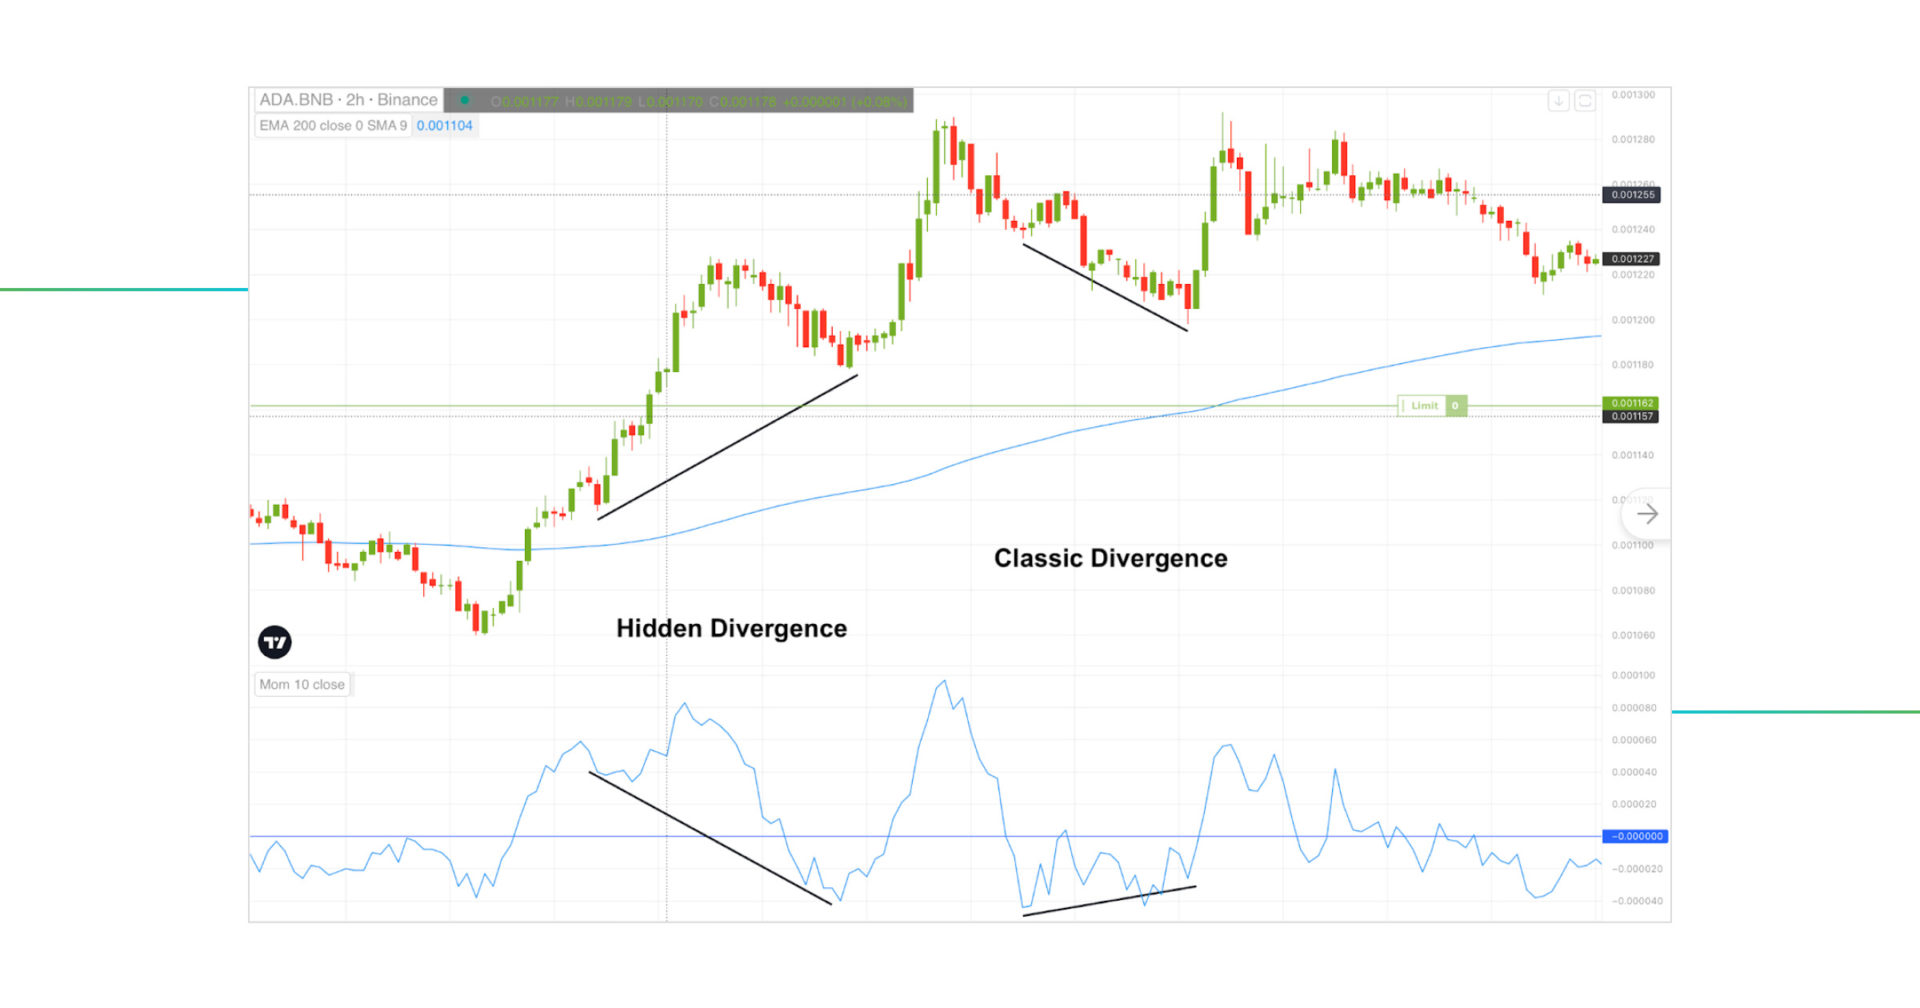
Aside from a Momentum Oscillator, we also attached a 200-period EMA to the chart to spot the direction of the long-term market trend.
Our Moving Averages Guide has already broken down 3 indicators: SMA, EMA, and WMA. We recommend reading this piece for the following reasons:
- Better understanding of the Exponential Moving Average that we are utilizing in this trading strategy;
- Making your mind around Moving Averages and how they are different from one another;
The basic 200-EMA rule is when the price trades above the 200-period Exponential Moving Average. It is considered an uptrend, implying that we should take a long position. Conversely, when the price is trading below the 200-day Exponential Moving Average, it is considered to be in a downtrend, implying that we should take a short position.
Suppose the price of an asset is trading above the 200-period EMA, suggesting an uptrend. In that case, traders may search for bullish divergence signals (both hidden and regular) on the lower side of the Momentum Oscillator. On the other hand, if the price is trading below the 200-period EMA, suggesting a downtrend, traders should look for bearish divergence signals (both hidden and regular) on the higher side of the Momentum Oscillator.
Our ADA/BNB chart shows that a market is trading in an uptrend, indicating that we should search for bullish divergence patterns. We have 2 MOM divergence signals: one hidden bullish divergence that suggests the continuation of the current trend and one classic bullish divergence.
Remember, if you plan to incorporate Momentum Oscillator into your trading strategy, consider using additional technical indicators and filters to reduce the market noise and avoid overtrading.
Other Popular Momentum Indicators
The class of momentum indicators includes some of the world’s well-known technical indicators, like RSI, MACD, William %R, ADX, and Stochastic RSI. In this section, we are going to cover each of these briefly.
- Moving Average Convergence Divergence (MACD)
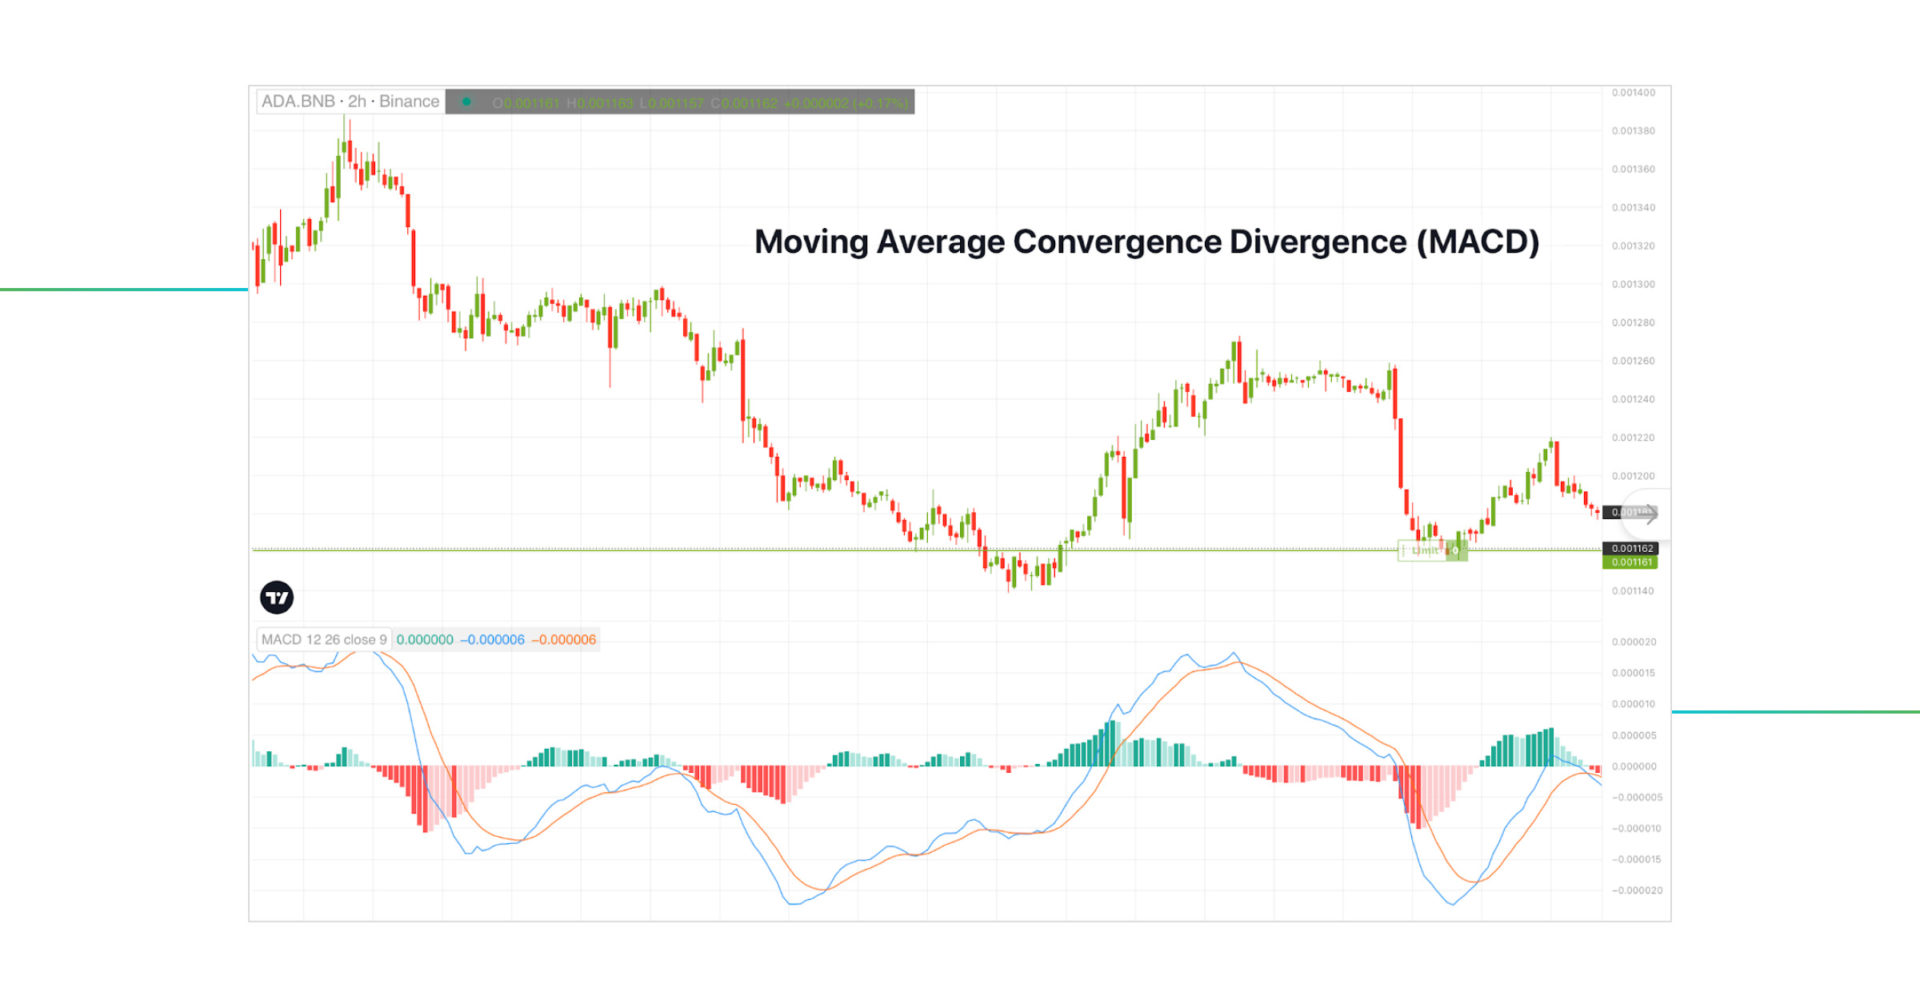
MACD is truly the most popular trend-following momentum indicator that calculates the difference between two exponential moving averages and plots them on a chart in the form of two lines (MACD line & Signal line) and a histogram. The indicator is mostly used to identify a change in the market trend direction, confirm and identify trading signals, and momentum shifts in the asset’s price.
- Relative Strength Index (RSI)
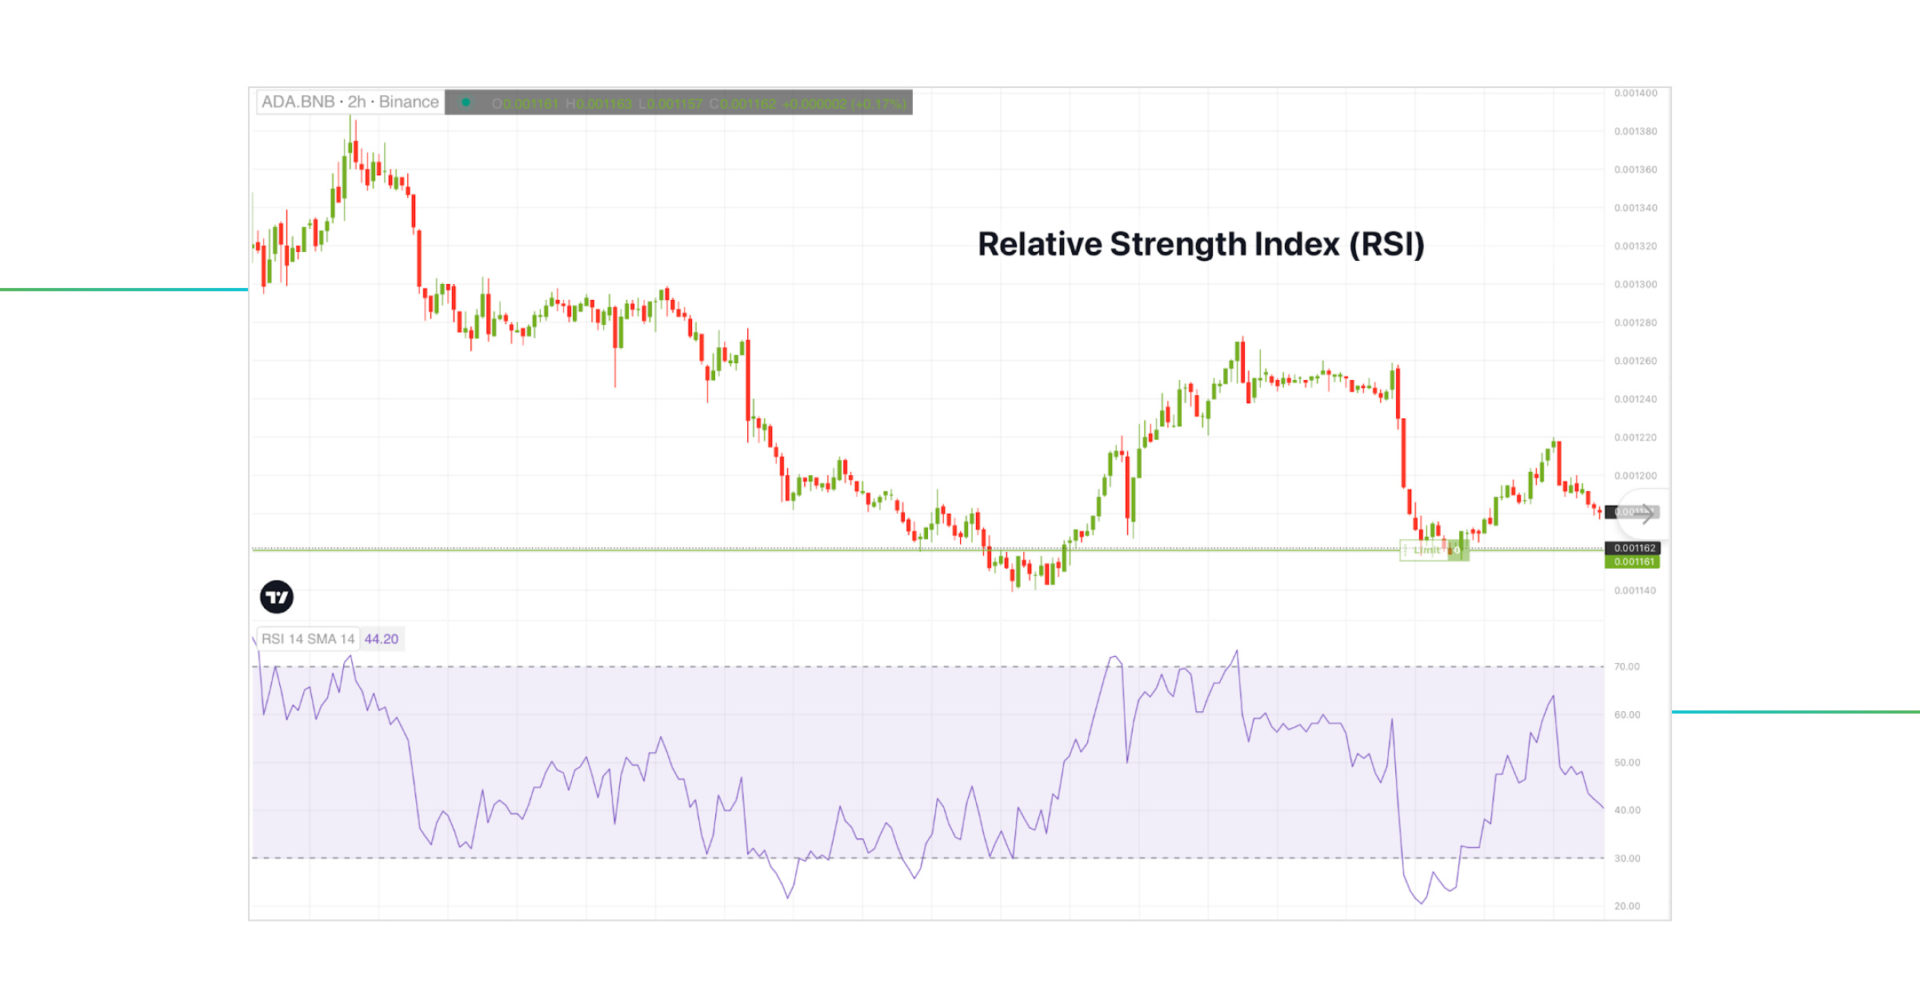
RSI is probably the most beloved momentum indicator among traders from the stock and crypto markets. The indicator oscillates on a scale between 0 and 100. With the help of the Relative Strength Index, traders can spot overbought and oversold market conditions, identify support/resistance levels, potential reversal, etc. Overall, RSI is the second most used trading indicator for a reason.
- Stochastic RSI (SRSI)
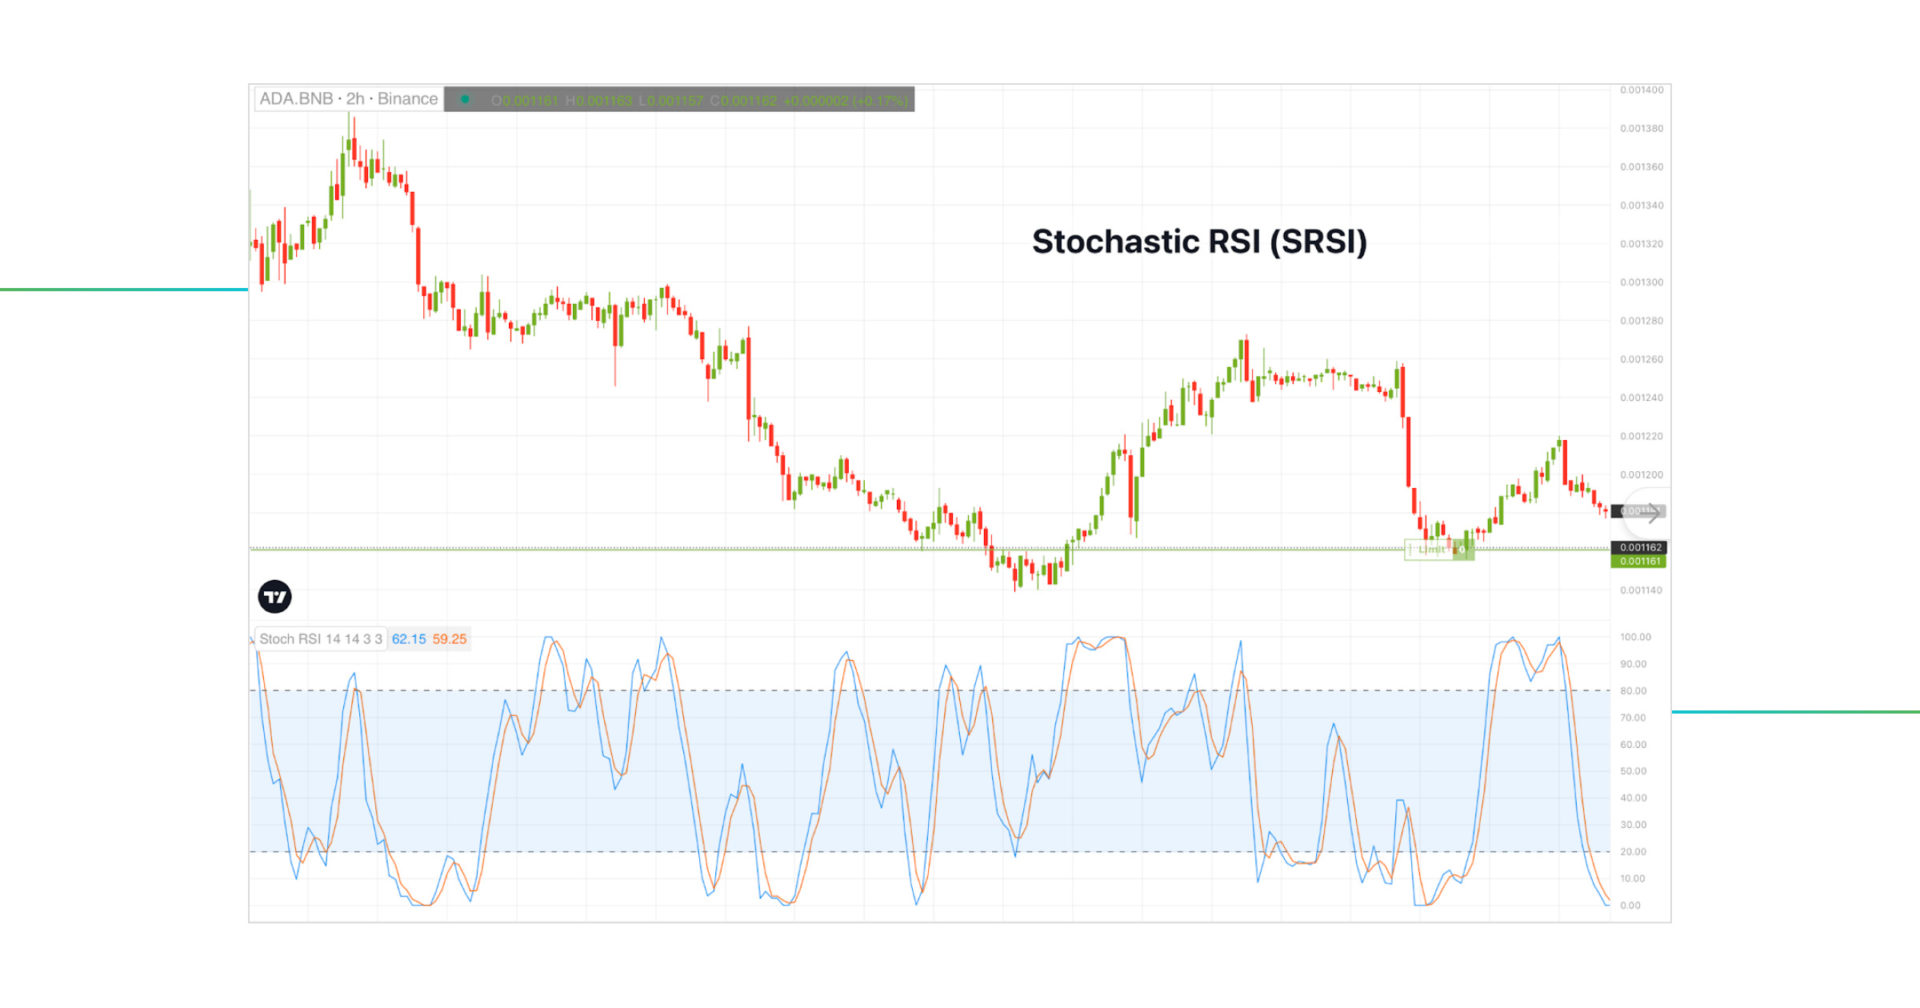
Stochastic RSI combines two widely recognized technical indicators: RSI and Stochastic. Like the Relative Strength Index, Stochastic RSI helps traders identify overbought and oversold market conditions. SRSI is more sensitive to price fluctuations than the famous RSI indicator. By using RSI values in combination with the Stochastic formula, traders can determine whether the current RSI value is overbought or oversold.
- Williams Percent Range (Williams %R)
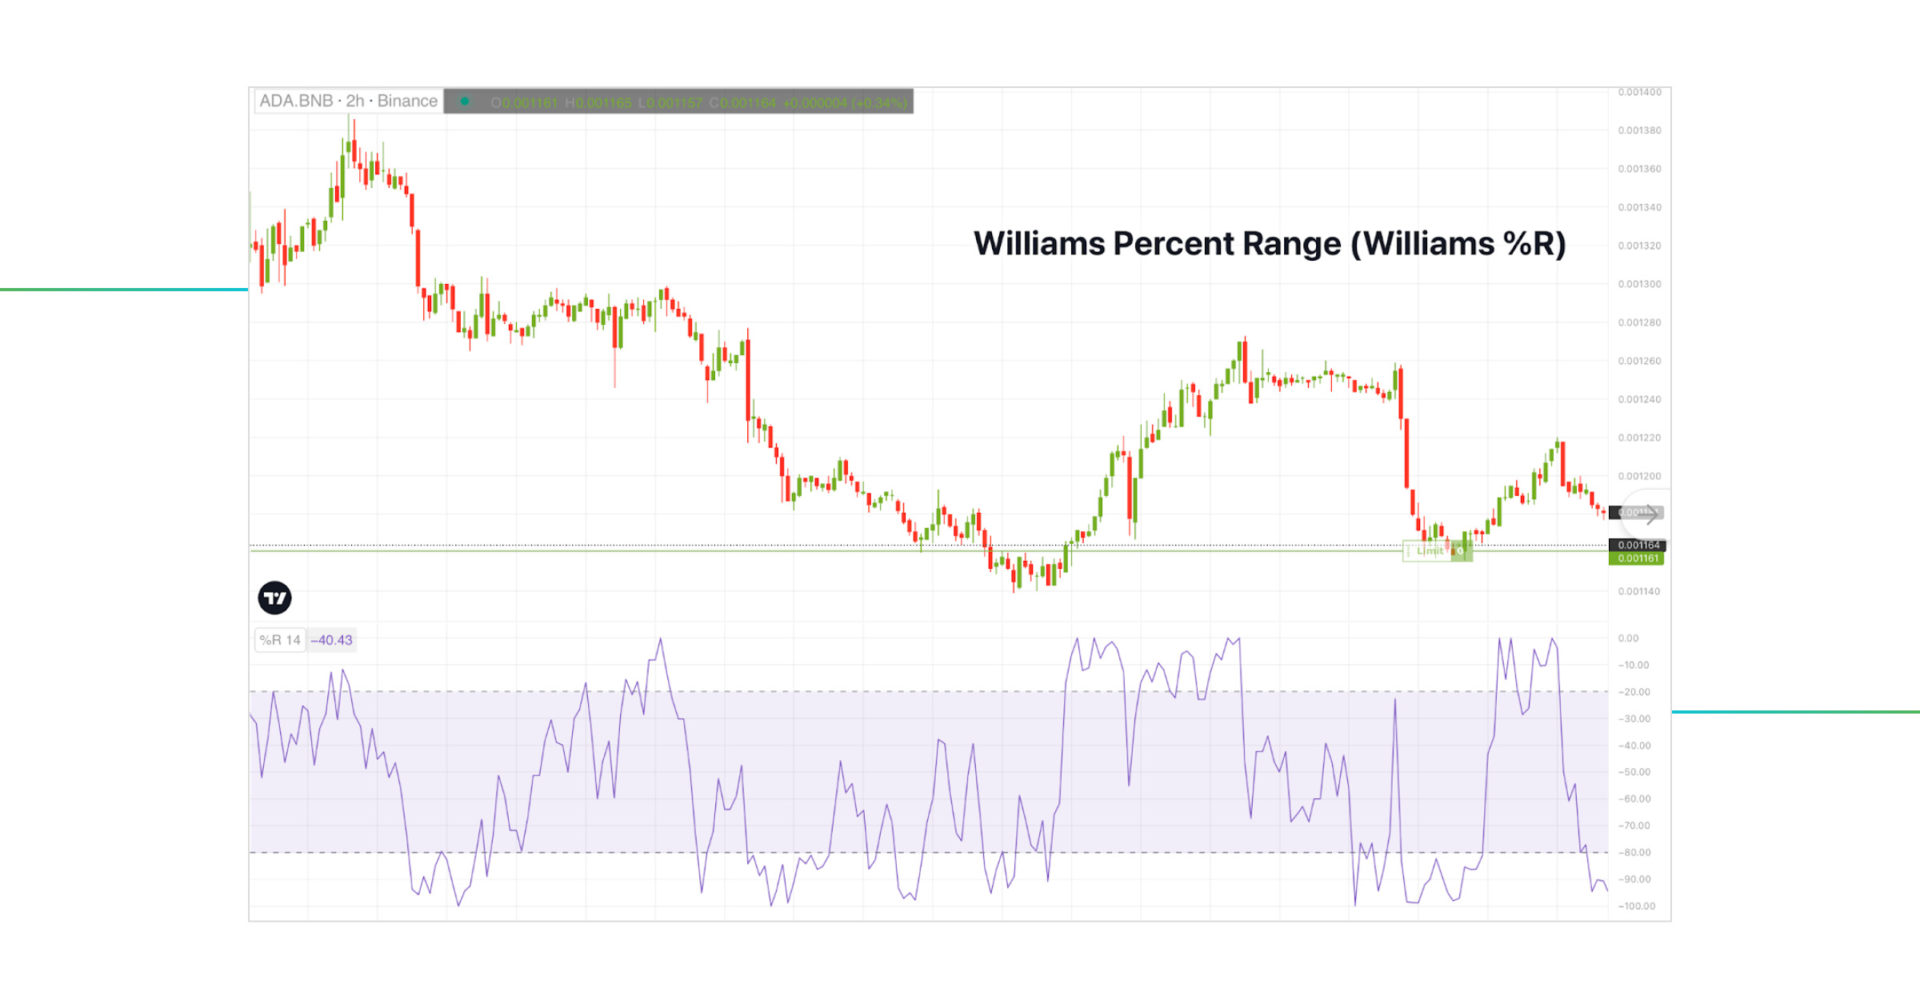
The Williams Percent Range is another widely recognized momentum indicator that displays where the most recent closing price is in relation to the highest and lowest prices of a specific time period. The Williams %R indicator oscillates between 0 and -100 and measures the strength of a market trend. Like the Stochastic RSI, Williams %R is a more sensitive version of RSI and is ideal for usage in volatile markets.
- Average Directional Index (ADX)
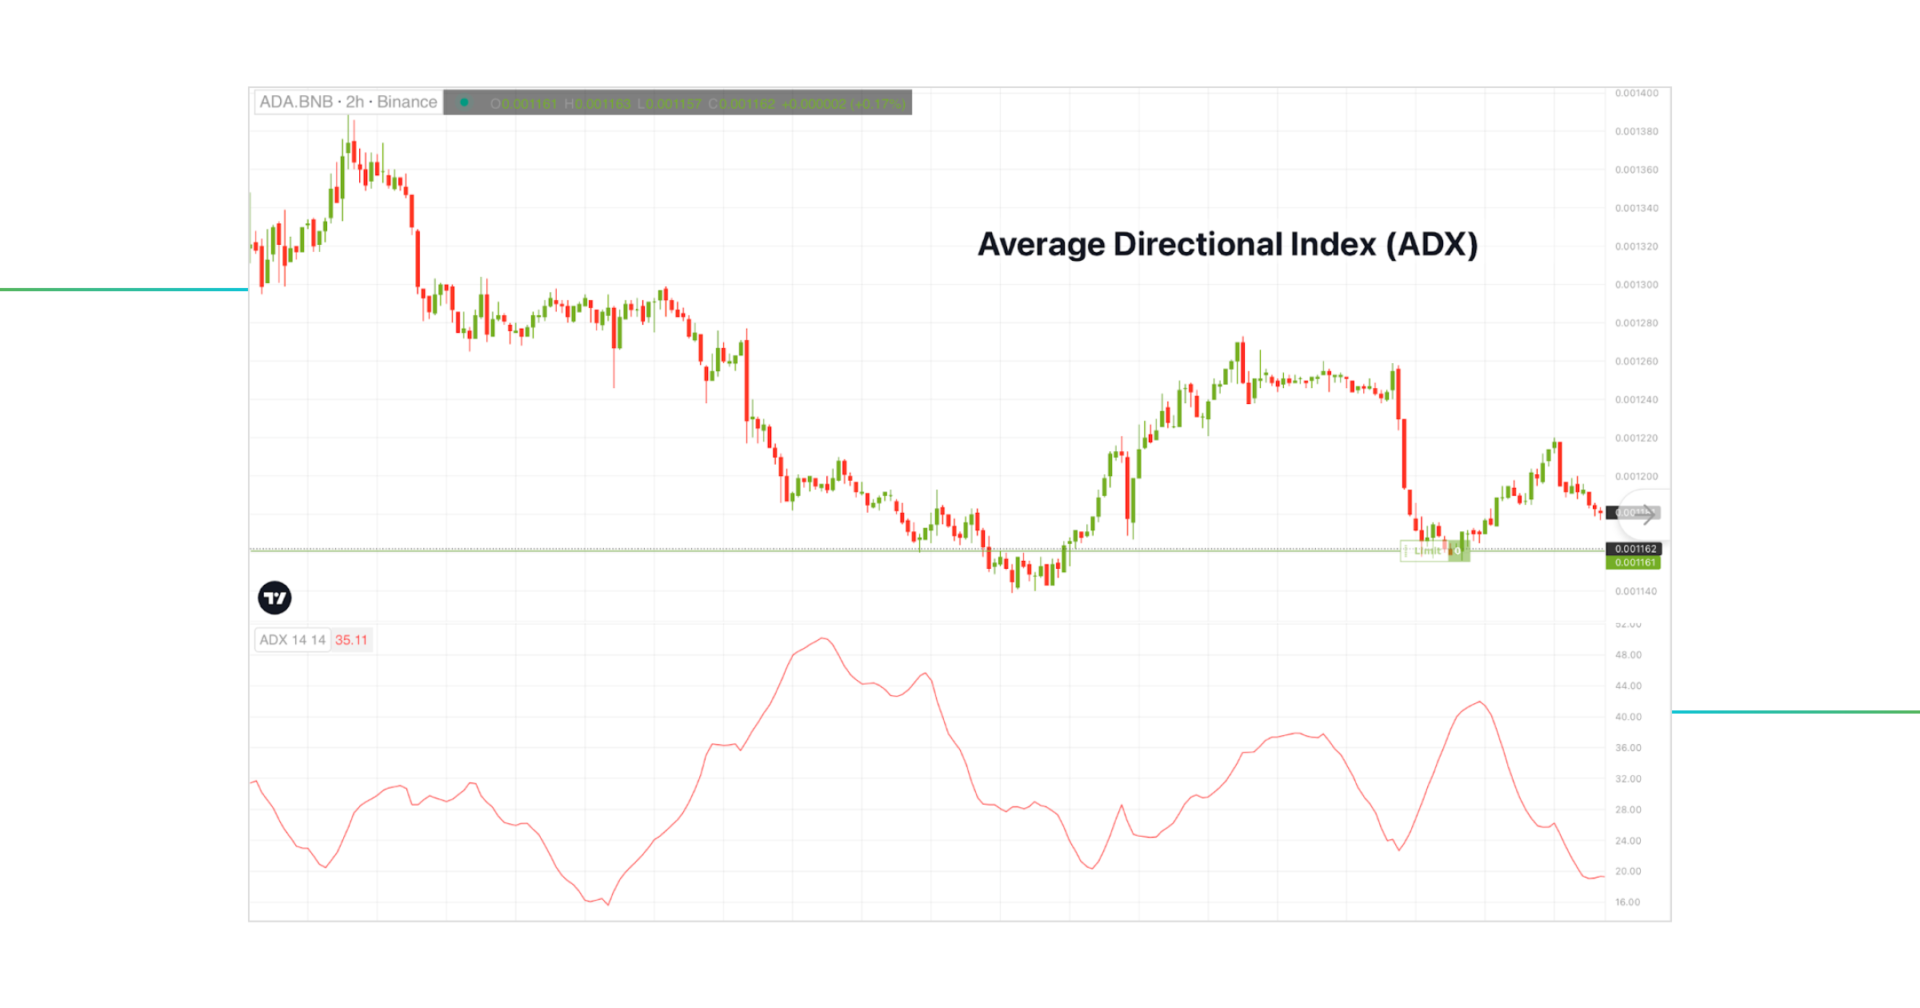
Last but not least – the ADX indicator. The Average Directional Index is a momentum-based indicator that was developed to evaluate the strength of a current market trend. The indicator is calculated using a series of directional movement indicators (DMI) which measure the strength and direction of price movements and then plotted as a single line on the chart that ranges from 0 to 100.
What is The Best Momentum Indicator?
Well, as we always say – there is no best momentum indicator. They all measure the same thing yet through different means.
However, in the global trading community, MACD is frequently referred to as the best momentum indicator to ever exist. Our experts have denoted a complete guide to the Moving Average Convergence Divergence and many other well-known technical indicators – all of the articles you can find in the GoodCrypto Blog.
So, if you are searching for the best momentum indicator to trade with, we recommend running through the basic ones, like RSI and MACD. Once you’ve learned these momentum indicators, you may explore their modifications to determine which fits your trading approach more.
Conclusion
As traders, we can confidently state that momentum indicators are an essential tool in any trader’s toolbelt. MOM is a perfect indicator to find out the current trend and direction of the market. It doesn’t matter how good the indicator is. Before making a trade, you should also utilize one or a few other indicators to confirm patterns and signals.
If you did learn something new after reading this piece, we consider it a success. Expand your trading knowledge further by checking out our other articles about technical indicators in the blog section.
Crypto Momentum Indicator Trading Made Easy with GoodCrypto!
Testing out various technical indicators and trading strategies has never been easier with GoodCrypto!
GoodCrypto is an innovative platform designed to simplify crypto asset management and trading. Whether you prefer the convenience of a mobile app or the versatility of a web application, the platform’s got you covered with a range of advanced tools, including the renowned MOM indicator.
With access to over 35 top cryptocurrency exchanges like Binance, Bybit, and Coinbase, you can manage your portfolio seamlessly from a single location. It is super convenient to have all of your accounts connected to one trading app, and thanks to Good Crypto, you can experience it.
Our service presents something for both crypto newbies and seasoned crypto enthusiasts. Our advanced set of features includes:
- Grid Bots, Infinity Trailing, and DCA Bots: these automated tools will help you improve your trading strategies and streamline your trading performance, making your trading less stressful and increasing your PnL without your direct involvement.
- Smart TA Signals will leverage the power of technical analysis and help you identify ideal market entry and exit points. The signal for each cryptocurrency is determined by 25 indicators and a current market state.
- Advanced Trailing Stop Orders will help you ride the market as long as it moves in your favor, boosting your profits and reducing risks of loss on each trade.
- Take Profit & Stop Loss combos will protect your trades and ensure the safety of your balance until triggered.
Get your trading journey started now! Try GoodCrypto now to experience the best trading app and learn why it’s the best go-to platform for both newbies and advanced traders.
If you have any more questions, please ask them in our Telegram public chat channel, which is open 365/24/7.


