
Hey traders!
This week was one many crypto traders would rather forget, but it still delivered a mix of notable news. Let’s review them:
quick weekly news
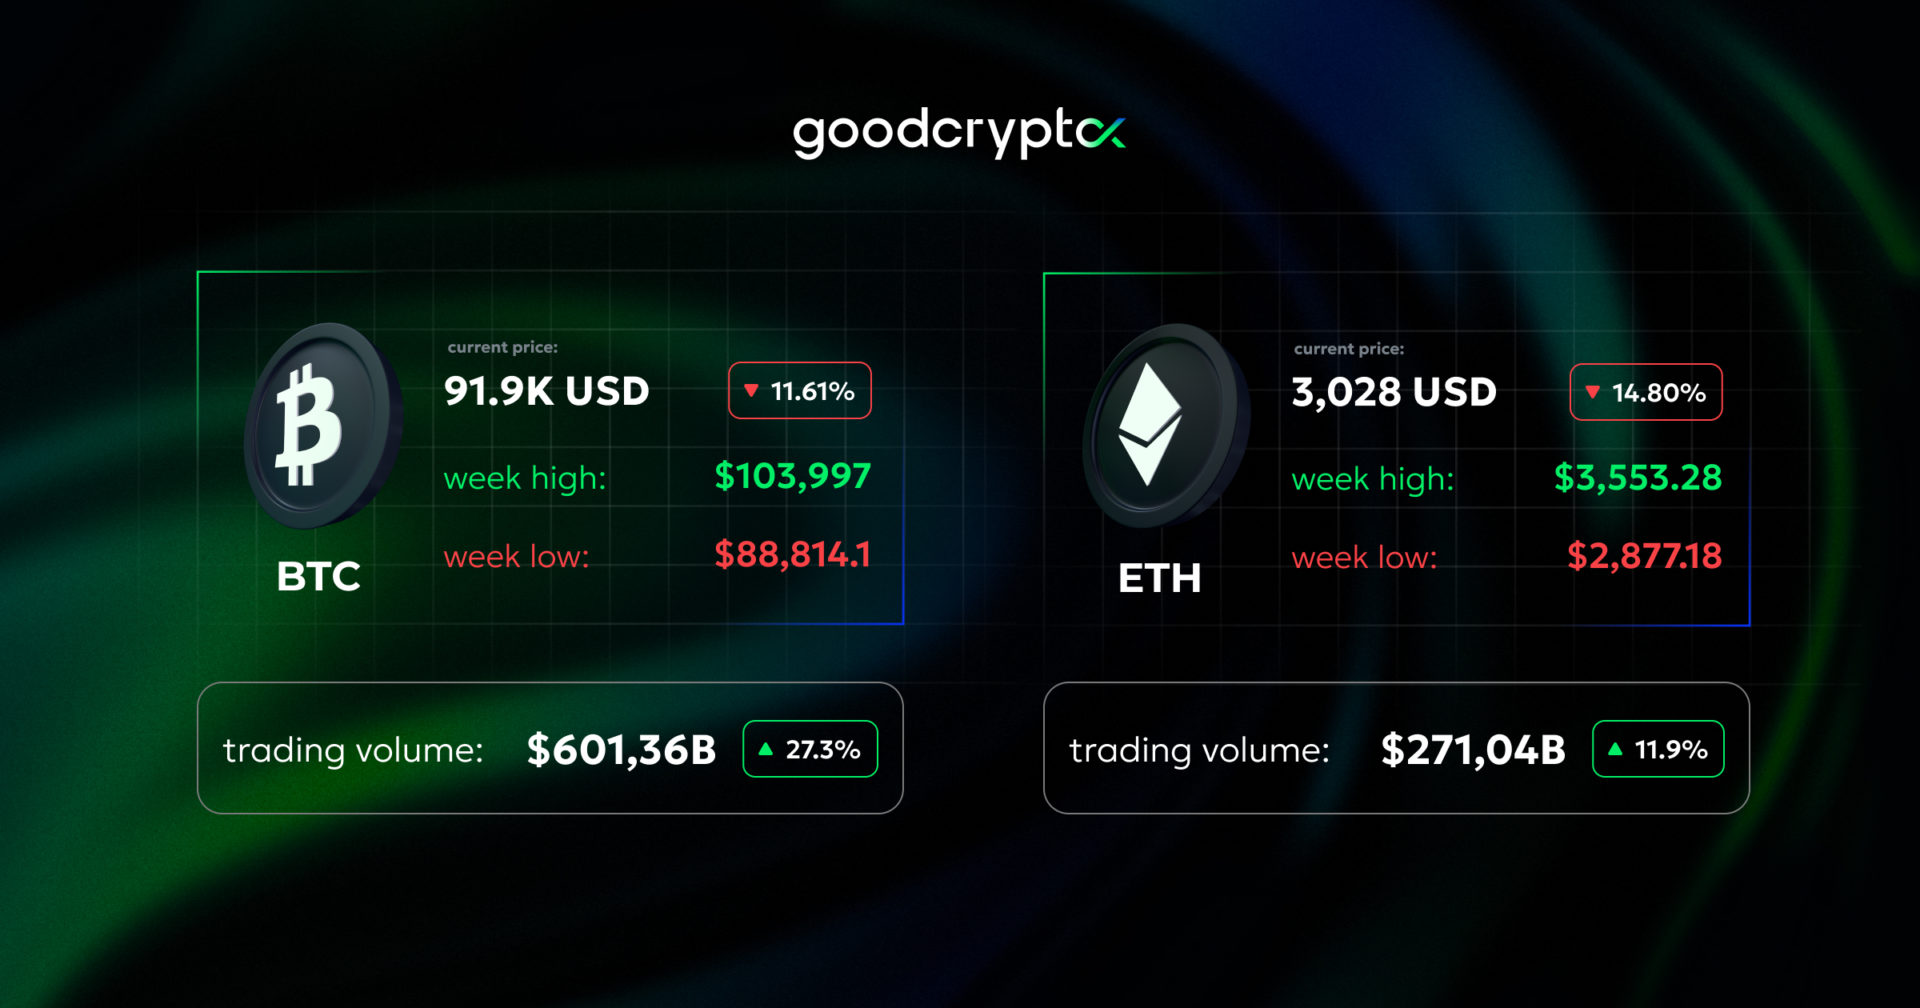
BTC falls below $89K as odds of December Fed rate cut plunge to 33%
Let’s start this digest with a pressing macro story, a sharp collapse in expectations for a December Fed rate cut. Fresh data from CME now puts the odds of a rate cut at just 29.6%, down from 70% in early November, as fears of sticky inflation and weakening investor sentiment intensify across risk assets.

Source: CME Group
As rate-cut optimism fades, Bitcoin tumbled below $90K, dragging broader sentiment into “extreme fear.” Prediction markets like Kalshi and Polymarket still price the probability of a cut higher than CME does, but even their traders are showing increased hesitation as macro conditions appear less supportive.
The macro headwinds are translating directly into technical stress for Bitcoin. The asset has now traded six days below its 365-day moving average, while its 50-day EMA has crossed below the 200-day EMA, a classic “death cross” signal that could imply further downside.
Despite intensifying speculation about the long-term cycle trajectory, sentiment remains firmly risk-off. The Crypto Fear & Greed Index is sitting at 16, meeting the yearly low (11 March 2025), reinforcing the notion that the market is navigating one of its most fragile psychological phases of the year.
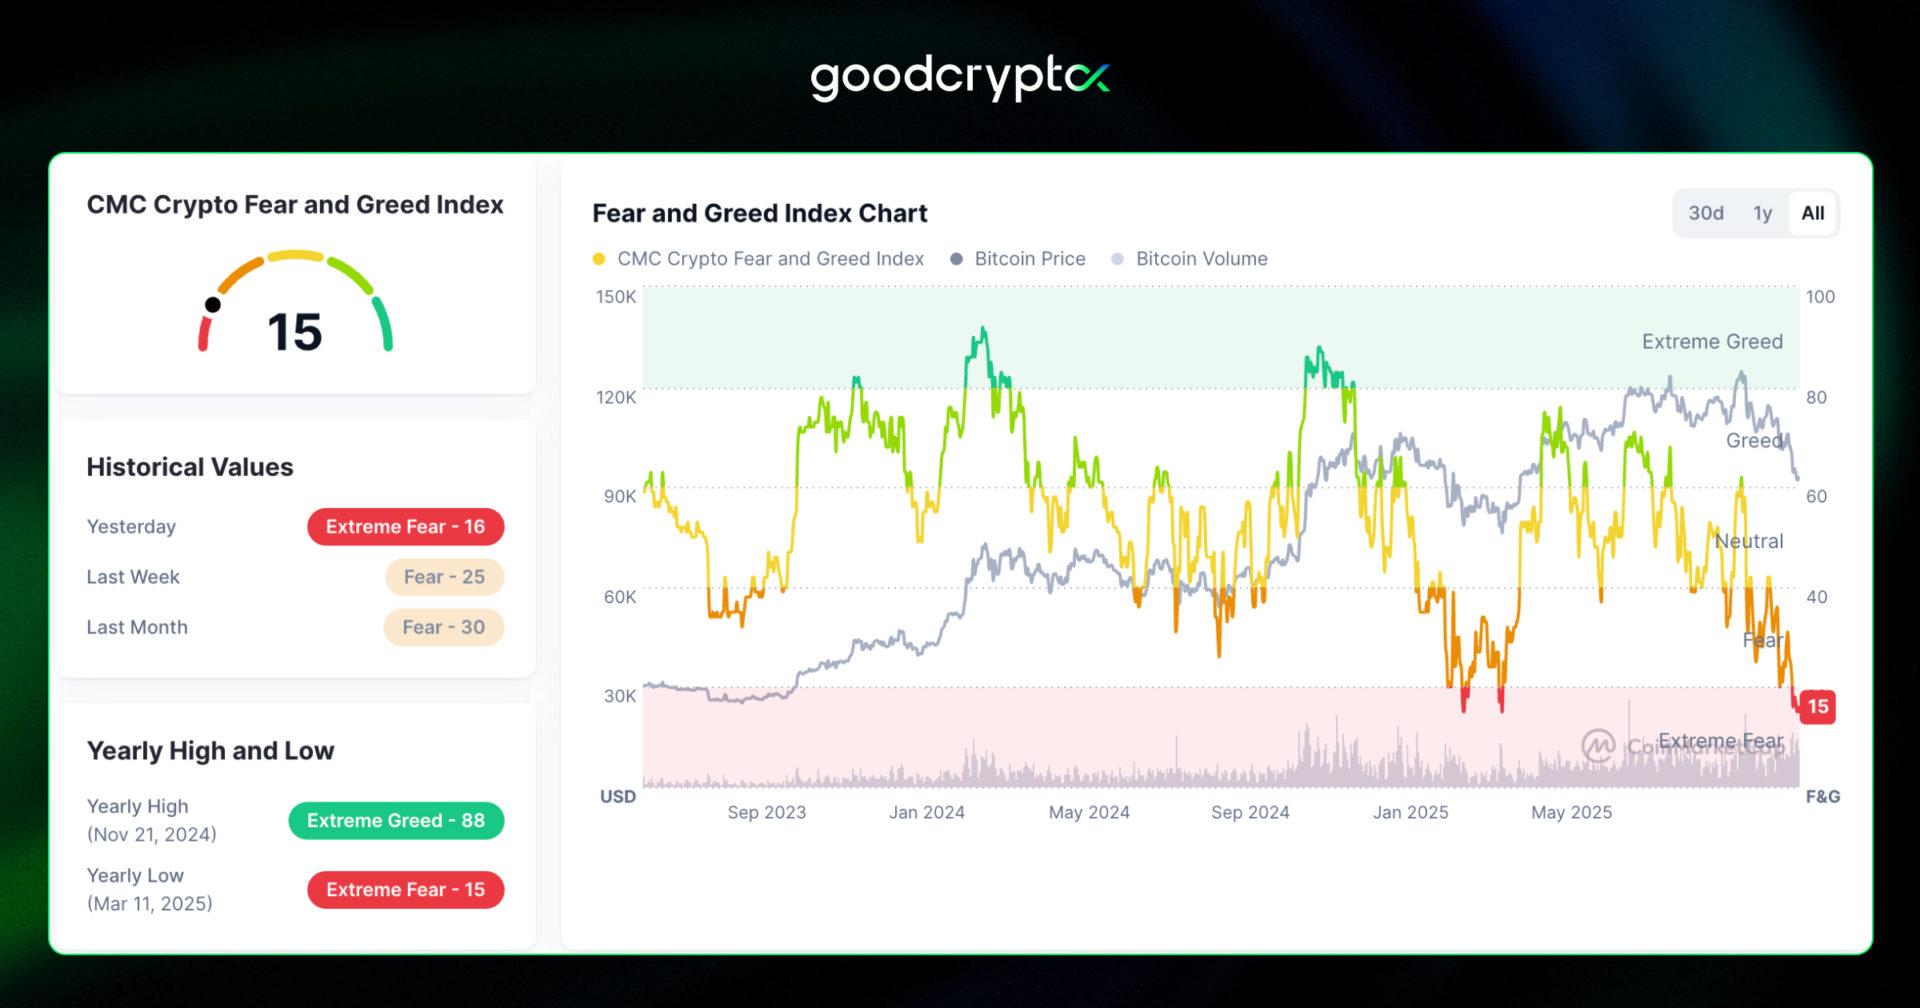
Source: CoinMarketCap
whales are accumulating $BTC despite the market correction
While market sentiment remains fragile, Bitcoin’s sharp drop below $90,000 has triggered a surge in whale accumulation, making this potentially the most active week for large $BTC transactions in 2025. Santiment recorded over 102,000 transfers above $100K and nearly 30,000 above $1M, signaling that major holders are stepping back in.
Despite early claims that whales drove the recent sell-off, Glassnode data shows the opposite: wallets holding more than 1,000 $BTC have risen steadily since late October. Moreover, Bradley Duke, managing director and head of Bitwise Asset Management in Europe, said that his company has noticed that as fear and panic grip the market, whales have been buying the dip.

Source: Bradley Duke
Some other experts, including Multicoin Capital’s Tushar Jain, believe the market has been pressured by a single large forced seller, noting systematic selling patterns likely tied to liquidations, a dynamic he expects to end soon.
While some are forecasting a potential bottom this week, whale accumulation is a key stabilizing signal amid the broader fear-driven downturn.
Bitcoin’s drawdown shouldn’t be blamed on US shutdown or AI bubble fears
But what really was behind the pullback? Analysts argue that Bitcoin’s latest drop has little to do with the US government shutdown or fears of an AI bubble. Instead, on-chain experts point to an overextended futures market as the primary catalyst, noting that excessive leverage pushed BTC into a necessary reset after its October peak near $125K. Analysts like Rational Root emphasize that similar drawdowns in recent years have repeatedly cleared the path for higher highs once leverage unwinds.
Market commentators also dismissed the idea that AI sector volatility is dragging crypto down. Nvidia’s blockbuster earnings undercut the AI-bubble thesis, with analysts like PlanC saying the list of plausible bearish catalysts is shrinking. What remains is a mix of delayed global liquidity and a weakening four-year cycle narrative, which some believe may be fading as institutional participation reshapes market behavior.
Despite the pullback, several analysts frame the reset as ultimately constructive. On-chain metrics show Bitcoin returning to “clean slate” conditions that previously preceded new upside phases. With the shutdown now over and US regulators heading back to work, some experts expect renewed ETF momentum in 2026, adding another potential tailwind once liquidity improves and leverage fully normalizes.
US government reopening may unleash crypto ETF floodgates
Let’s wrap up our digest with some positivity among the red charts. ETF pipeline could reopen in a major way, setting the stage for a wave of crypto products in 2026. Bitwise CIO Matt Hougan told CNBC there is “huge” pent-up demand for both single-asset ETPs and diversified index ETFs, predicting more than 100 new launches once the SEC resumes full regulatory momentum. Index-based products, in particular, are expected to attract passive investors seeking light, long-term exposure to digital assets.
Yet the immediate ETF landscape remains strained, as heavy outflows continue to pressure crypto markets. Even record-breaking launches like Canary Capital’s XRP ETF struggled to translate trading volume into price support, with XRP sliding over the past week. The situation is similar for Bitcoin ETFs, which have already seen roughly $1.1B in outflows this month, pushing many holders underwater as BTC briefly lost the 89,600 dollar average cost basis.

Source: Farside
Long-term whales fueled much of the recent selling, compounding ETF outflows and extending market weakness into November. Still, with legislative activity normalizing and regulatory agencies fully operational again, many believe the groundwork is being laid for an ETF-driven resurgence next year once liquidity improves and capital starts flowing back into the sector.
how to trade with Fibonacci retracement?
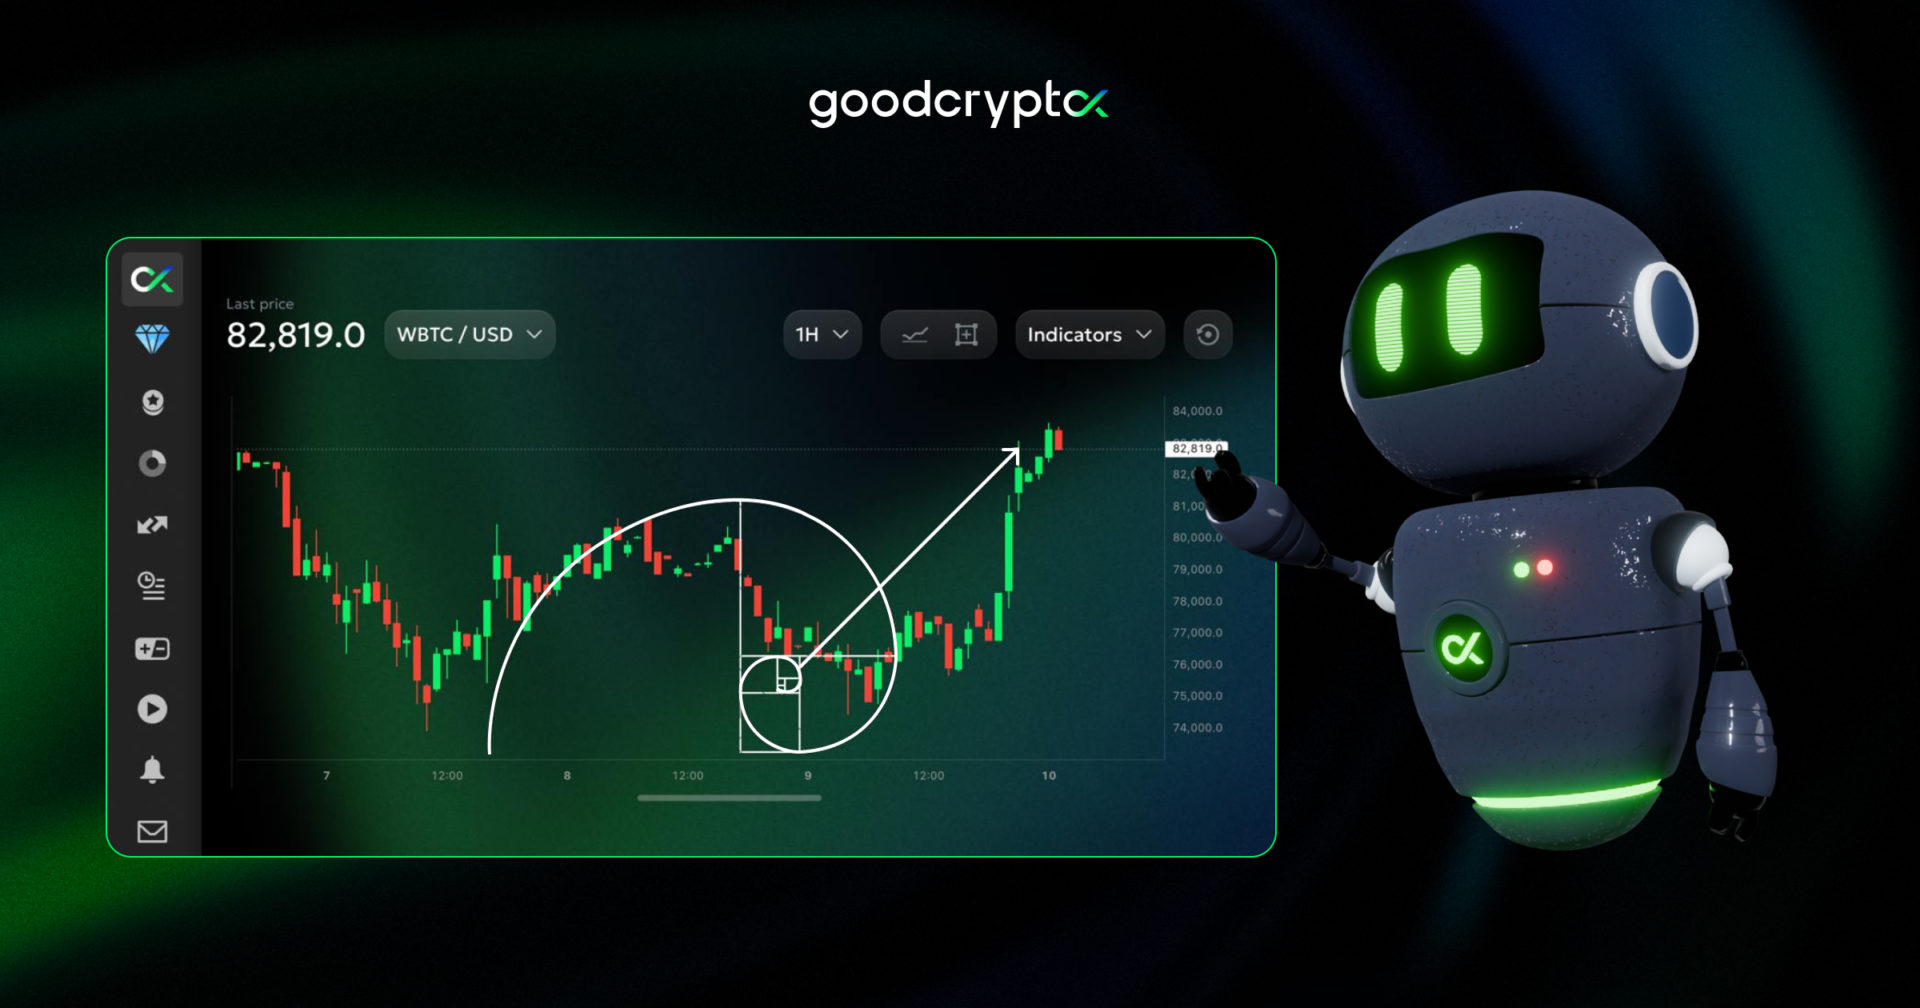
📊 Fibonacci retracement is a core market tool used to spot potential reversal zones and major support or resistance levels based on previous price swings. When applied correctly, it helps you pinpoint high-probability entry and exit levels across any crypto trend.
How to draw Fibonacci retracement:
🔸 Identify a clear trend and mark the most important swing high and swing low;
🔸 Draw from left to right: bottom to top for an uptrend, top to bottom for a downtrend;
🔸 Pay the most attention to the 0.618, 0.5, and 0.382 levels, since these zones often trigger reactions, bounces, or trend reversals.
Want to see how this plays out in real crypto charts? We’ve got you covered! Start using Fibonacci like a seasoned pro with a complete guide by goodcryptoX.
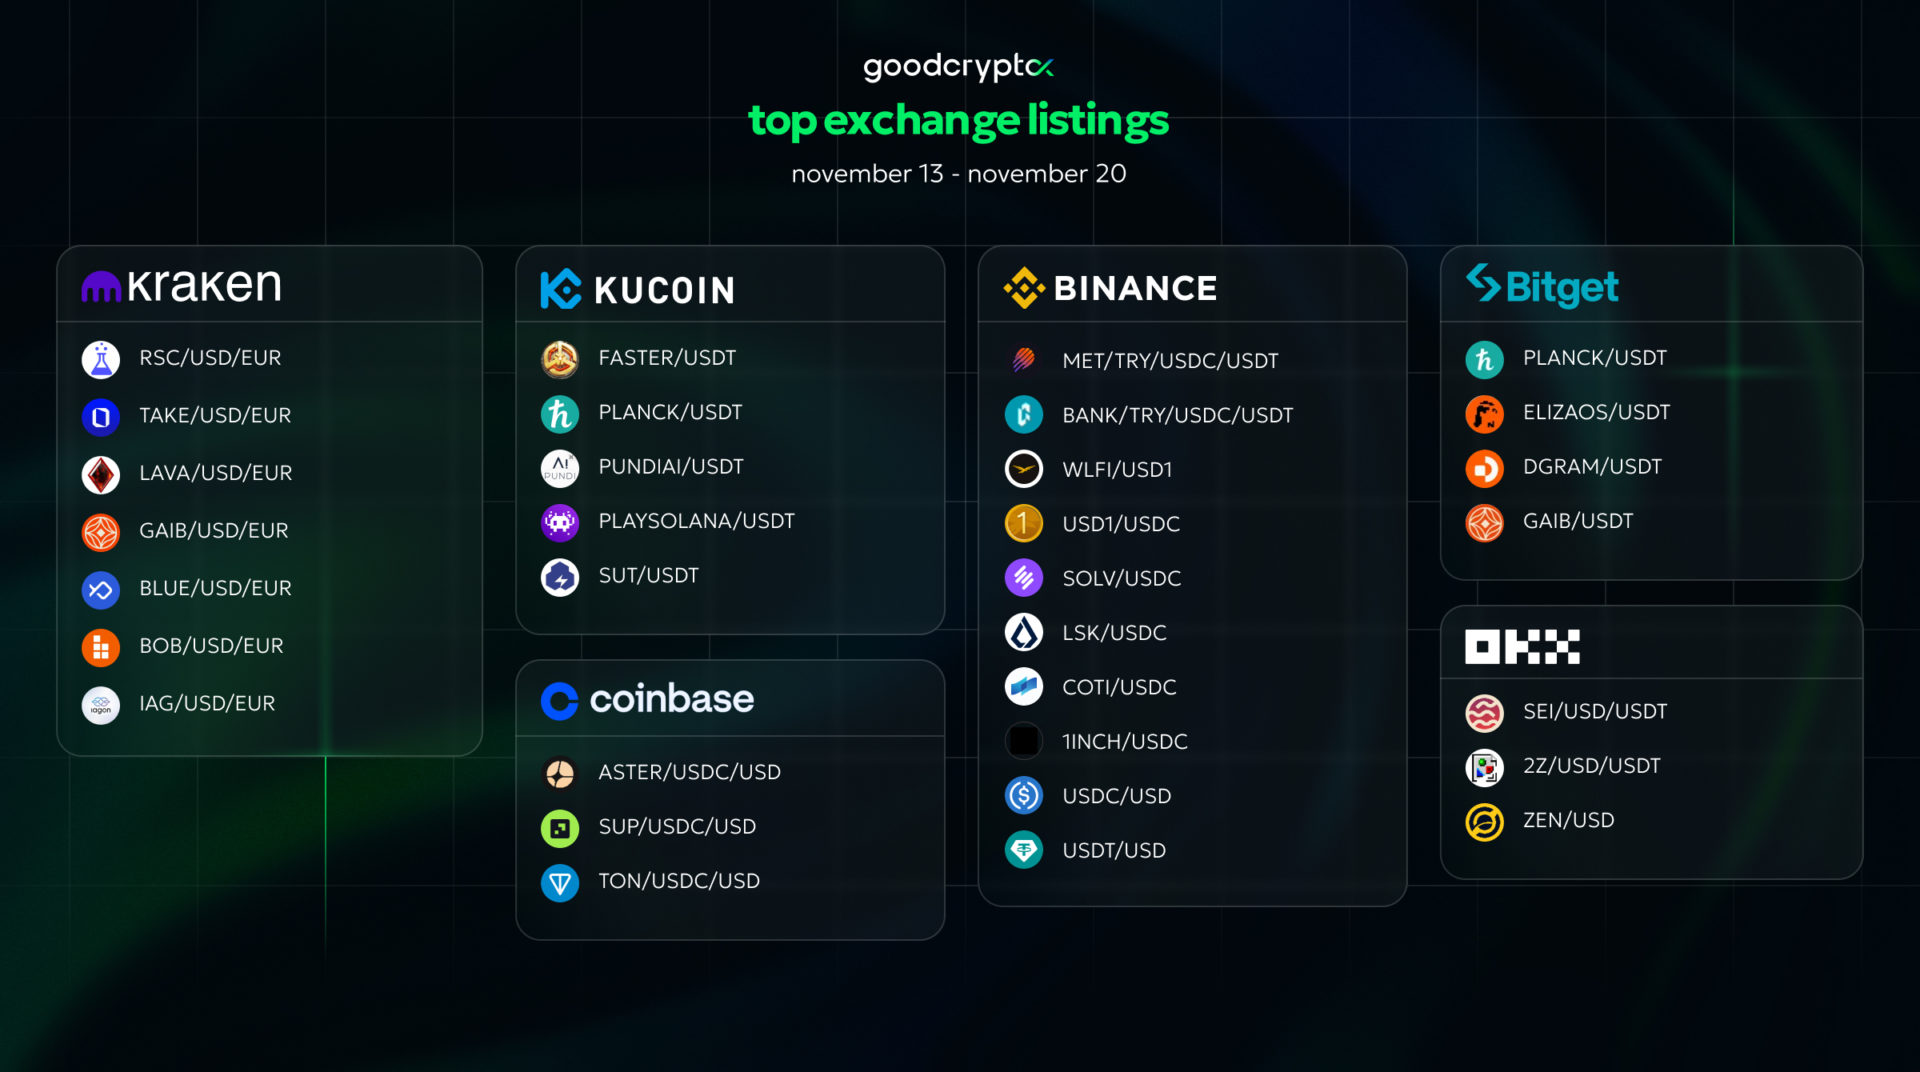
Receive an instant notification when a new coin is listed with GoodCrypto’s PRO plan.
top crypto meme of the week
We hope this digest was valuable and informative for you! If you want to be the first to receive new crypto insights and stay up-to-date with the market, follow us on Twitter or Telegram. Become a better trader with the goodcryptoX app!